
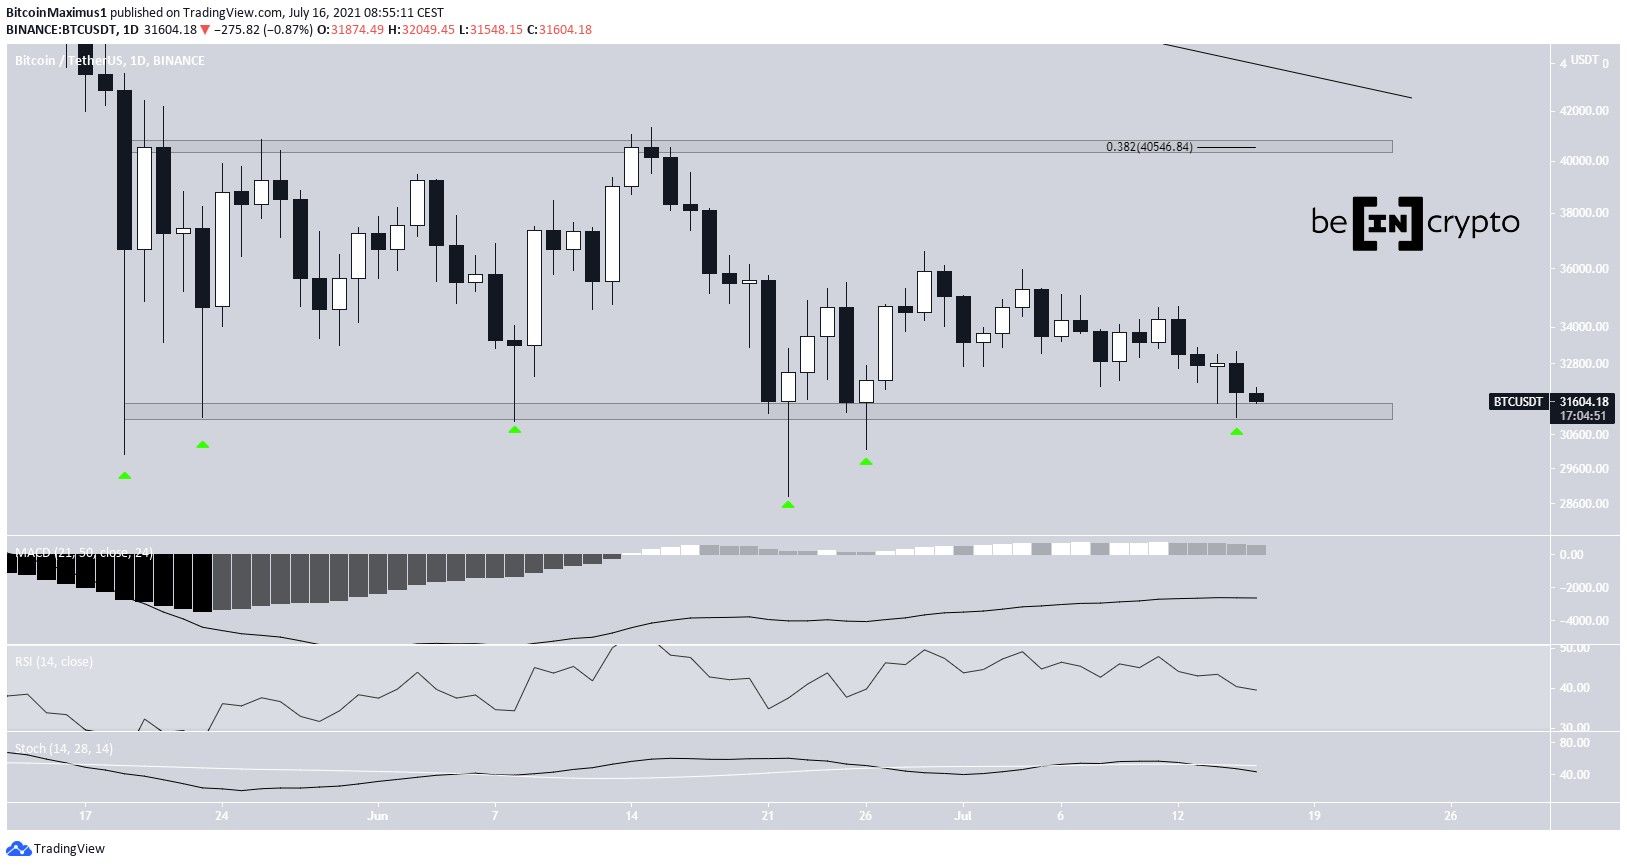
Bitcoin (BTC) continued its descent on July 15 and fell all the way to a low of $31,113. This caused another validation of the $31,300 support area.
It’s currently trading inside a short-term descending parallel channel, from which a breakout appears to be the most likely scenario.
Bitcoin returns to support
On July 15, BTC reached a low of $31,113. This came as a result of a significant bearish candlestick, which invalidated the bullish hammer from July 14. BTC touched the $31,300 horizontal support area for the sixth time (green icon).
Technical indicators are bearish. The MACD has given a bearish reversal signal, the RSI is below 50, and the Stochastic oscillator has made a bearish cross.
The closest resistance is found at $40,550. This target is both the 0.382 Fib retracement resistance level and a horizontal resistance area.
Short-term channel
The six-hour chart shows that BTC has been trading inside a descending parallel channel since June 29.
On July 15, it reached the support line of this channel for the third time and bounced (green icon). However, the touch occurred below the 0.618 Fib and above the 0.786 Fib retracement support levels. Therefore, BTC does not have Fib support to also go along with the channel support.
While the RSI has generated some bullish divergence the MACD is still bearish.

Future movement
There are two possibilities for the main wave count. The first indicates that a bearish impulse (orange) has been completed when measuring from the April 14 all-time high price.
The fact that the wave 2-4 line has been broken makes it unlikely that BTC is still in wave five. Therefore, the first scenario suggests that a bearish impulse has been completed and BTC is now correcting upwards.

The second possibility suggets that BTC is still in wave four and another drop will occur after it’s completed. While the longer-term movement would differ, the short-term movement would like be similar in both scenarios.

Because parallel channels usually contain corrective movements, it’s likely that BTC will break out from the channel and move towards the range highs.
The reaction once it gets there will help determine whether BTC is still in wave four or if it’s already completed wave five.

For BeInCrypto’s latest bitcoin (BTC) analysis, click here.
