
The bitcoin (BTC) price had been increasing since May 5 but was rejected once it reached the $58,000 resistance area the next day.
BTC is expected to find support at one of the two Fib support levels outlined below. Afterward, a breakout from the current pattern is likely.
Ongoing BTC bounce
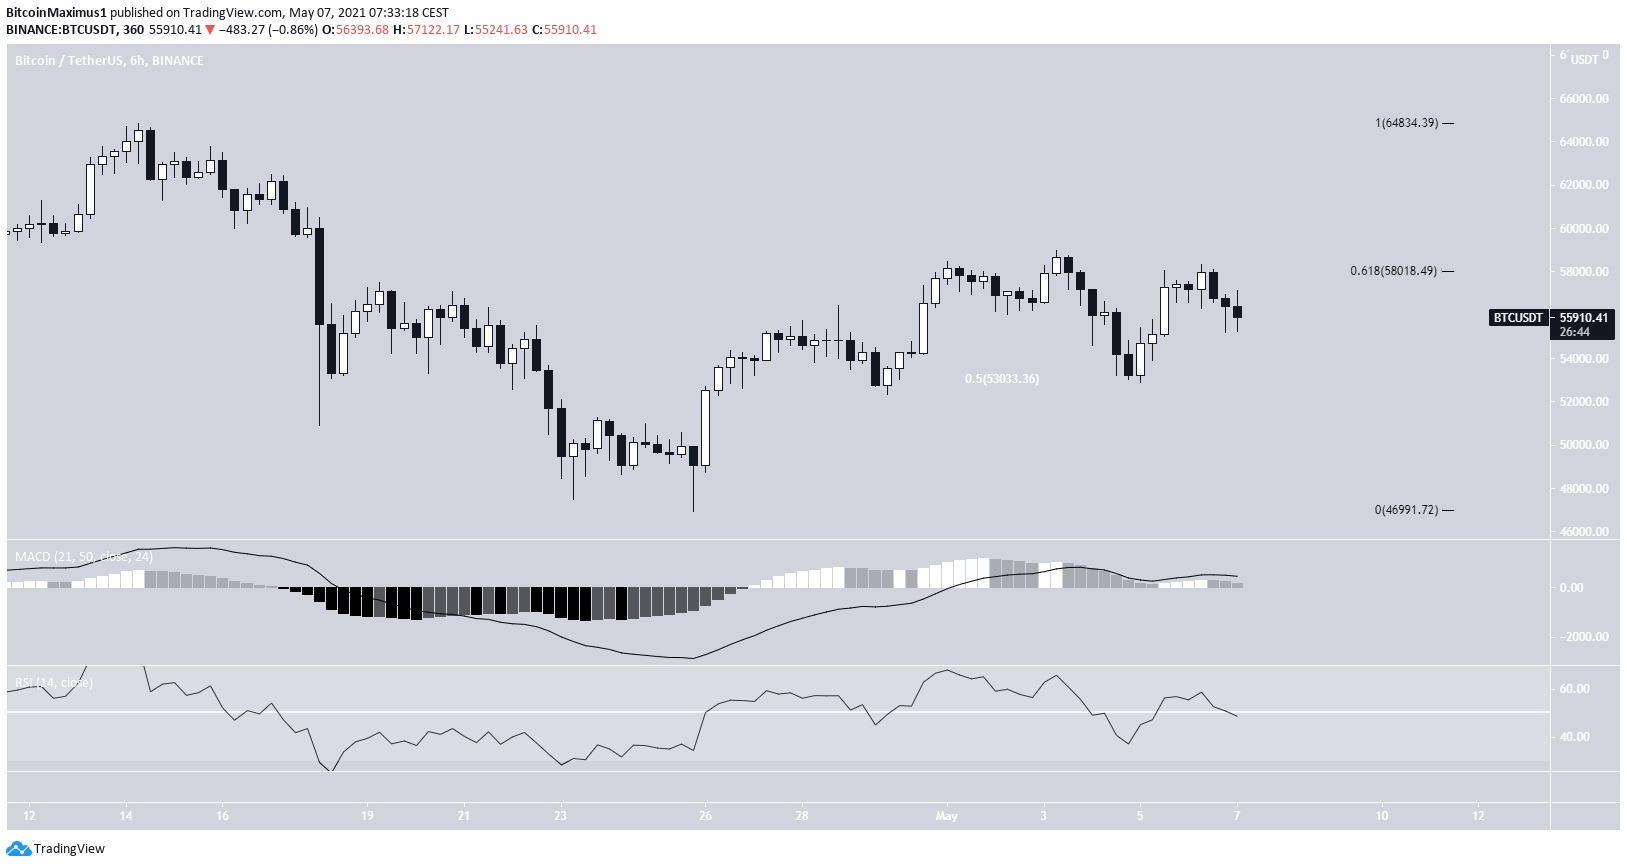
BTC has been moving upwards since bouncing at the $53,000 support area on May 5. The support area is created by the 0.5 Fib retracement level of the most recent upward movement (white).
The upward move continued until a high of $58,360 was reached. The high was made very close to the 0.618 Fib retracement level (black) when measuring from the most recent downward movement.
BTC was then rejected and has been decreasing since.
Technical indicators are relatively neutral. The MACD is positive and the RSI is above 50. However, both are showing a lack of momentum, which in turn fails to confirm the direction of the trend.
Short-term BTC movement
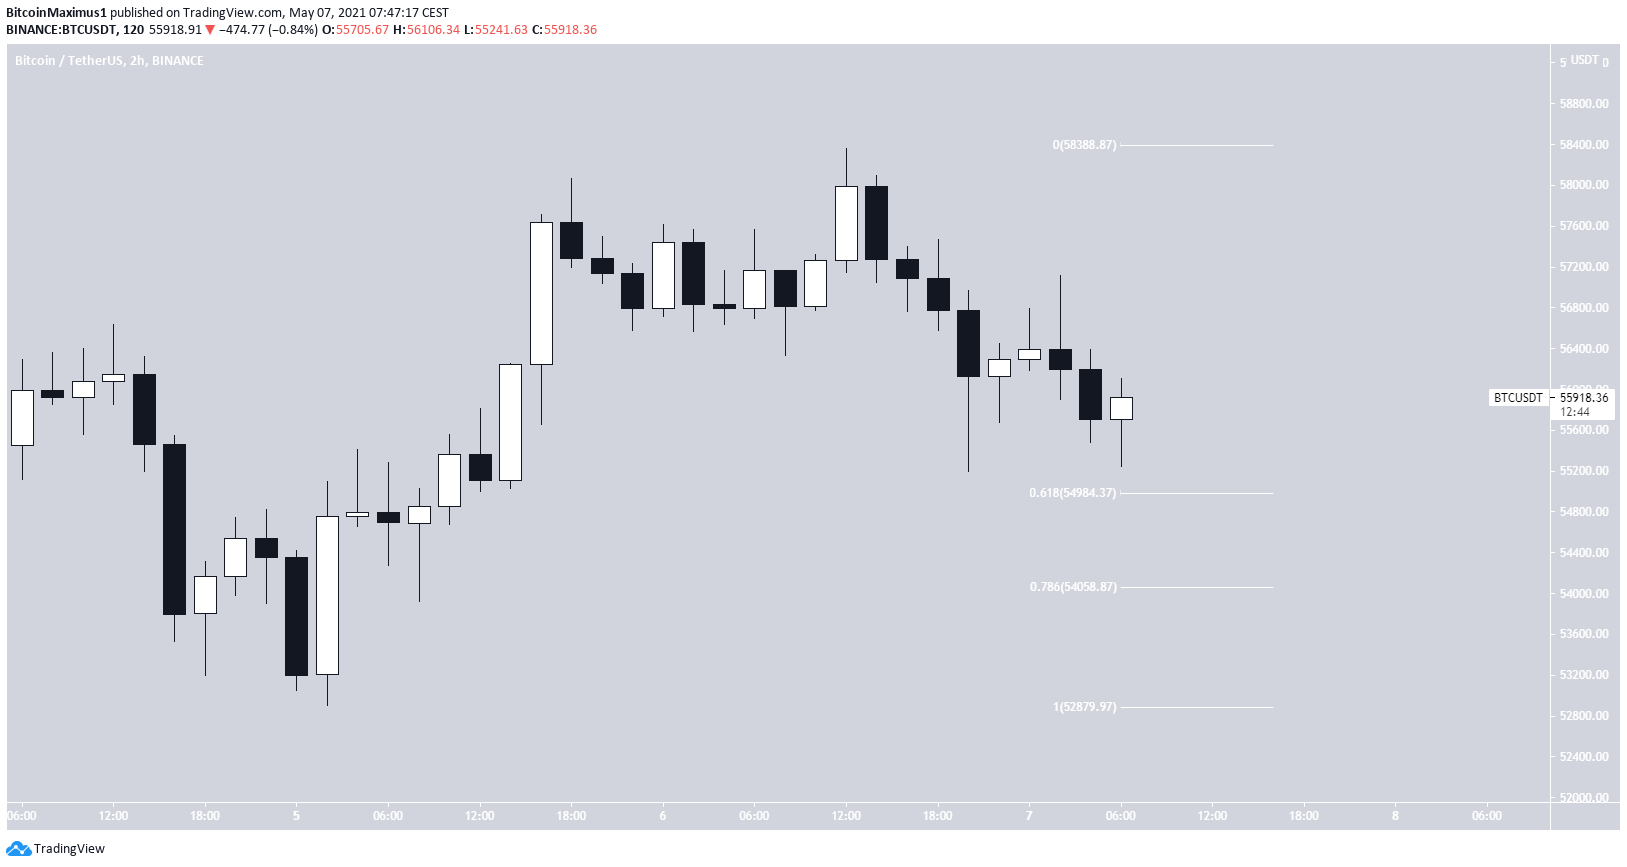
The short-term chart shows that the price has reached the 0.618 Fib retracement support level at $55,000 and began a bounce. It has potentially created a double bottom pattern, which is evident with long lower wicks.
The next support area is the 0.786 Fib retracement level found at $54,350.
While BTC could fall towards the latter, it’s expected to create a higher low and move upwards. This is because it seems likely that a new impulse was initiated with the May 5 bounce.
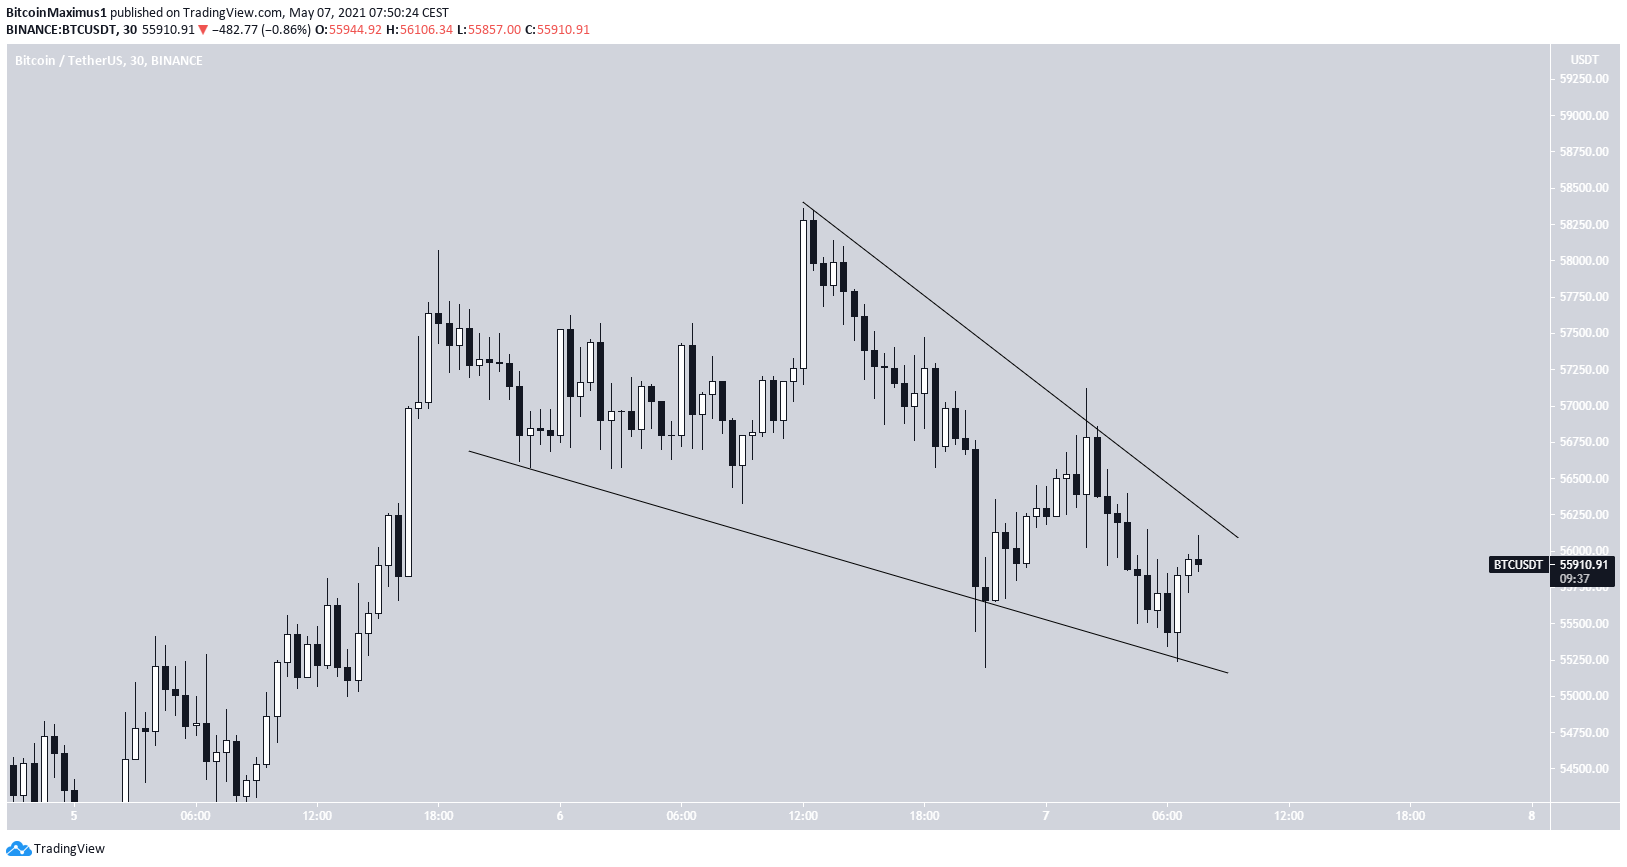
The 30-minute chart shows a descending wedge, which is normally considered to be a bullish reversal pattern.
It also indicates that the price is likely to break out and begin to move upwards.
Conclusion
BTC is expected to find support at either the 0.618 or 0.786 Fib retracement support levels and break out from the descending wedge after.
For BeInCrypto’s previous bitcoin (BTC) analysis, click here.
