
Bitcoin (BTC) increased considerably on May 5, creating a bullish engulfing candlestick in the process.
BTC is expected to continue increasing, breaking out from the $56,000 resistance area.
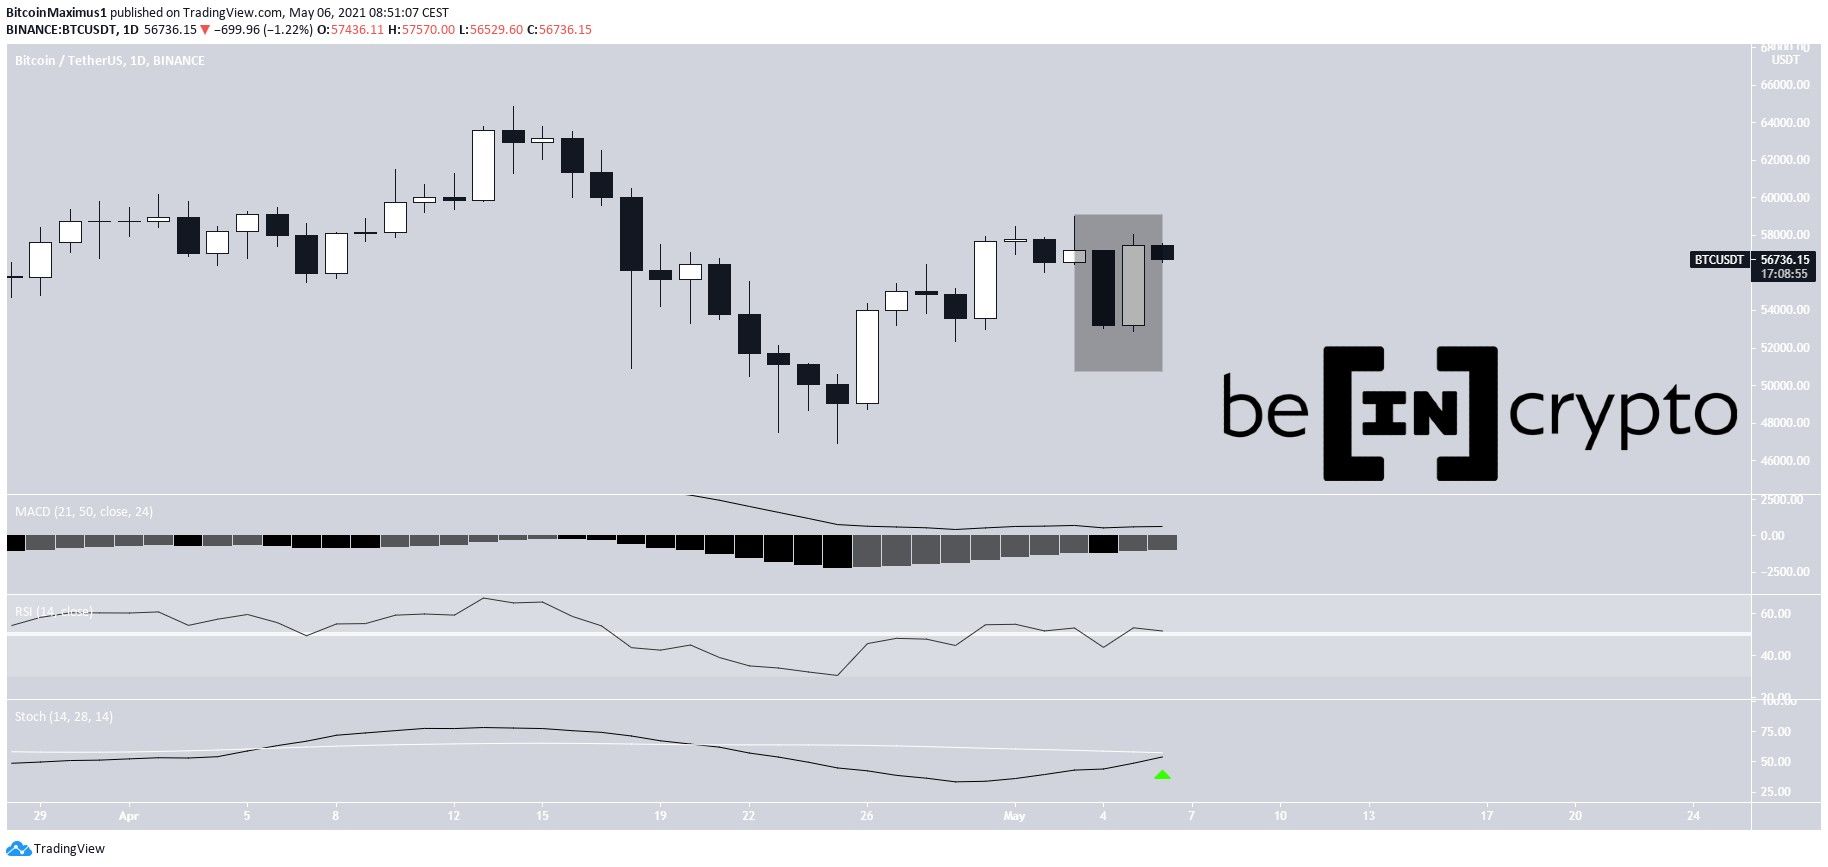
Bullish engulfing BTC candlestick
BTC bounced considerably on May 5 after reaching the $53,000 support area. It created a bullish engulfing candlestick, negating the bearish implications from the previous day’s decrease. This is a sign that the trend is still bullish and the price is likely to continue heading upwards.
Technical indicators are also bullish. This is especially evident by the growing bullish cross in the Stochastic oscillator (green arrow).
In addition, the MACD is moving upwards and is positive, and the RSI has just crossed above 50.
Therefore, the daily time-frame indicates that the current BTC trend is bullish.
Short-term BTC movement
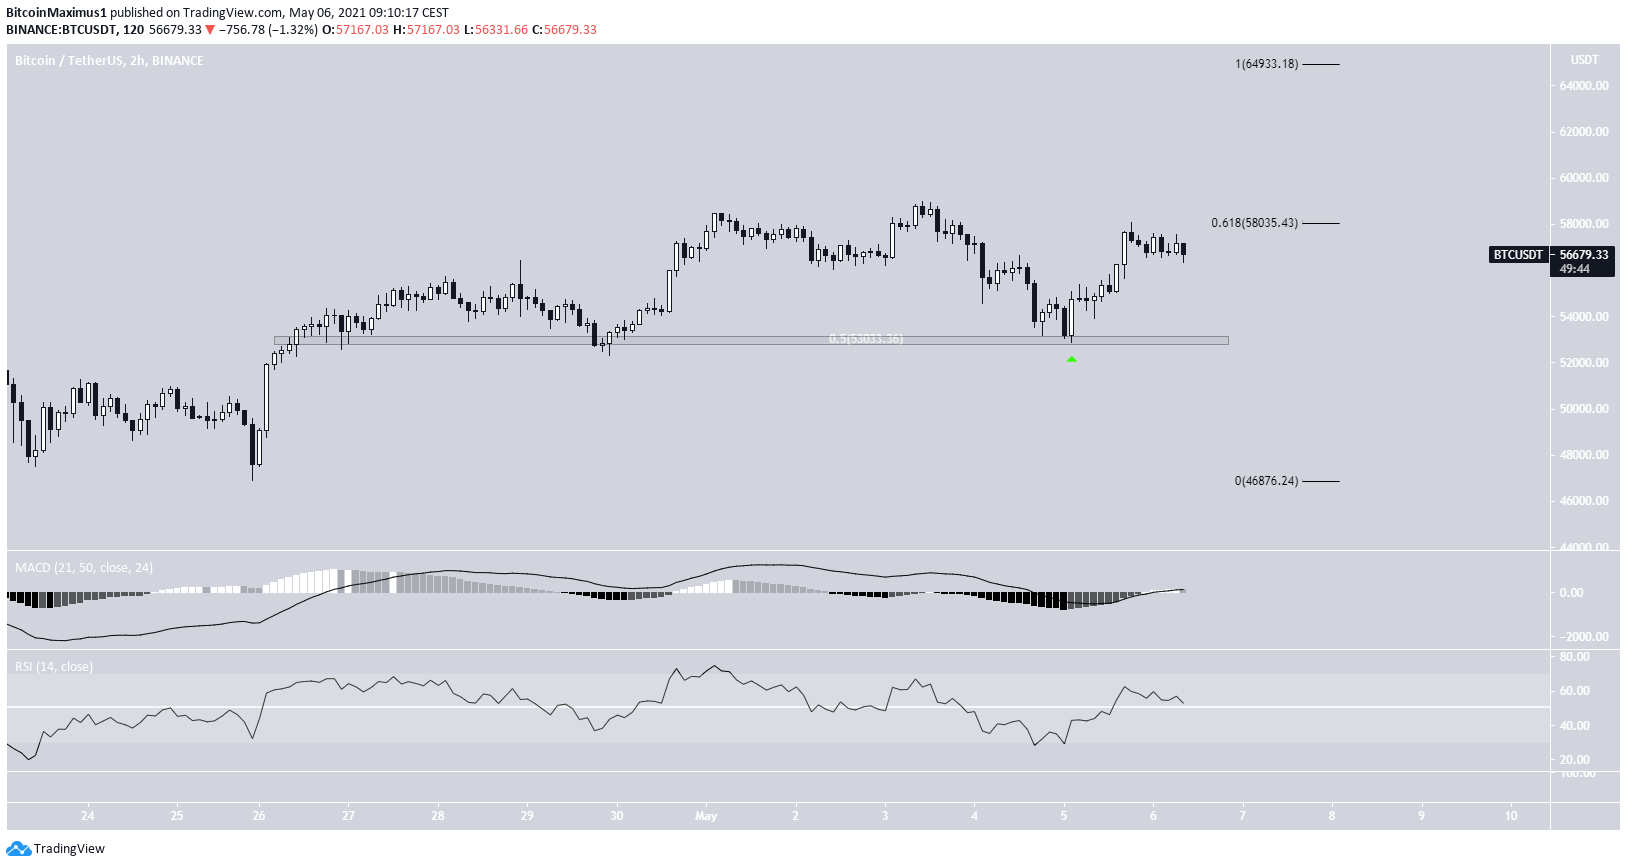
The two-hour chart also aligns with this scenario. First, it shows that BTC has bounced at the $53,000 area, which is the 0.5 Fib retracement support level (white) of the previous upward movement.
Secondly, both the MACD and RSI are bullish. The former has just crossed into positive territory while the latter has crossed above the 50-line.
Therefore, if BTC manages to clear the 0.618 Fib retracement resistance at $58,000, it’s likely to continue moving higher toward a new all-time high price.
Wave count
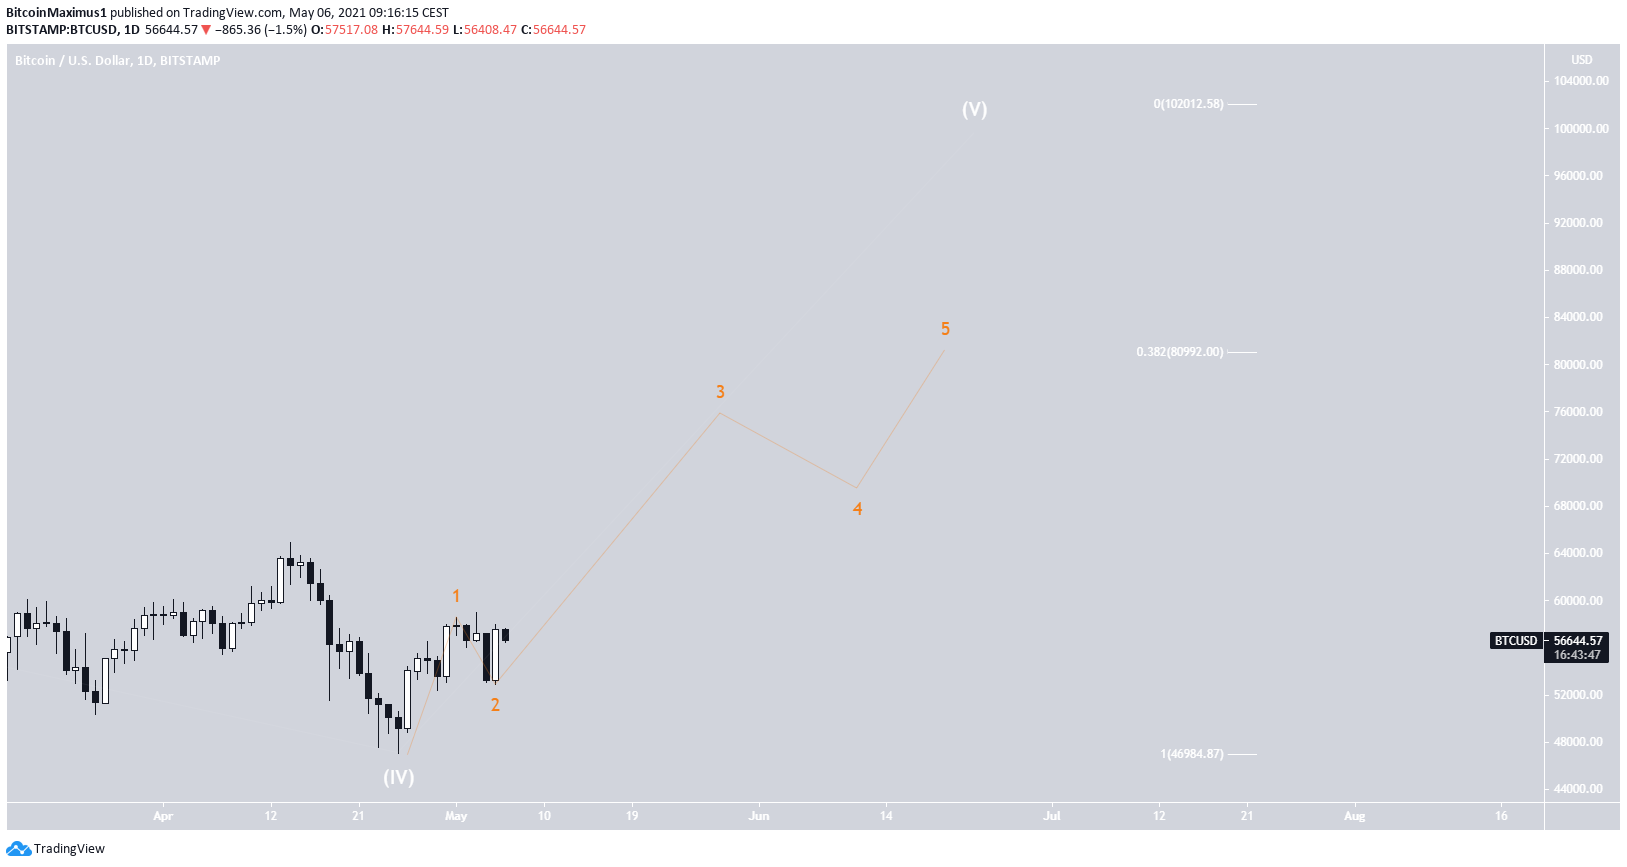
The wave count suggests that the price is in sub-wave three (orange) of wave five (white) of a long-term bullish impulse.
The most likely targets for the top of the current upward move are located at $81,300 and $102,300. These targets are found by using a Fib projection on waves 1-3.
A decrease below the April 24 low of $47,004 would invalidate this particular wave count.
Conclusion
Bitcoin is expected to resume the ongoing bounce from $53,000 and gradually increase towards new highs.
For BeInCrypto’s previous bitcoin (BTC) analysis, click here.
