


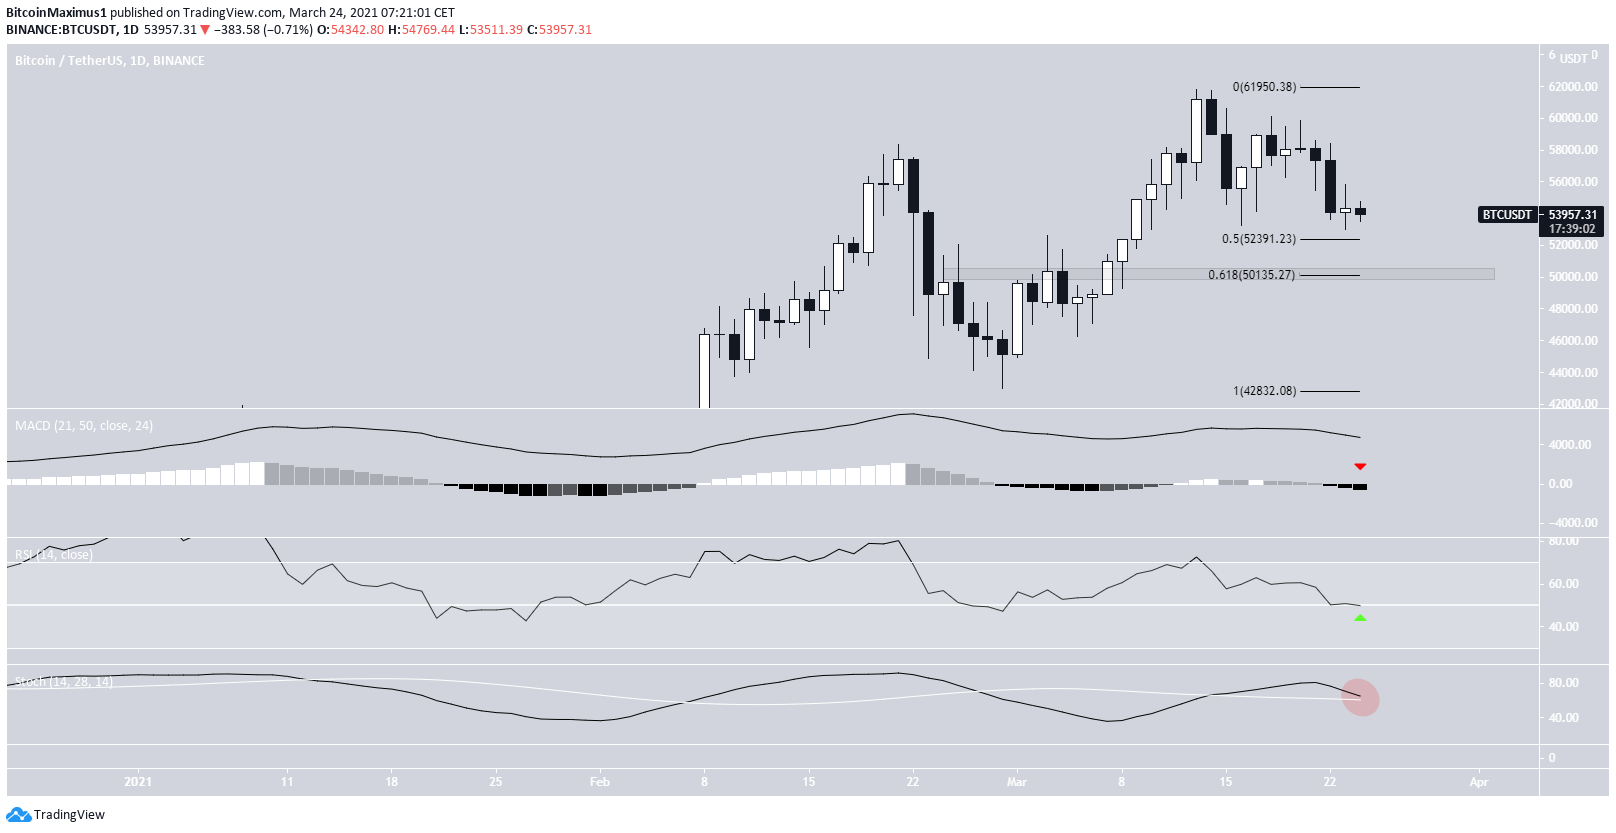
The bitcoin (BTC) price managed to stop decreasing on March 23, creating a Doji candlestick.
BTC is expected to bounce in the short-term, though it’s not clear if a longer-term low has been hit.
Daily Outlook For BTC
BTC attempted to bounce yesterday, but failed to do so and created a Doji candlestick. This is a sign of indecision.
BTC is currently trading just above the 0.5 Fib retracement level at $52,500. Below this level, there is very strong support at $50,250, both from the 0.618 Fib level and a horizontal support area.
Technical indicators have started to lean bearish. The MACD has crossed into negative territory. The Stochastic oscillator is very close to making a bearish cross.
However, the RSI is just above 50, a very suitable level for a bounce.
As outlined in yesterday’s article, the RSI has historically bounced at this level when it has been up trending.
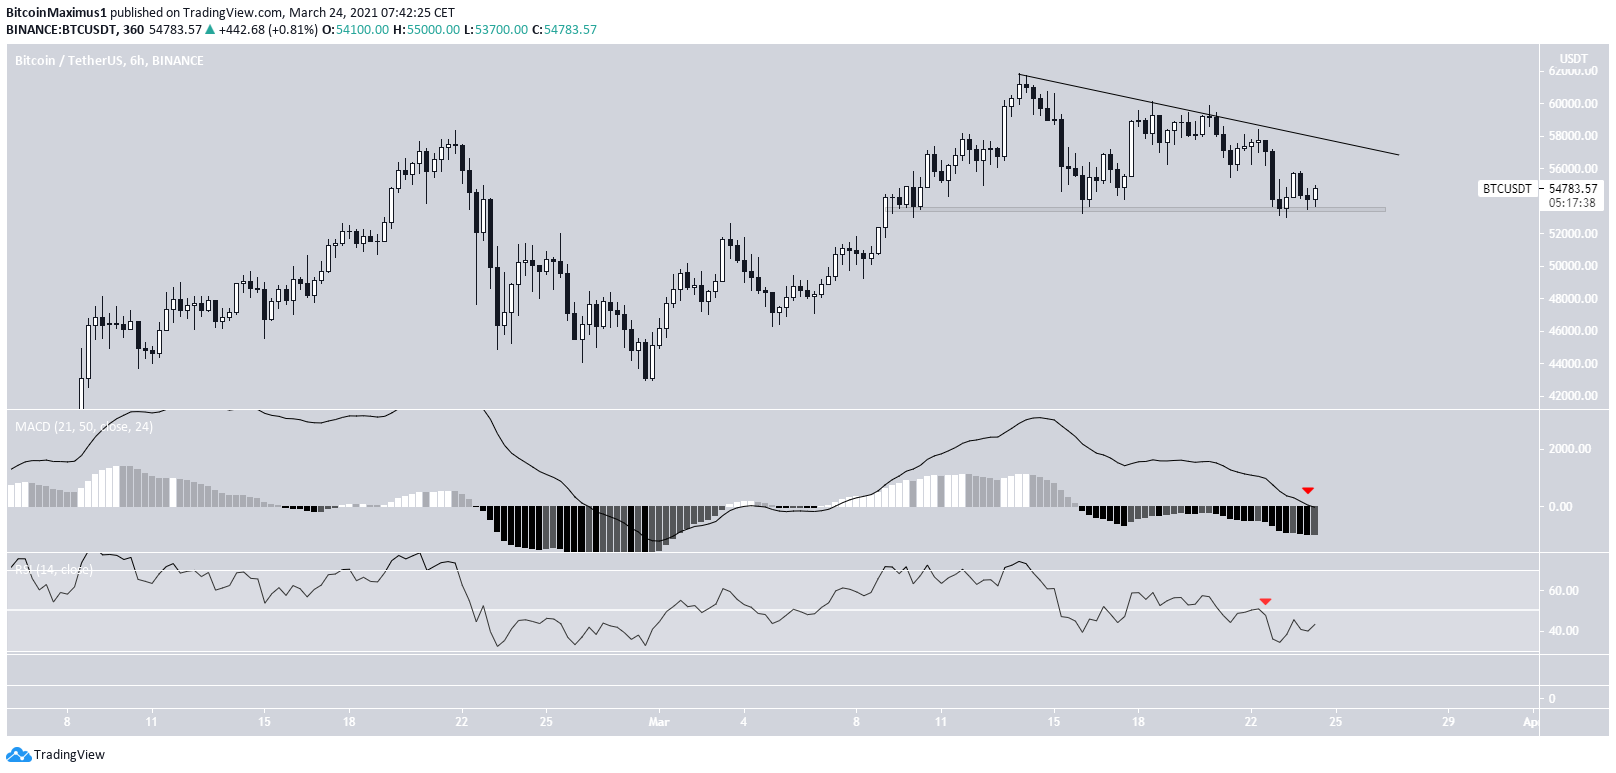
Short-Term Movement
The shorter-term chart shows that after yesterday’s bounce there is a potential descending triangle in place. This is normally considered a bearish pattern.
The resistance line of the triangle is currently near $58,000.
Technical indicators are bearish. Thus, the most likely scenario would be a drop to the $52,500 and/or $50,250 support levels previously outlined.
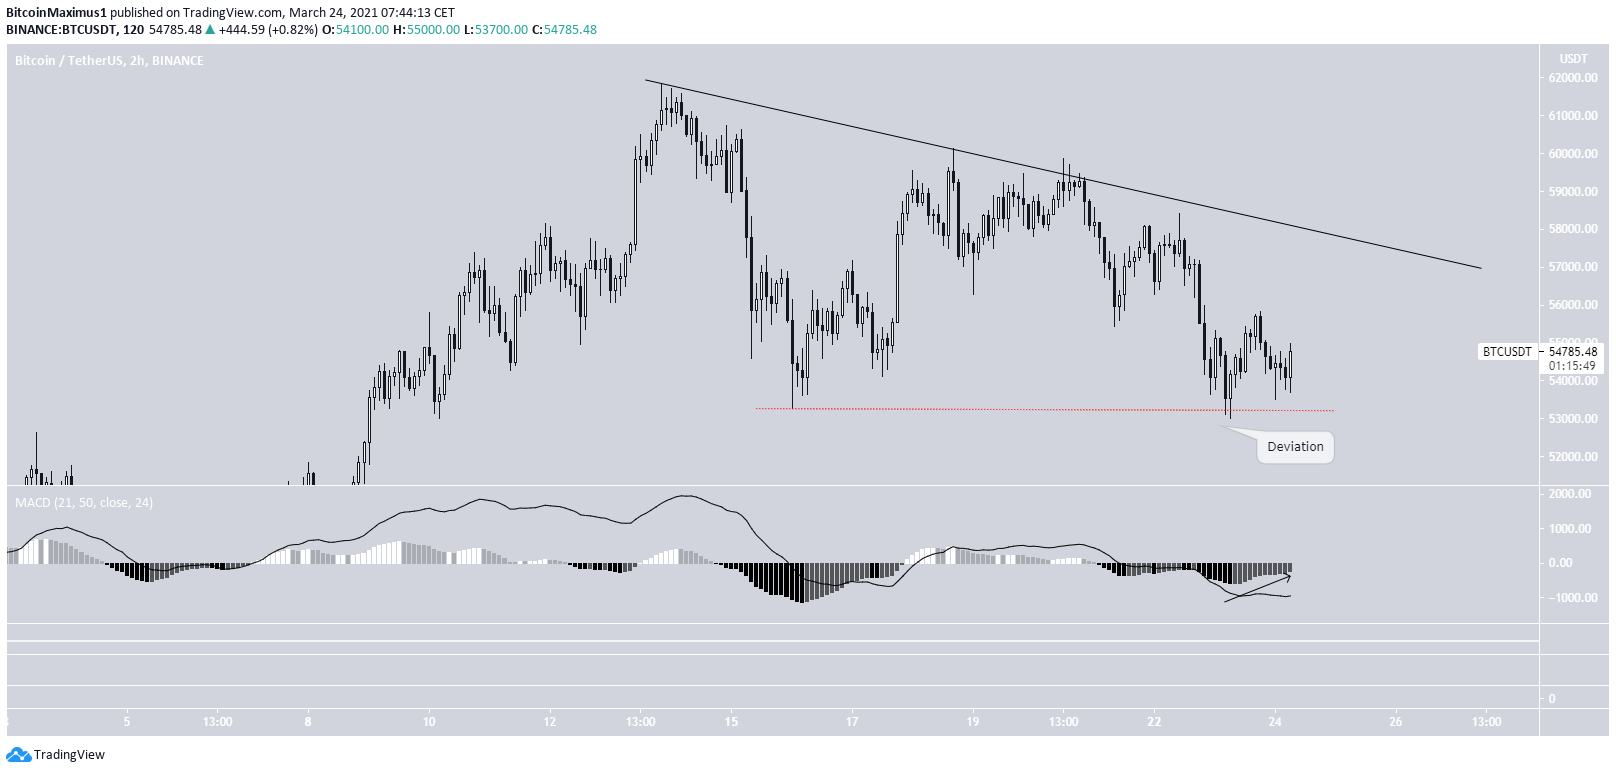
The shorter-term chart is more bullish.
Firstly, it shows that the MACD indicates that an upward movement is likely. This would be expected to take the price to the descending resistance line.
Secondly, it shows a deviation below the previous low, which often leads to an upward move.
Therefore, an upward move towards the resistance line is expected in the short-term.
For the possible wave counts, click here.
Conclusion
Bitcoin is expected to gradually increase towards the short-term descending resistance line. However, it’s possible that in the longer-term, it will drop and create a lower low at the $52,500 or $50,250 support.
For BeInCrypto’s previous Bitcoin (BTC) analysis, click here.


