


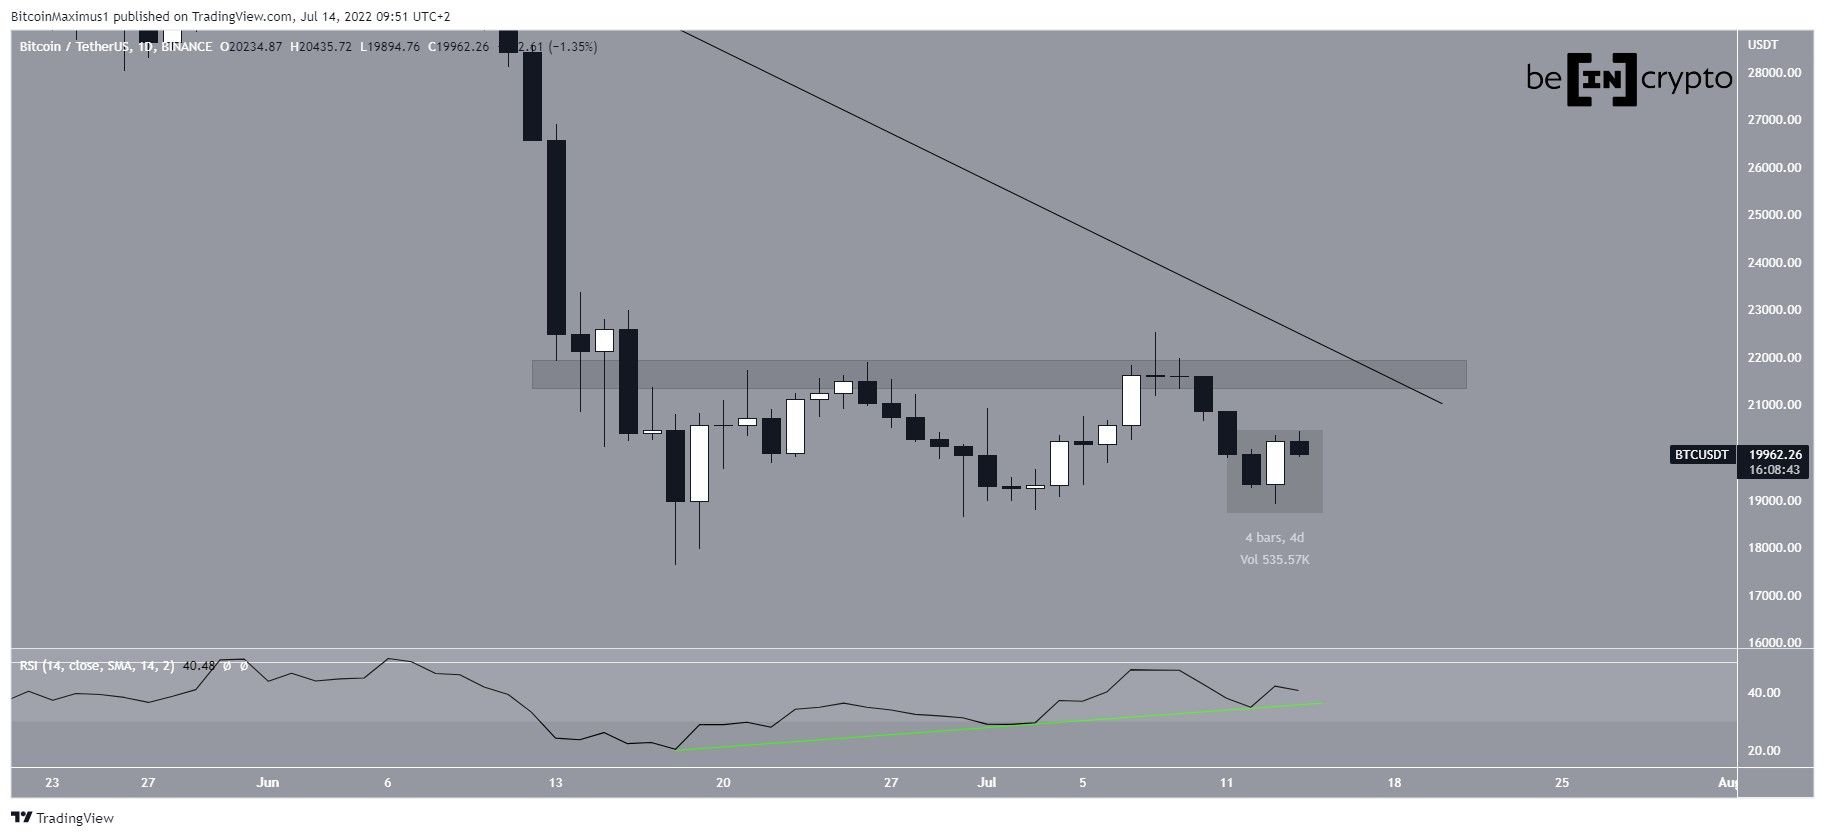
Bitcoin (BTC) is at the support line of a corrective pattern that has been in place since June 18. A potential breakdown would be expected to lead to new lows.
BTC has been moving upwards since reaching a low of $17,622 on June 18. So far, it has created two higher lows, doing so on June 30 and July 13, respectively.
On the latter date, it also created a bullish engulfing candlestick (highlighted). This is a type of bullish candlestick pattern that is expected to lead to bullish trend reversals.
Additionally, the ascending support line of the daily RSI (green line) is still intact. This increases the legitimacy of the higher lows.
The main resistance area is at $21,800, created by a horizontal resistance area and a descending resistance line.
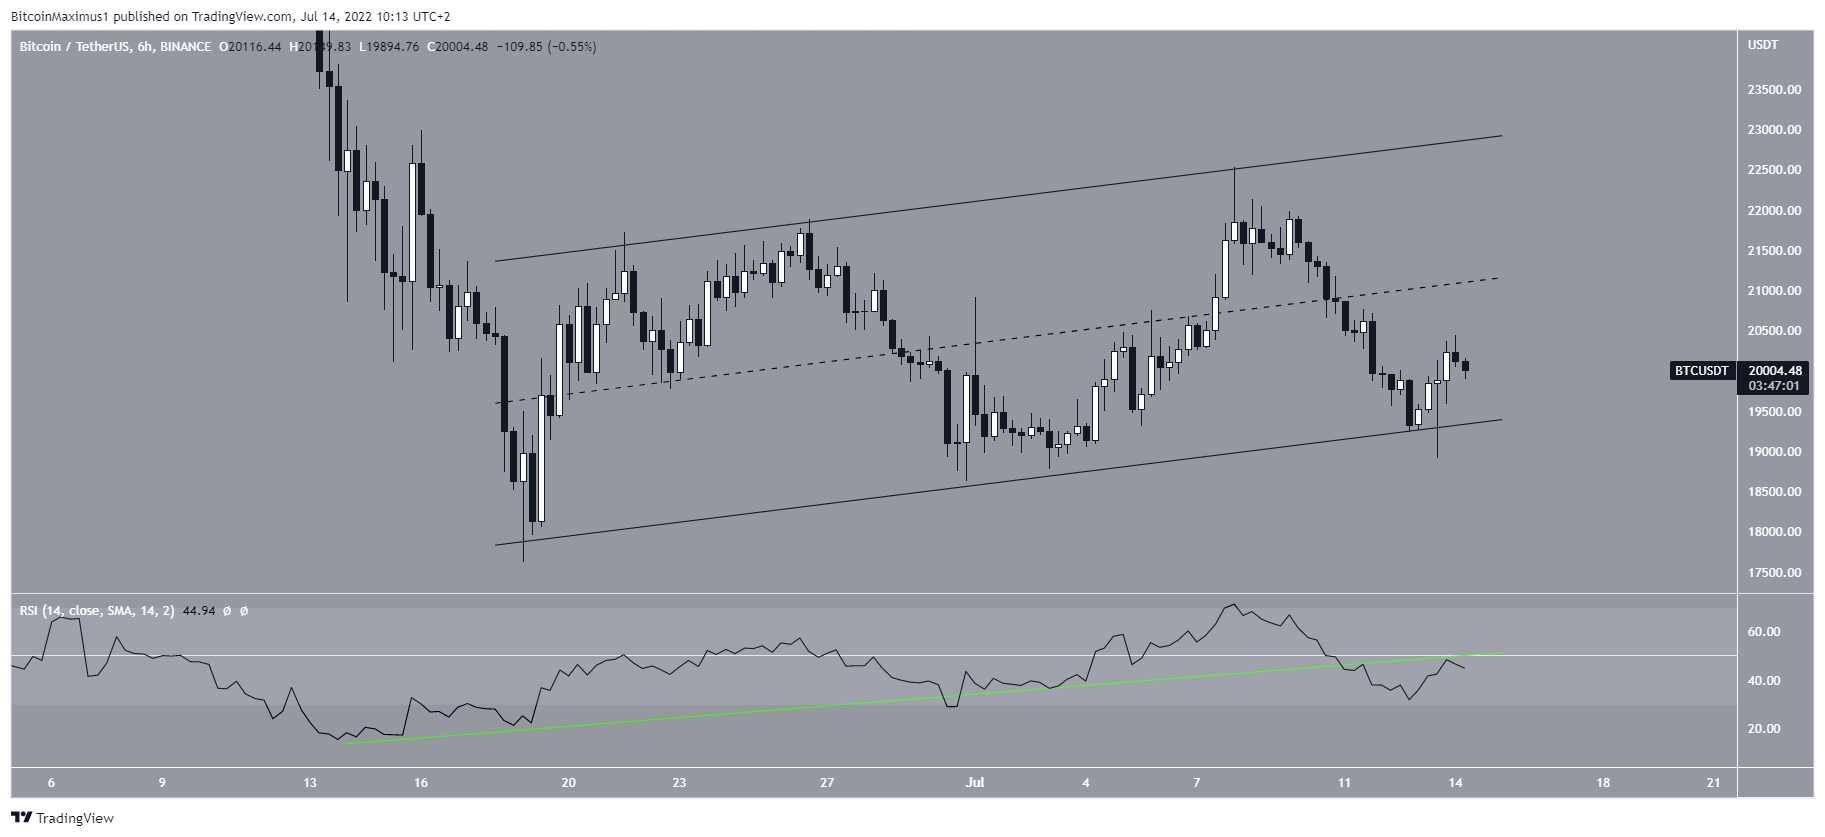
Short-term channel
The six-hour chart provides a more bearish outlook for two reasons. Firstly, the price is trading in the lower portion of an ascending parallel channel. Such channels usually contain corrective movements, meaning that an eventual breakdown would be expected.
Secondly, unlike the daily chart, the six-hour RSI has already broken down from its ascending support line. So, it is possible that the price will follow suit and break down from the channel.
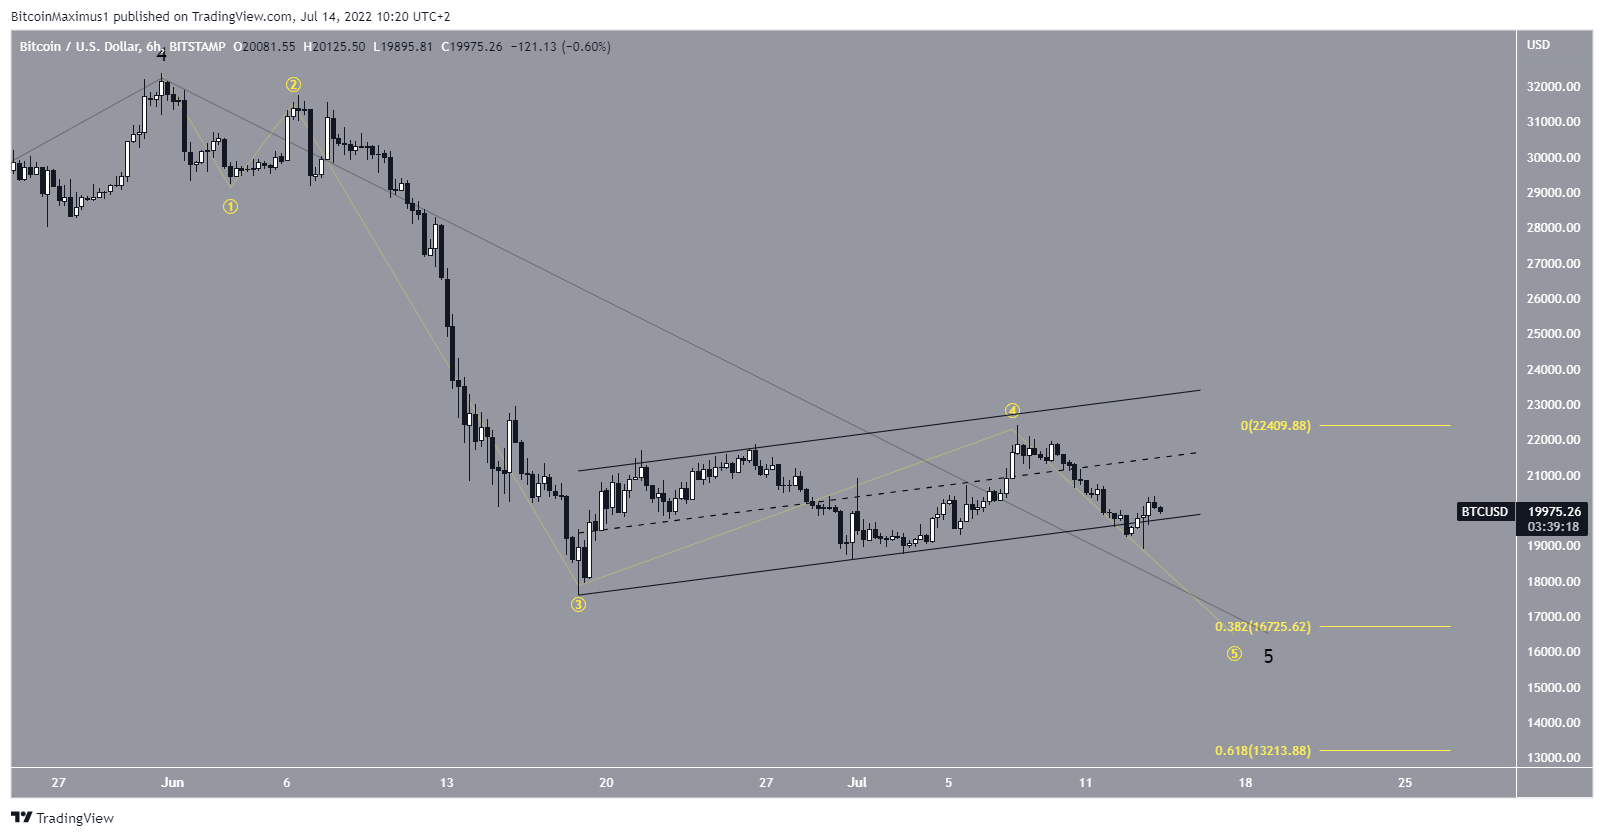
Future BTC movement
The wave count also supports the possibility that the price will break down from the channel and create a new low. The reason for this is that it seems that BTC is in wave five of a five-wave downward movement (yellow).
Using the length of waves one and three, the first potential target for the bottom of this move is at $16,726. If the area fails to initiate a reversal, the next potential bottom target would be at $13,213.
The long-term wave count also supports the possibility that another downward movement will follow.
For Be[in]Crypto’s previous bitcoin (BTC) analysis, click here.


