
Yesterday Bitcoin (BTC) reached one of the most important areas in its history, the 200-week moving average (200W MA). This has only happened 3 times in history so far and has always correlated with a macro bottom in the price of the largest cryptocurrency.
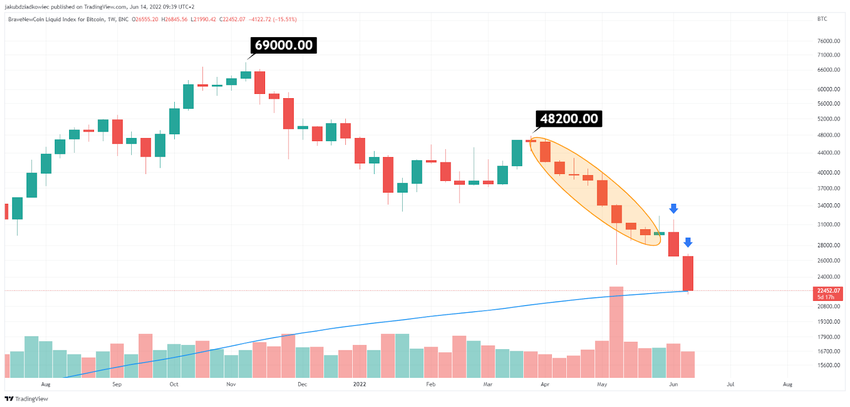
Bitcoin has been falling since reaching the all-time high (ATH) of $69,000 on November 10, 2021. The decline accelerated from a local peak at $48,200 on March 28, 2022.
After that, BTC generated 9 consecutive bearish weekly candles and one green candle (orange area). It then continued its decline further and printed another two red weekly candles with over -10% body each (blue arrows).
Yesterday’s daily candle alone had a body of -15.38% and brought the price down to the $21,925 level at the bottom of the wick. This morning, Bitcoin continued its declines, taking it to a low of $20,846.
Bitcoin reaches 200W MA
In the chart above, we notice the blue line where Bitcoin’s decline seems to be currently stopping. This is the 200-week moving average (200W MA) – a level of very high historical significance.
On the long-term chart, we see that this curve has served as support during previous bear markets. It was not perfect support as weekly wicks below this line often occurred. However, typically weekly closes were reached above the 200W MA.
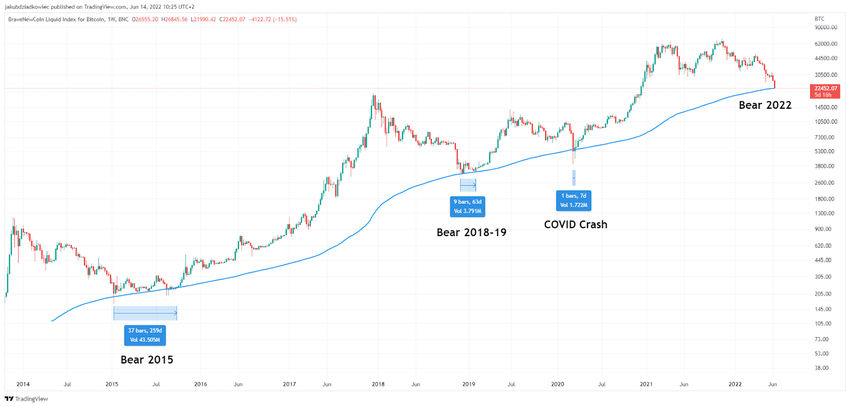
It first played a support role in the 2015 bear market. After the sudden capitulation in January 2015, Bitcoin consolidated at its (rising) level for 259 days. It was only in October 2015 that it resumed its uptrend.
For the second time in history, the 200W MA was reached at the end of the 2018 bear market. At that time, not even a wick below this line was printed, and the consolidation lasted for 63 days.
The last time the 200W MA served as support was during the COVID-19 crash of March 2020. At that time, there were two very long lower wicks that reached well below this line. Moreover, the weekly close occurred below the 200W MA. Interestingly, the decline at that time experienced a quick V-shape recovery and Bitcoin rose again after seven days. On the other hand, consolidation did not occur until later from April to July 2020. However, it was already running at a much higher level around $9000.
Thus, averaging the values from previous visits at the 200W MA (259 days, 63 days, and 7 days), we can conclude that for such a low statistical sample, Bitcoin on average consolidates 110 days after reaching this curve. If these estimates prove to be correct, a resumption of the uptrend could be expected in early October 2022.
Decreasing drawdowns against ATH
According to data from Glassnode, the low reached yesterday led BTC to fall by 67.27% from the November 2021 ATH. This is the largest deviation since the aforementioned COVID-19 crash of March 2020, when BTC was -75.5% below the previous record. At that time, Bitcoin’s price hit a low of $3941, with the benchmark being the historical ATH of $19,764 from December 17, 2017.
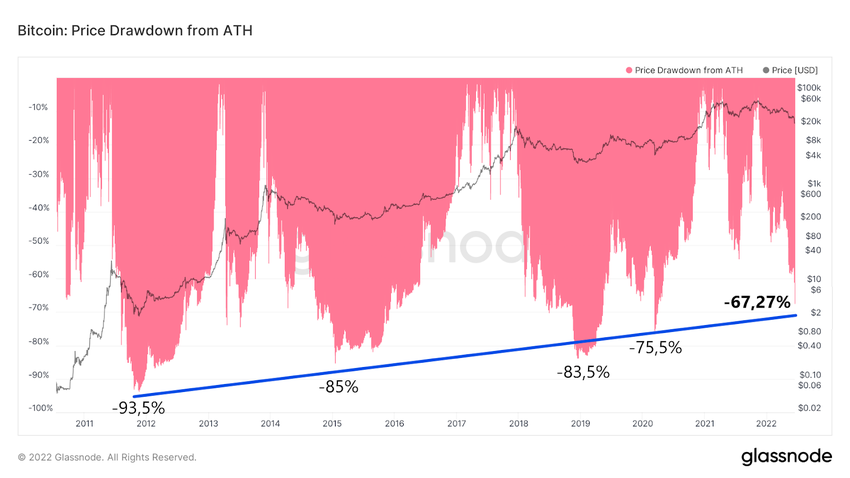
Looking more closely at the chart of price drawdowns from ATHs for the entire history of Bitcoin, we see a gradual reduction in volatility. Each successive bear market macro bottom has been at a shorter price distance from the corresponding ATH.
One can therefore try to plot an inaccurate uptrend line (blue), which suggests that the decline from the ATH in the current cycle should end around -70%. If exactly this value proves true, the macro bottom would be the $20,700 level. This would coincide with a retest of the aforementioned historical ATH from 2017.
However, if Bitcoin were to continue its decline and reach the levels of the 2015 and 2018 declines (around -85%), then the target for the macro bottom would be $10,350.
For BeInCrypto’s latest Bitcoin (BTC) analysis, click here.
