
The Bitcoin (BTC) price could correct for the rest of March after completing a long-term upward movement.
The weekly chart for Bitcoin (BTC) provides a bullish outlook. There are several reasons for this.
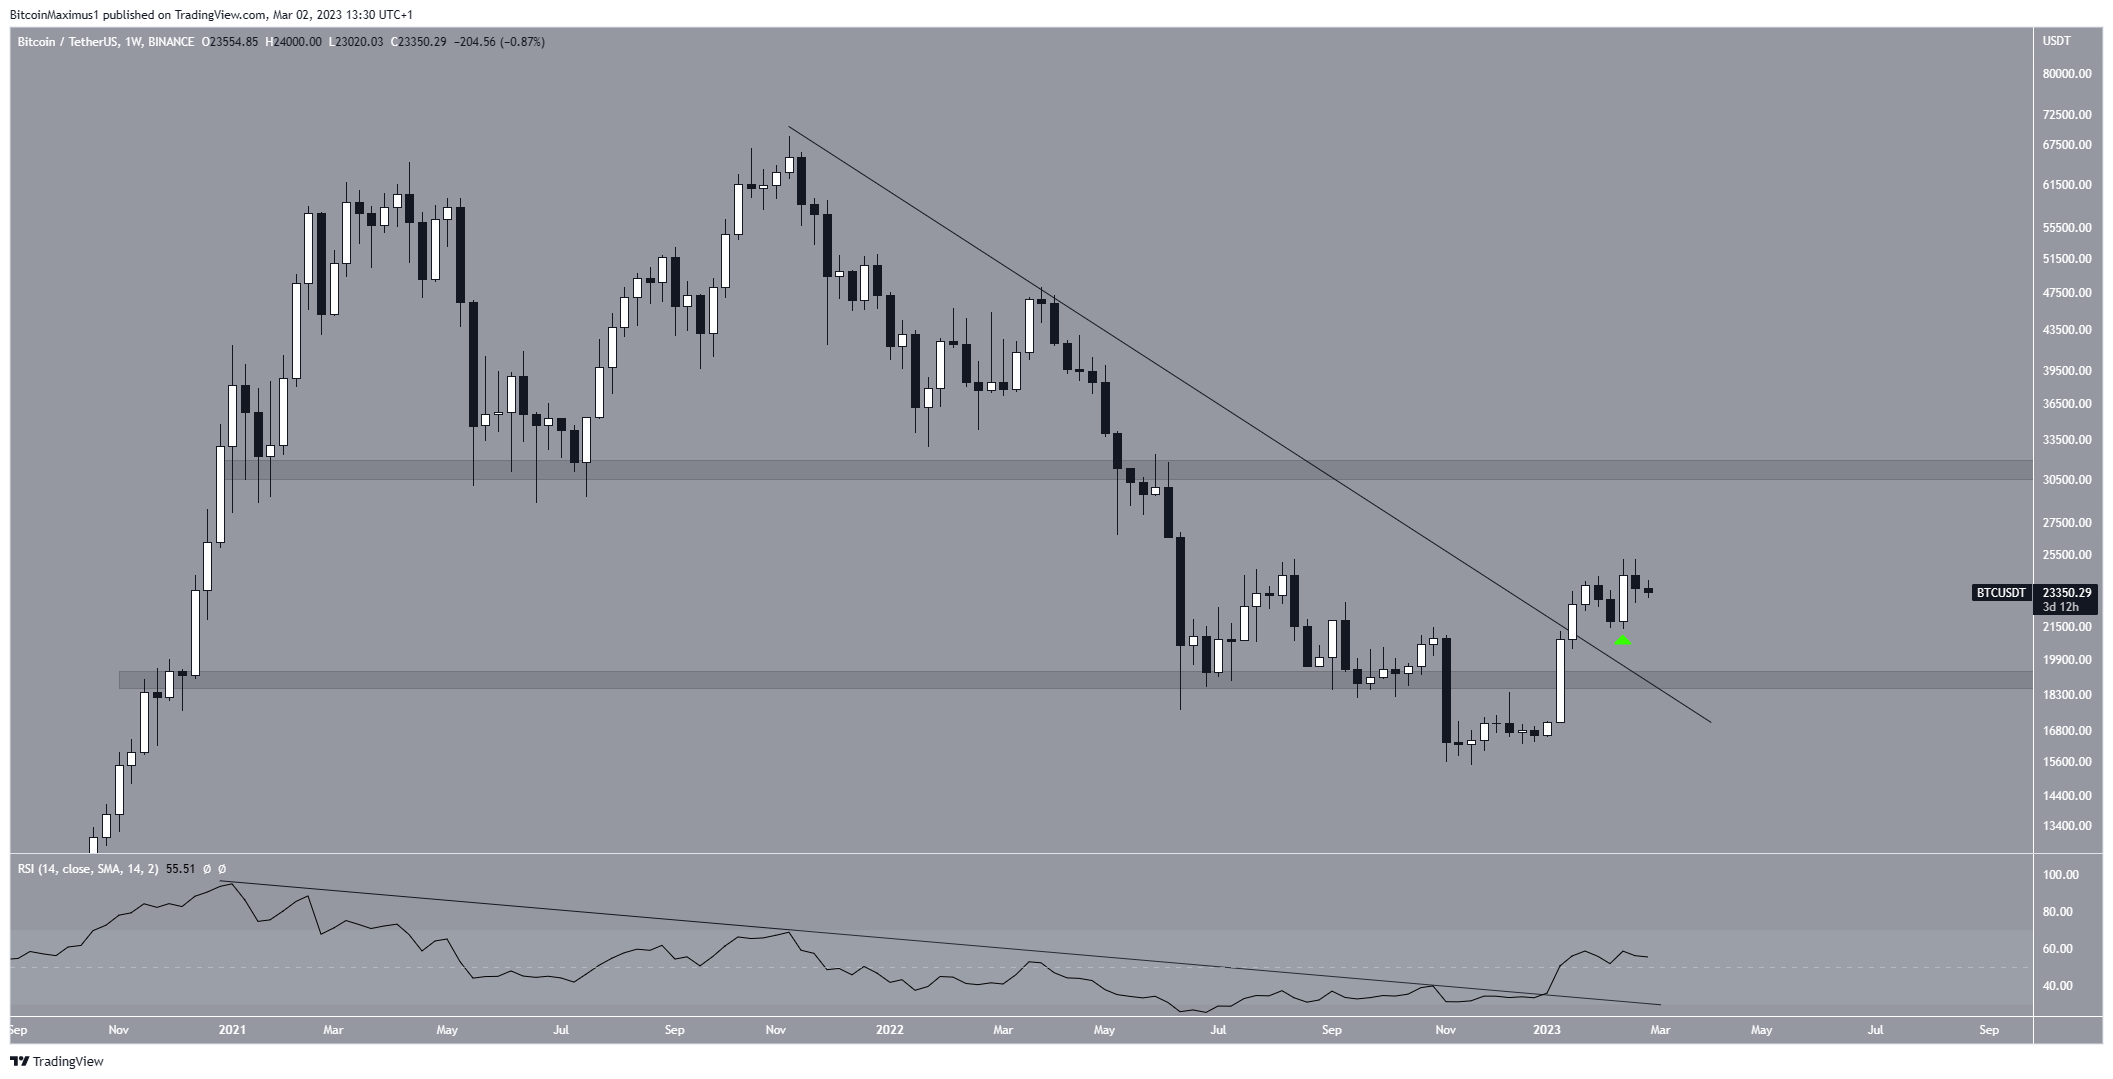
Firstly, the price broke out from a long-term descending resistance line that had been in place since the all-time high. Secondly, the BTC price reclaimed the $19,000 horizontal support area after previously deviating below it in June 2022. Thirdly, the weekly RSI broke out from its own descending resistance line and moved above 50. Finally, the Bitcoin price created a bullish engulfing candlestick two weeks ago (green icon).
Therefore, the most likely direction of the future movement is an increase to the $30,700 resistance area.
If the trend loses momentum, the BTC price could fall to the $19,000 support area. However, the trend is considered bullish as long as BTC trades above this level.
Bitcoin (BTC) Price Prediction for March Is Bearish
Despite the bullish outlook from the weekly time frame, the daily chart price action is bearish. There are numerous reasons for this, led by the deviation above the $24,000 resistance area. Afterward, the Bitcoin price fell below the area and validated it as resistance.
Next, the price seems to have completed a five-wave upward movement (black).
If so, the digital asset is now in either an A-B-C (red) or five-wave downward movement (black). Both suggest that the price will decrease between the 0.382-0.618 Fib retracement support level at $19,217-$21,582.
Due to the long time it took for the upward movement to complete, the price will likely correct for the entirety of March and possibly even part of April.
However, an increase above the yearly high of $25,250 would mean that the upward movement will continue. In that case, highs near $27,000 would be expected.
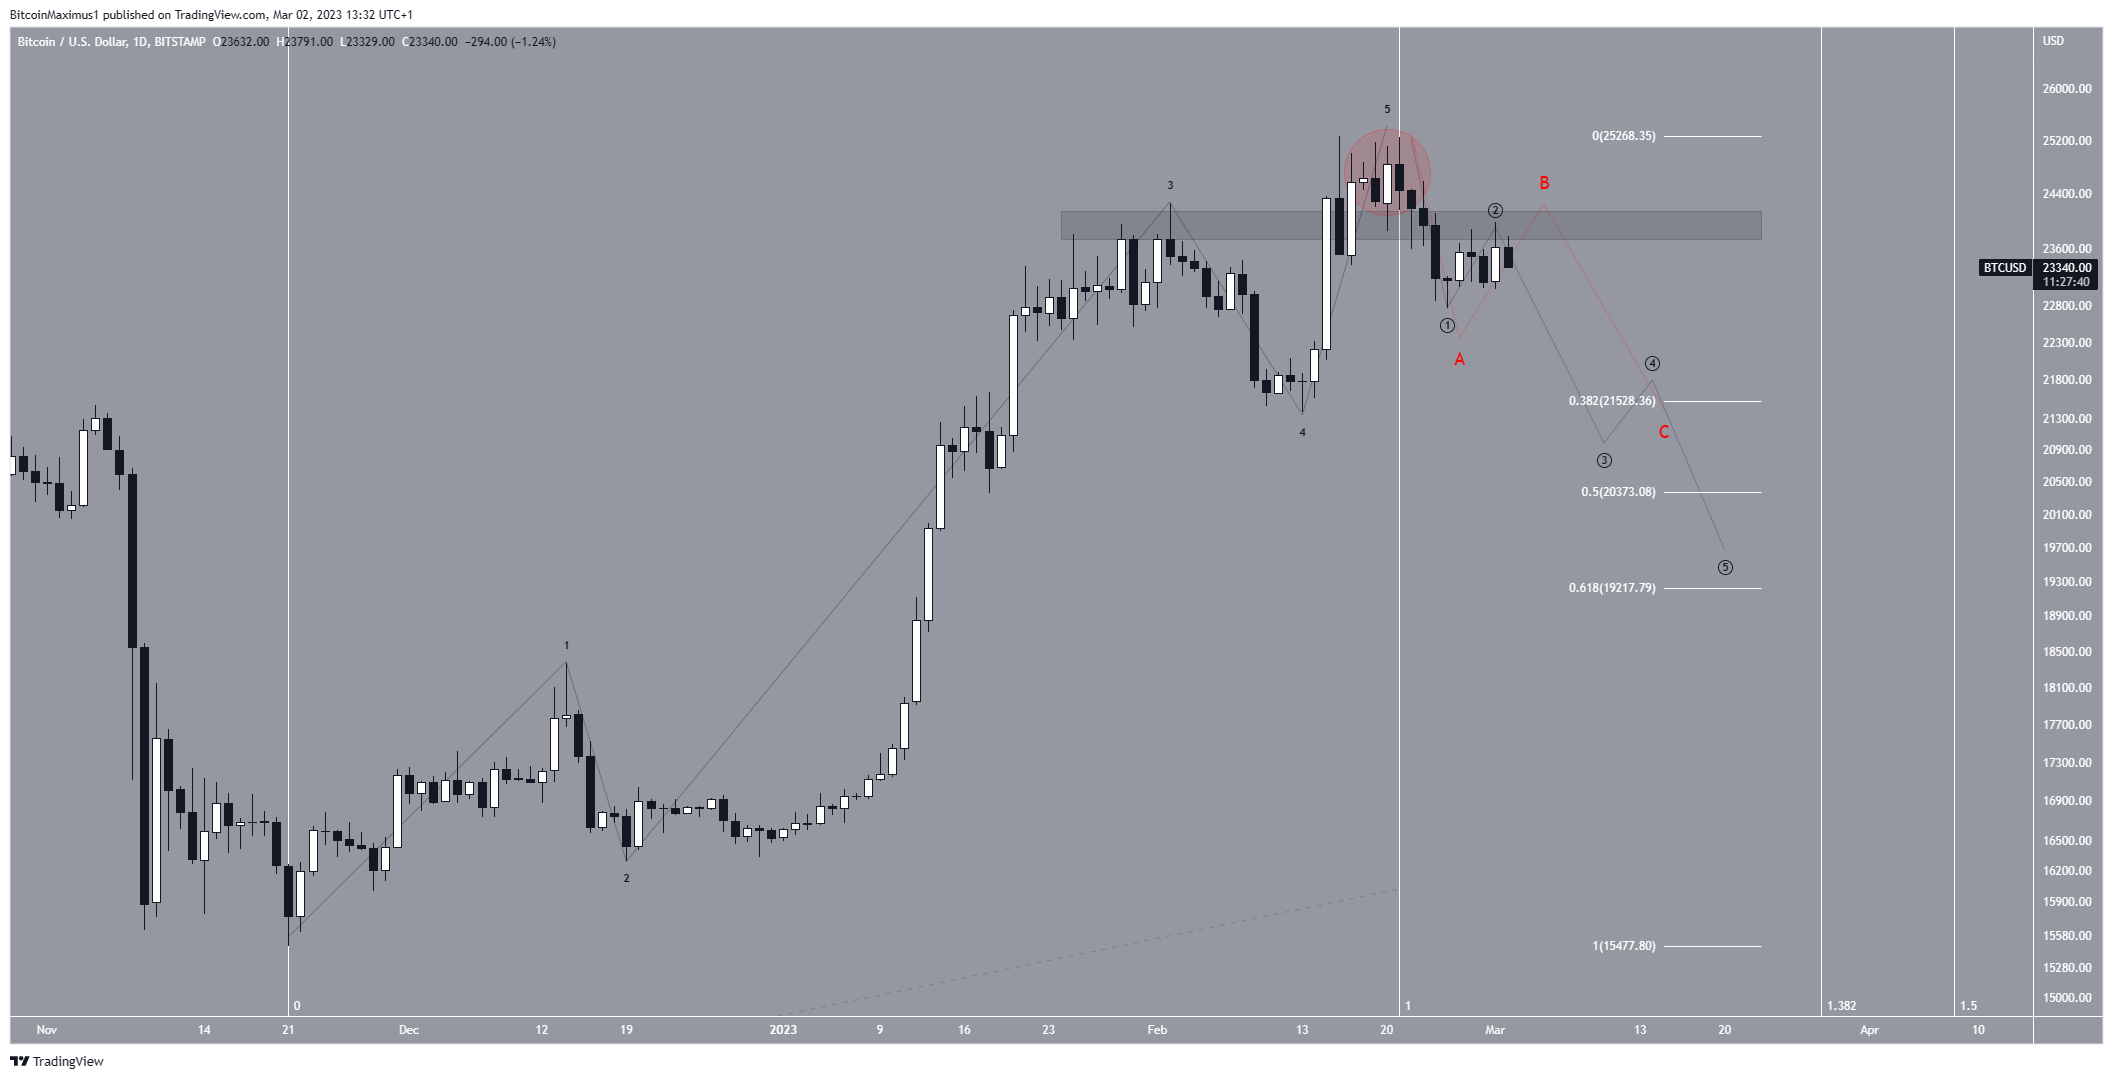
To conclude, the most likely Bitcoin price prediction for March is a decrease to the 0.382-0.618 Fib retracement support area at $19,217-$21,582. This bearish Bitcoin price forecast would be invalidated with an increase above the yearly high of $25,424.
For BeInCrypto’s latest crypto market analysis, click here.
