


The Bitcoin (BTC) price shows decisive signs of a long-term bullish reversal. However, a short-term retracement could occur before the continuation of the bull trend.
The Bitcoin price has been moving upward since Nov. 21. At the time, it had just fallen to a new yearly low of $15,476.
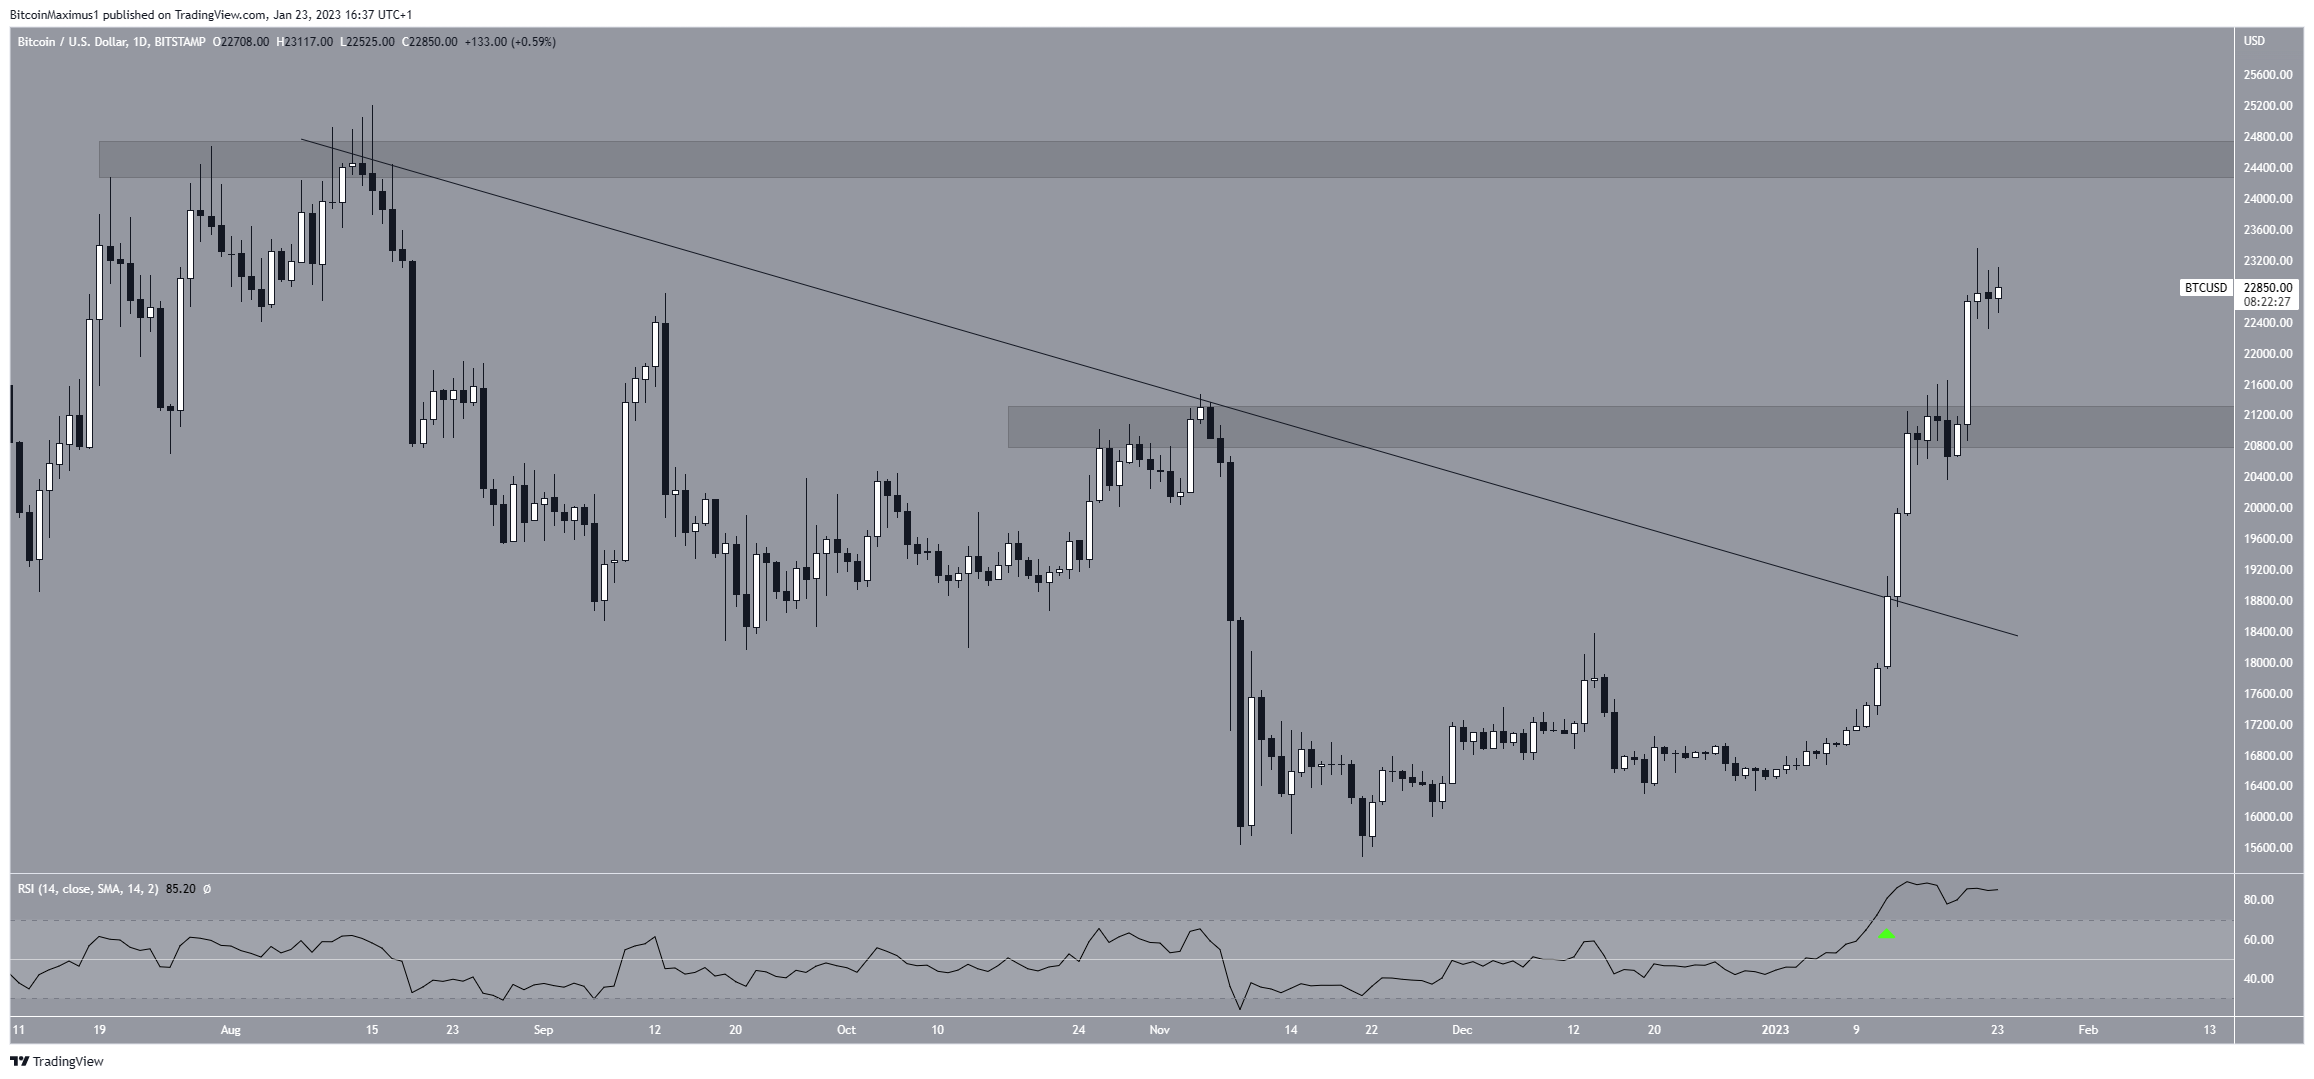
After creating a higher low, Bitcoin accelerated its rate of increase on Dec. 30. On Jan. 13, the price broke out from a long-term descending resistance line in place for nearly six months. This was a strong sign that the correction had ended. The fact that the breakout was combined with an RSI movement above 70 (green icon) further legitimizes the increase.
Afterward, the BTC price moved above the $21,000 area and validated it as support. If the increase continues, the next closest resistance area would be at $24,500. A breakout above it could take the Bitcoin price toward $30,000.
On the other hand, a rejection could lead to a drop toward the $21,000 area once more.
While the daily RSI is overbought, it has not confirmed the bearish divergence trend line yet. As a result, the trend can still be considered bullish.
Bitcoin Price Prediction for Feb: $26,000 Is Within Reach
A closer look at the price action shows that the Bitcoin price is likely in wave three of a five-wave upward movement (black). Wave three extended and reached the 2.61 length of wave one (white). This is common since wave three is the one that most often extends.
If the count is correct, the BTC will decrease toward the 0.382 Fib retracement support level at $20,740 or the 0.5 one at $19,900 before moving upward.
While a more accurate target can be determined once wave four is done, the 3.61-4.21 extension region at $26,075 – $27,840 is suitable for a top.
On the other hand, a decrease below the wave one high (red line) at $18,410 would invalidate the bullish outlook and send Bitcoin crashing toward $16,000. For a long-term wave count, click here.
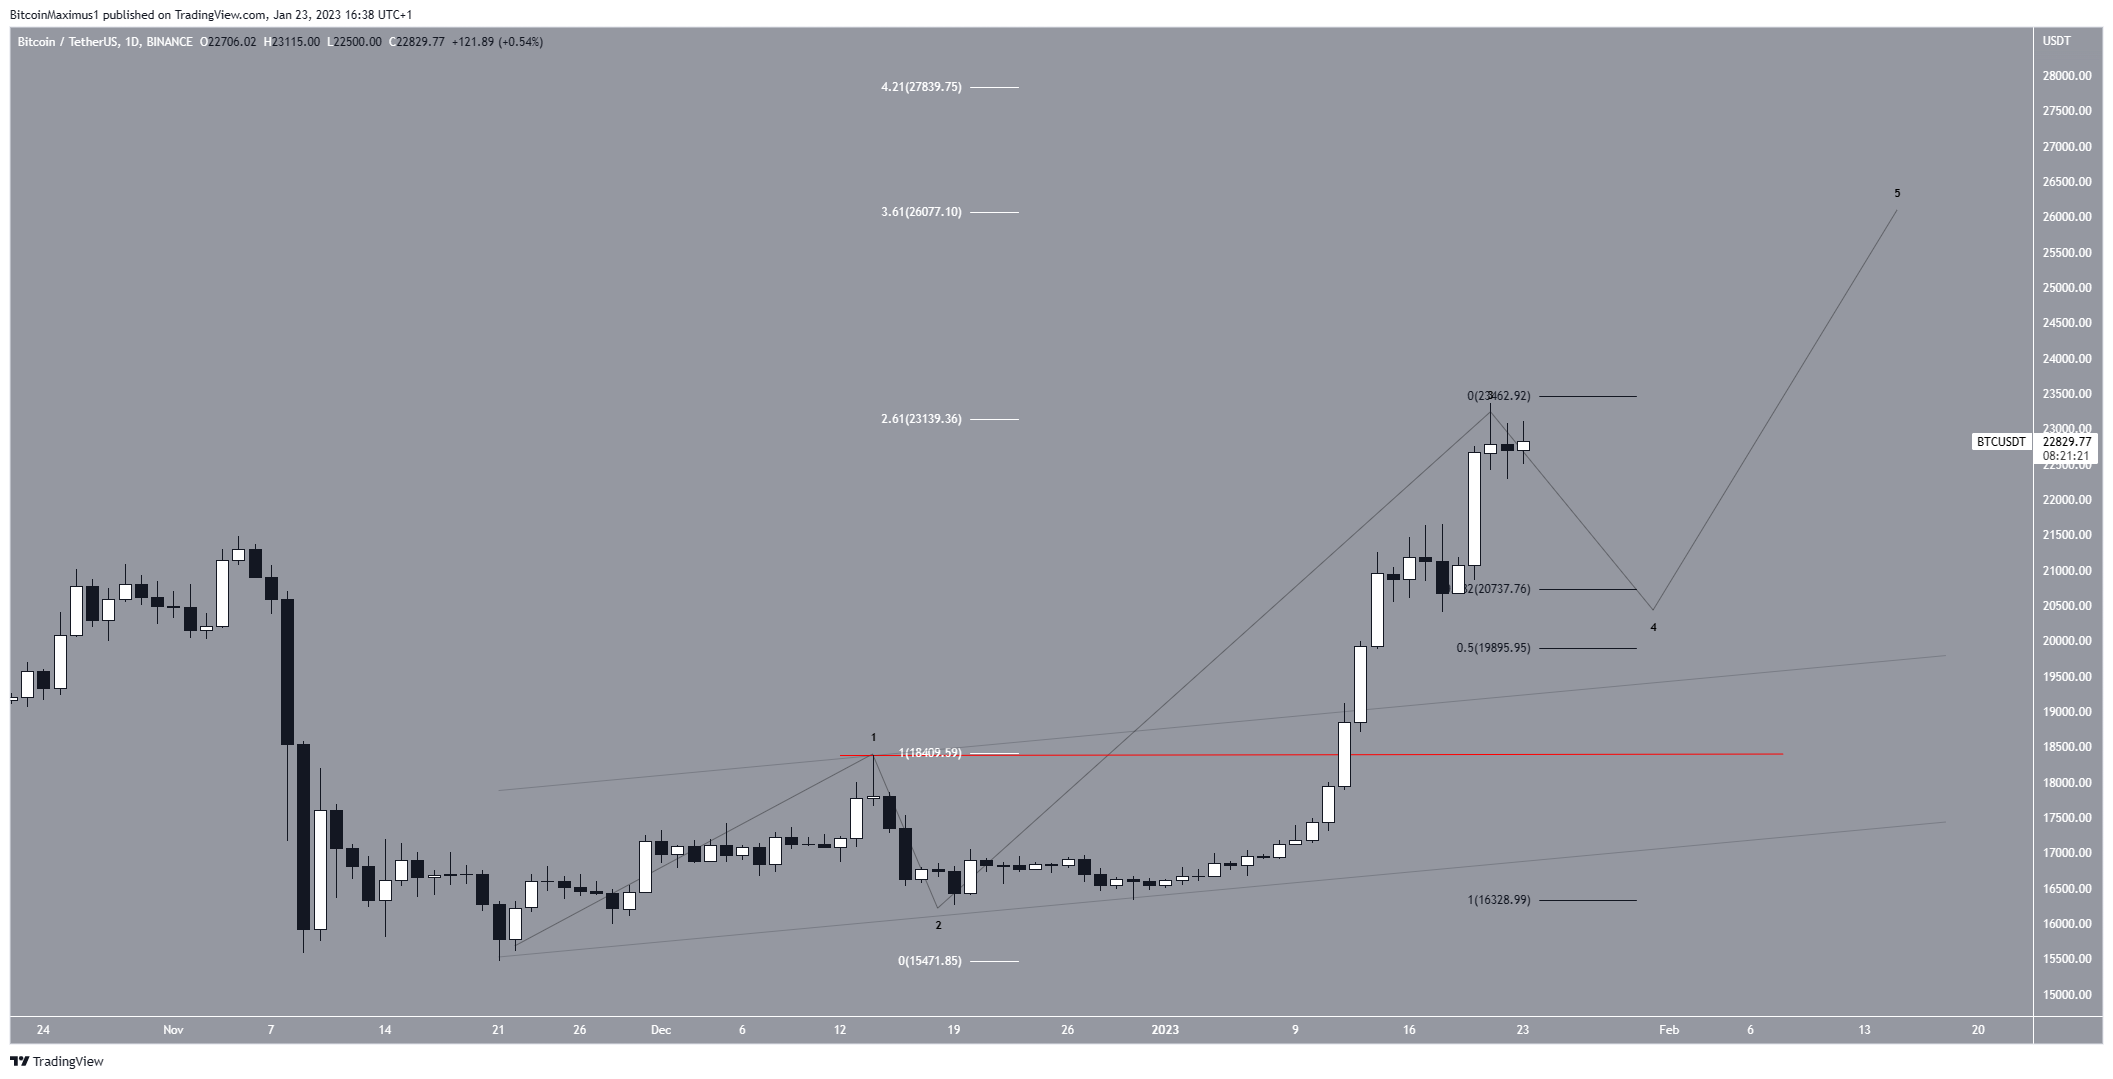
To conclude, the most likely Bitcoin price prediction for Feb. is a drop toward $20,740 before the price increases to $26,000. While a decrease to $19,900 would not invalidate this bullish BTC price analysis, a drop below $18,400 would mean that the trend is bearish. In this case, Bitcoin would be expected to re-test $16,000.
For BeInCrypto’s latest crypto market analysis, click here.


