
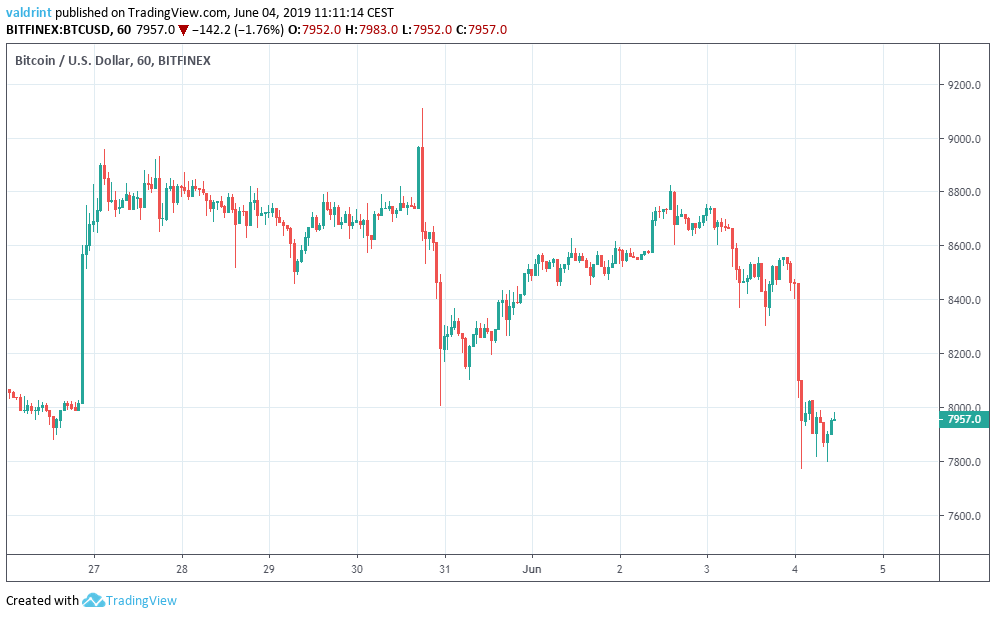
On May 27, the Bitcoin price (BTC) reached a high of $8958.3. Similar highs were reached on May 30. However, the price has been decreasing since.
Where will it go next? Keep reading below to find out:
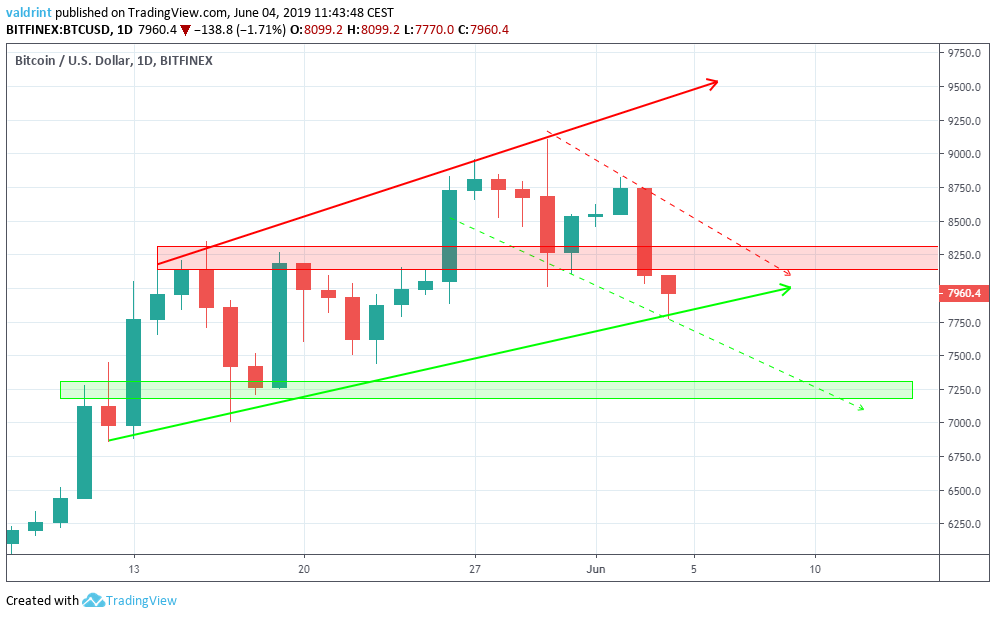
Bitcoin Price (BTC): Trends and Highlights for June 4, 2019
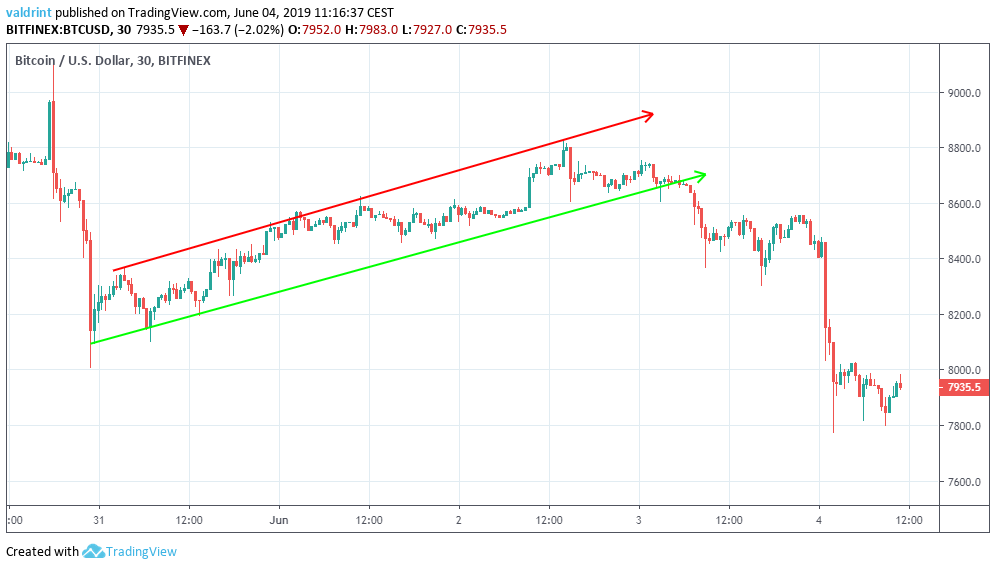
- The price broke down from an ascending channel on Jun 3.
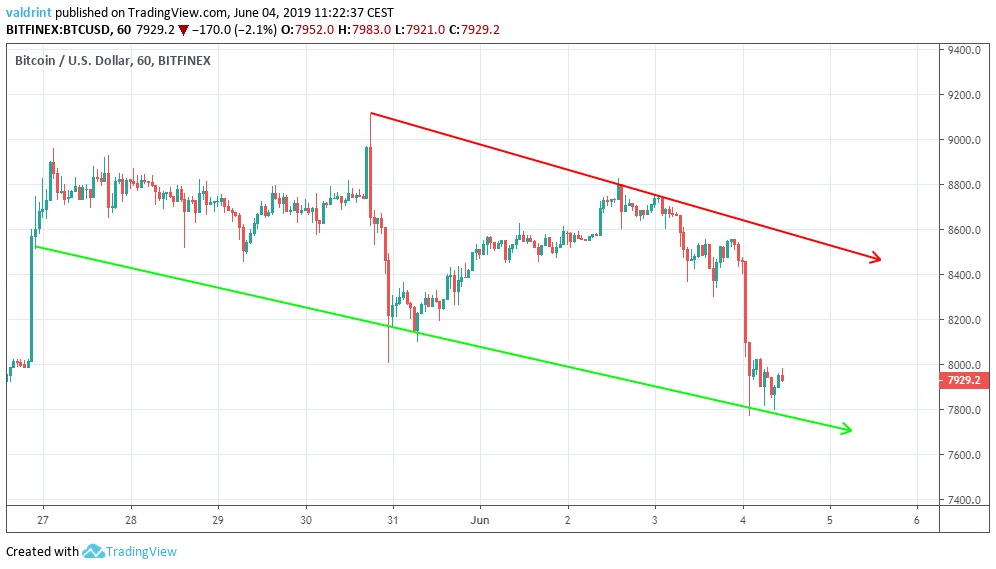
- It is trading inside a descending channel.
- A slight bullish divergence is developing in the RSI.
- There is support near $7250.
- There is resistance near $8250.
Previous Movement
On May 30, the Bitcoin price (BTC) reached a low of $8005.0. It reached a high of $8367.0 the next day.
Since then, it has been trading inside the ascending channel outlined below:
After reaching a high of $9109.0 on May 30, the Bitcoin price (BTC) began a rapid decrease. It reached a low of $8005.0 the same day.
Since then, it has been gradually decreasing, creating several lower highs and lows. Tracing them gives us the descending channel outlined below:
Possible Upward Move
The Bitcoin price (BTC) is analyzed alongside the RSI below:
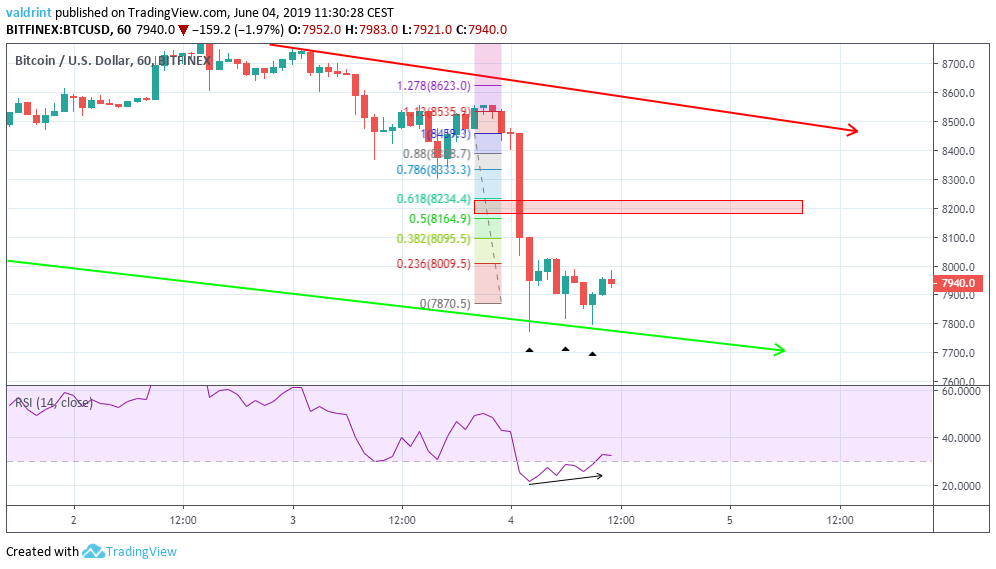
On Jun 4, the Bitcoin price (BTC) touched the descending support line near $7800. It continued to decrease and touched the line twice more during the same day. However, the RSI generated higher values throughout this period.
Furthermore, the hourly candles which touched the support line had long lower wicks, creating several bullish hammer candlesticks. This indicates that there are buyers around this level.
Therefore, it is likely that the Bitcoin price will begin a short-term increase. A target for this move would be the area between the 0.5-0.618 fib ratio since the beginning of the rapid decrease at $8459.
This area is found between $8164 and $8234.
Future Movement
In yesterday’s analysis, we stated that:
The closest support area is found near $8200. This area initially provided resistance at the beginning of May, before turning into support after the drop on May 30. It currently coincides with the support line of the long-term channel. A breakout below this area could trigger rapid price losses.
Recent market movement caused the price to reach and rapidly break through the support area. We have slightly adjusted the support line of the channel.
This area now acts as resistance. It also coincides with the 0.5-0.618 fib area we found in the previous section.
The closest support area is now found near $7250. If the Bitcoin price (BTC) continues to decrease at the rate predicted by the descending channel (dashed line), it would reach this area on Jun 10-12. This movement would invalidate the ascending channel it has been trading in since May 12.
Do you think the price of Bitcoin will initiate a short-term increase? Let us know in the comments below:
Disclaimer: This article is not trading advice and should not be construed as such. Always consult a trained financial professional before investing in cryptocurrencies, as the market is particularly volatile.
