


The Bitcoin price has been steadily increasing throughout May. On May 26, it began a rapid upward movement — reaching a high of nearly $9000. A higher high of $9109 was reached on May 30 before a downward move brought the price close to $8000.
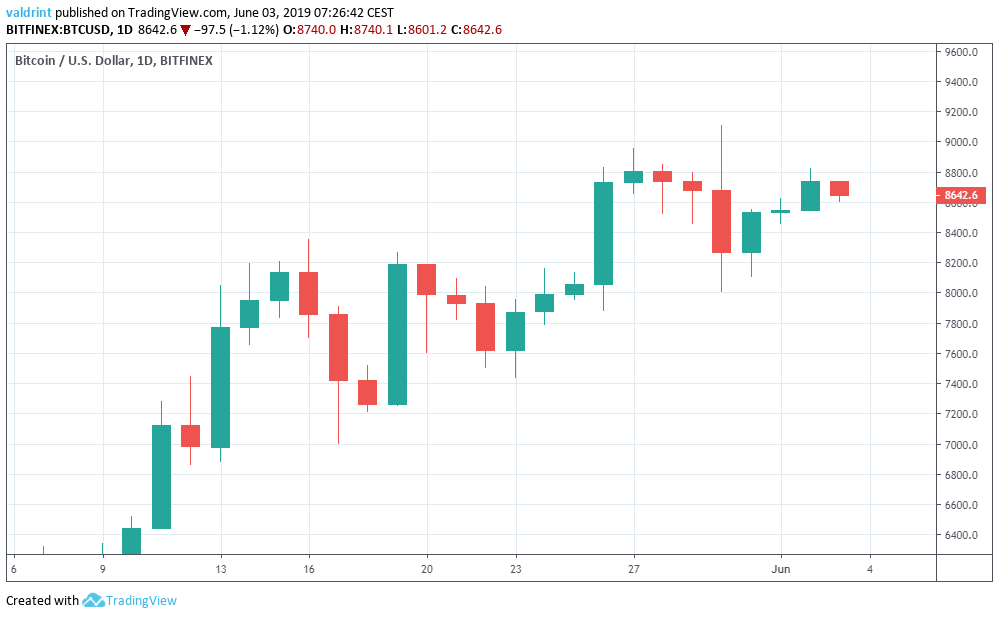
The Bitcoin price has been increasing since. At the time of writing, BTC is trading at $8642.
Where will it go next? Keep reading in order to find out!
Bitcoin Price: Trends And Highlights For June 3, 2019
- The price reached a high of $9109.2 on May 31.
- It is trading in an ascending channel both in the long and short-term.
- The price is trading above the 10- and 20-day moving averages.
- Bearish divergence is developing in the Relative Strength Index (RSI) and the Moving Average Convergence/Divergence (MACD).
- There is resistance near $9000 and support near $8200.
Tracing the Current Trading Pattern
On May 12, the price reached a low of $7085.2. A gradual increase began. The price reached a high of $8194.1 on May 14.
Since then, the price has been trading inside the ascending channel outlined below:
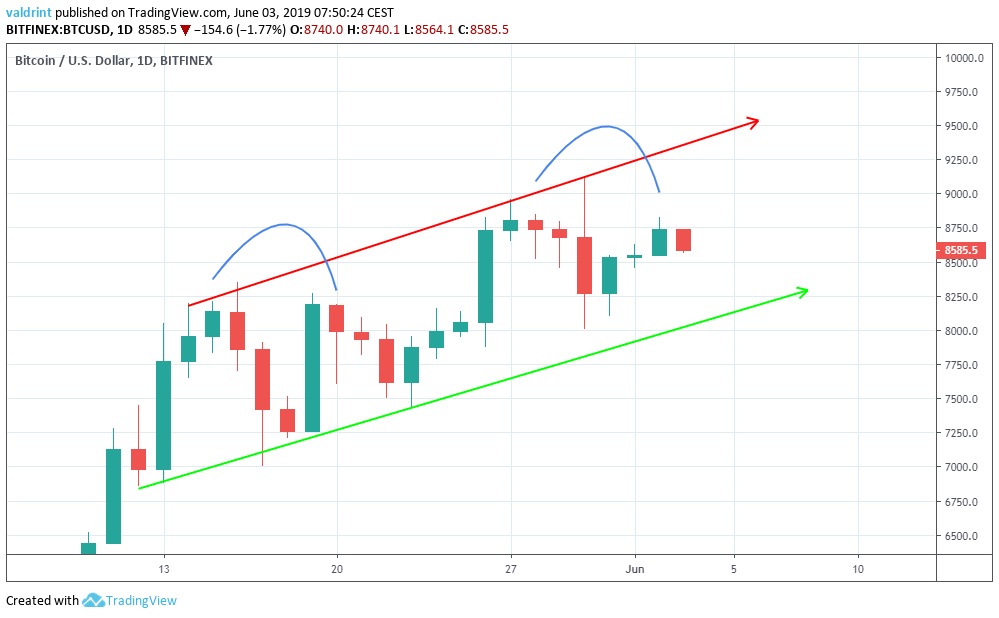
This is true both for the period of May 13-20 and May 27-Jun 3.
In order for this pattern to be completed, the Bitcoin price would have to begin a downward move during the next few days and reach the support line of the channel.
Will it do so? In order to predict that, a look at technical indicators is required.
Moving Averages
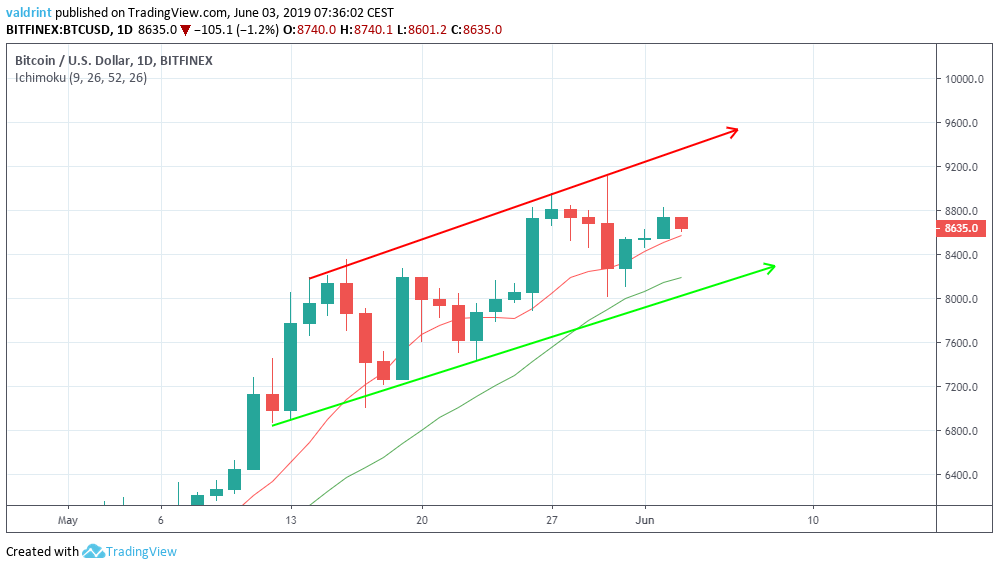
On May 30, the price briefly dropped below the 10-day moving average. However, it found support above the 20-day one and did not touch the support line. A rebound ensued and the price is currently trading above the 10-day MA.
BTC dropped below the 10-day MA on May 15 and 22. However, unlike May 30, the price reached the support line on both occasions.
Will it do the same for the third time?
To determine whether it will, the price of Bitcoin is analyzed at daily intervals alongside the RSI and the MACD below:
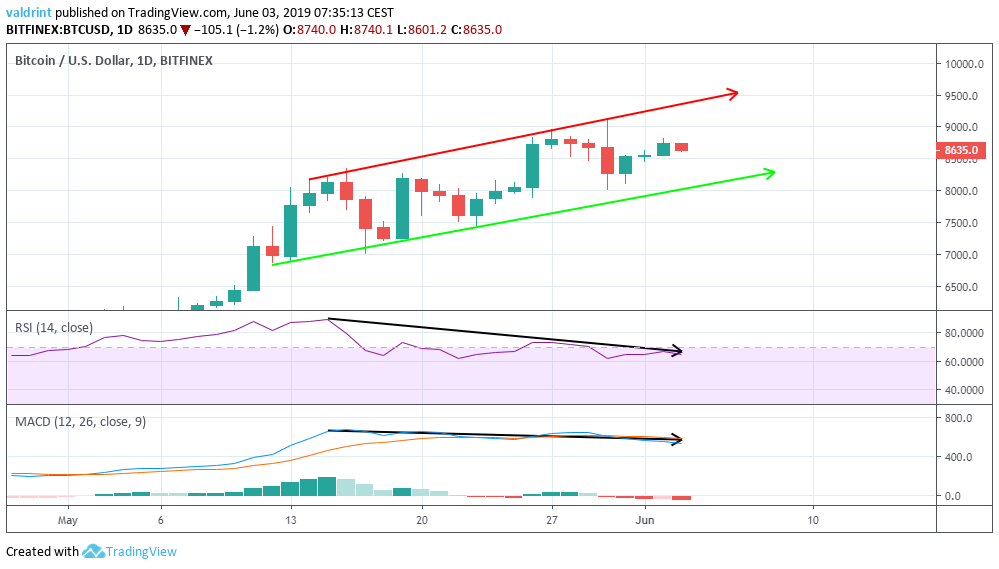
Since reaching the high on May 14, the RSI and the MACD have been generating lower values. This is in stark contrast to the significantly higher highs we have observed with the price.
This is known as bearish divergence and often precedes price decreases. This divergence is also present in the three-day time-frame, but not in the weekly one.
Furthermore, the MACD has made a bearish cross and is moving downward.
Together, these indicators suggest that the Bitcoin price will likely reach the support line of the channel. However, as we have seen in similar movements in early May, this movement might take several days to materialize.
Future Movement
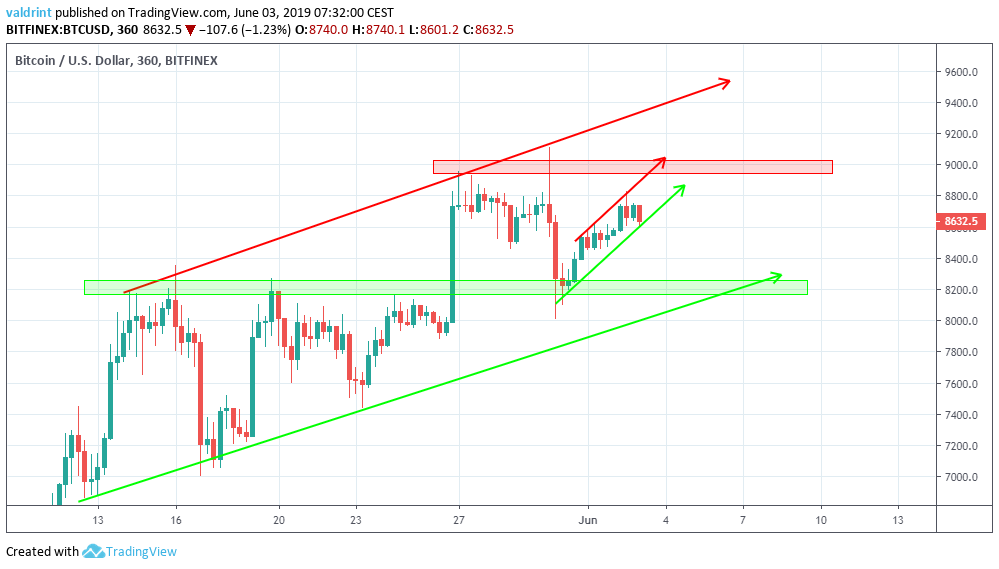
Firstly, we can see that the price has been following a short-term ascending channel since May 31.
The closest resistance area is found near $9000. If the price continues to increase within the confines of the channel, it is likely to reach this area in the next few days. While this is possible, we believe a breakout above this area to be unlikely.
The closest support area is found near $8200. This area initially provided resistance at the beginning of May, before turning into support after the drop on May 30. It currently coincides with the support line of the long-term channel. A breakout below this area could trigger rapid price losses.
Do you think the Bitcoin price (BTC) will break down? Let us know your thoughts in the comments below!
Disclaimer: This article is not trading advice and should not be construed as such. Always consult a trained financial professional before investing in cryptocurrencies, as the market is particularly volatile.


