


Bitcoin is making another attempt at breaking out above a descending resistance line. If successful, it could increase to the support/resistance zone near $22,000.
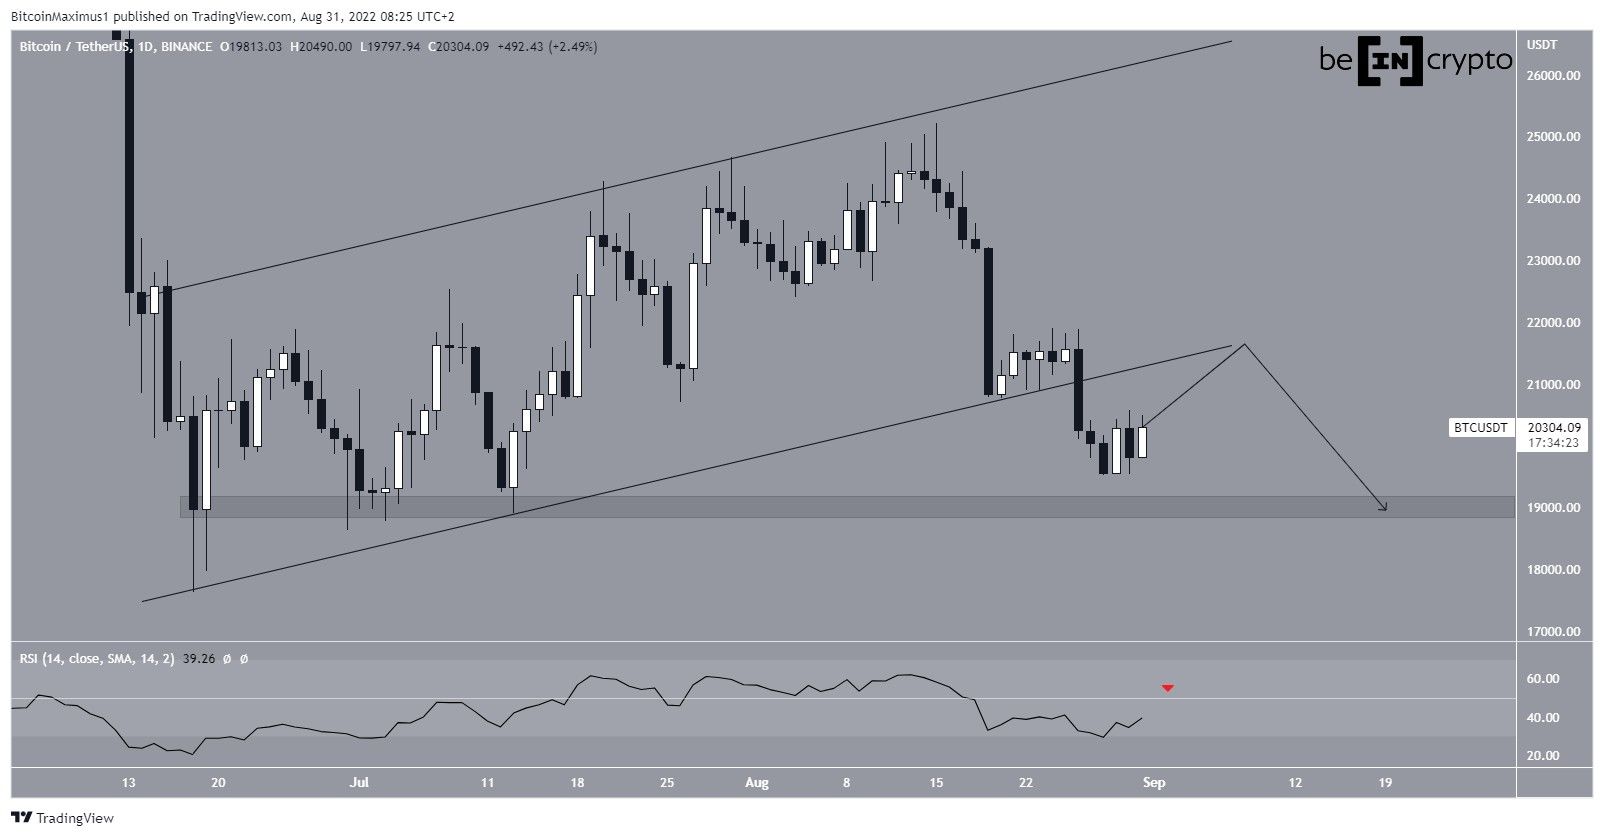
Bitcoin had been increasing inside an ascending parallel channel since reaching a low on June 18. The channel led to a local high of $25,211 on Aug. 15, but the price has been moving downwards since.
After initially rebounding at the support line of the channel, Bitcoin officially broke down on Aug. 26 and proceeded to reach a low of $19,520 two days later.
Since then, the price has bounced back some. This could take it to the support line of the channel that it broke down from.
However, the daily RSI is bearish and has decreased below 50. The potential upward move in price could serve to take the RSI back to the 50-line (red icon).
The closest support area is found at $19,000.
Current resistance
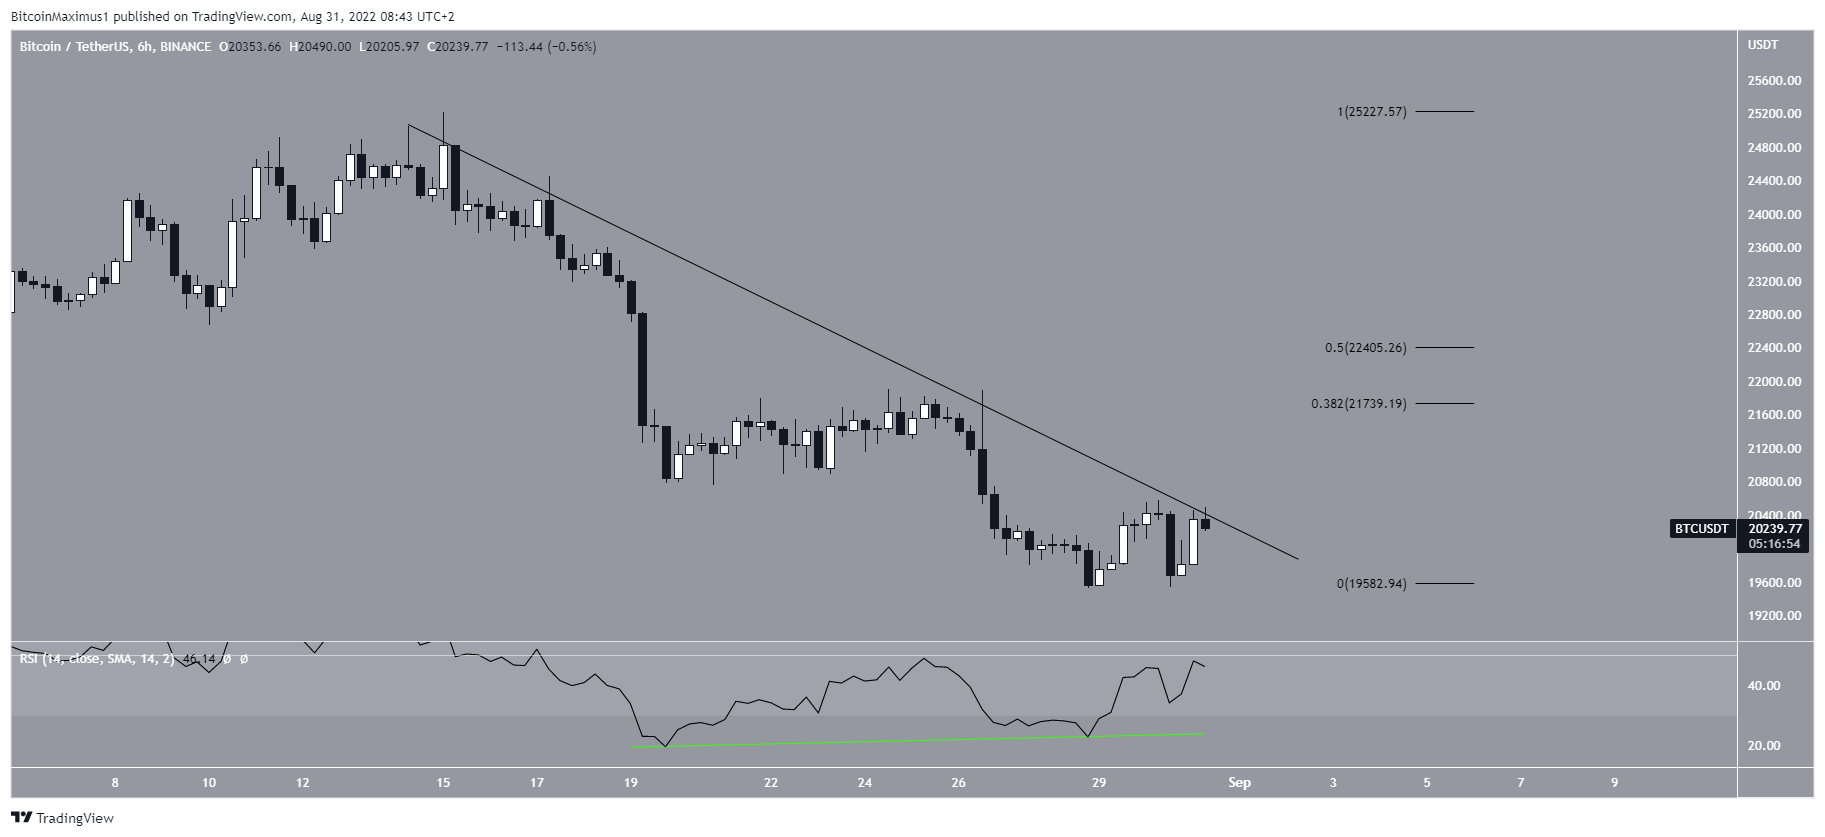
The six-hour chart shows that BTC has been trading under a descending resistance line since Aug. 15. So far, it has made five attempts at breaking out — most recently on Aug. 31. Since resistances get weaker each time they are tested, an eventual breakout from this line is expected.
Moreover, the six-hour RSI has generated a very significant bullish divergence (green line), that also supports the possibility of a breakout.
If this occurs, the closest resistance area would be found between $21,740 and $22,370. These targets are the 0.382-0.5 Fib retracement resistance levels.
BTC wave count analysis
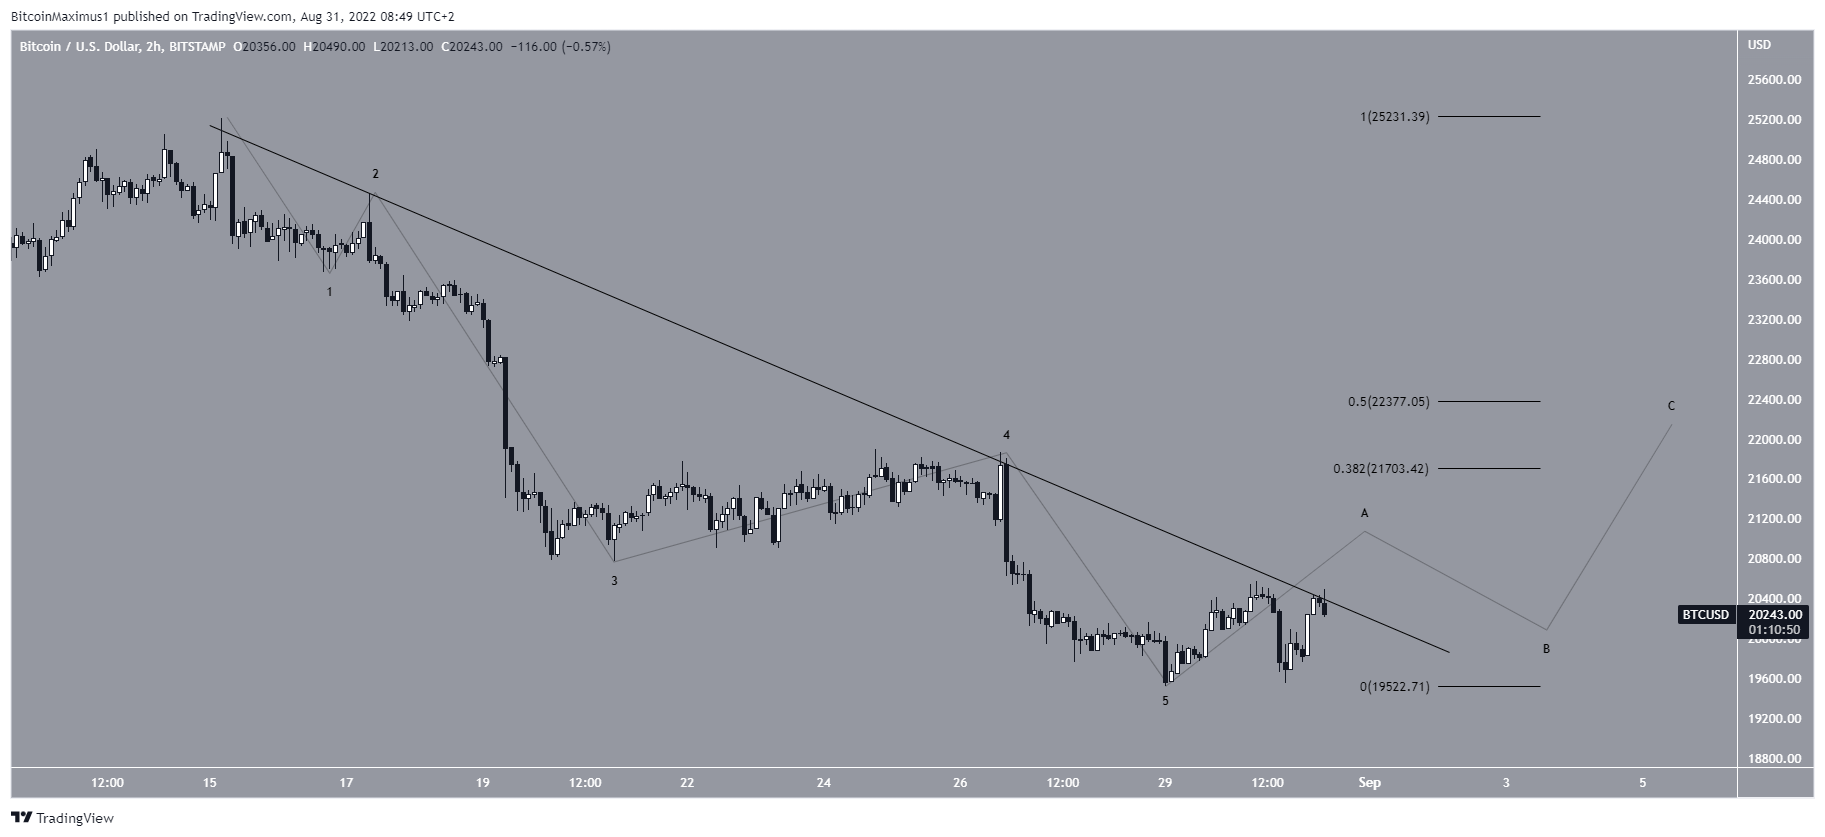
The longer-term wave count suggests another downward movement is still likely. However, the short-term count suggests that an initial bounce is likely prior to the downward movement. This is in alignment with the six-hour chart.
It seems that Bitcoin has completed a five-wave downward movement and has now begun an A-B-C corrective structure, which is expected to cause a breakout from the resistance line and take the price towards the 0.382-0.5 Fib retracement targets outlined in the previous section.
For Be[in]Crypto’s latest Bitcoin (BTC) analysis, click here


