
Be[in]Crypto takes a look at Bitcoin (BTC) on-chain indicators that relate to the lifespan of current holders. More specifically, the HODL Wave is analyzed in order to determine if there are any similarities with the previous market cycles.
The HODL wave shows the percentage of the total BTC in circulation that has moved in a specified period of time. Afterward, the realized cap HODL wave introduces a slight adjustment, in which the realized price is used instead of the market price. This is done in order to provide more accurate data.
For example, if the HODL waveband of one to two years has a width of 15%, it means that 15% of the total BTC in circulation has previously moved between one and two years ago.
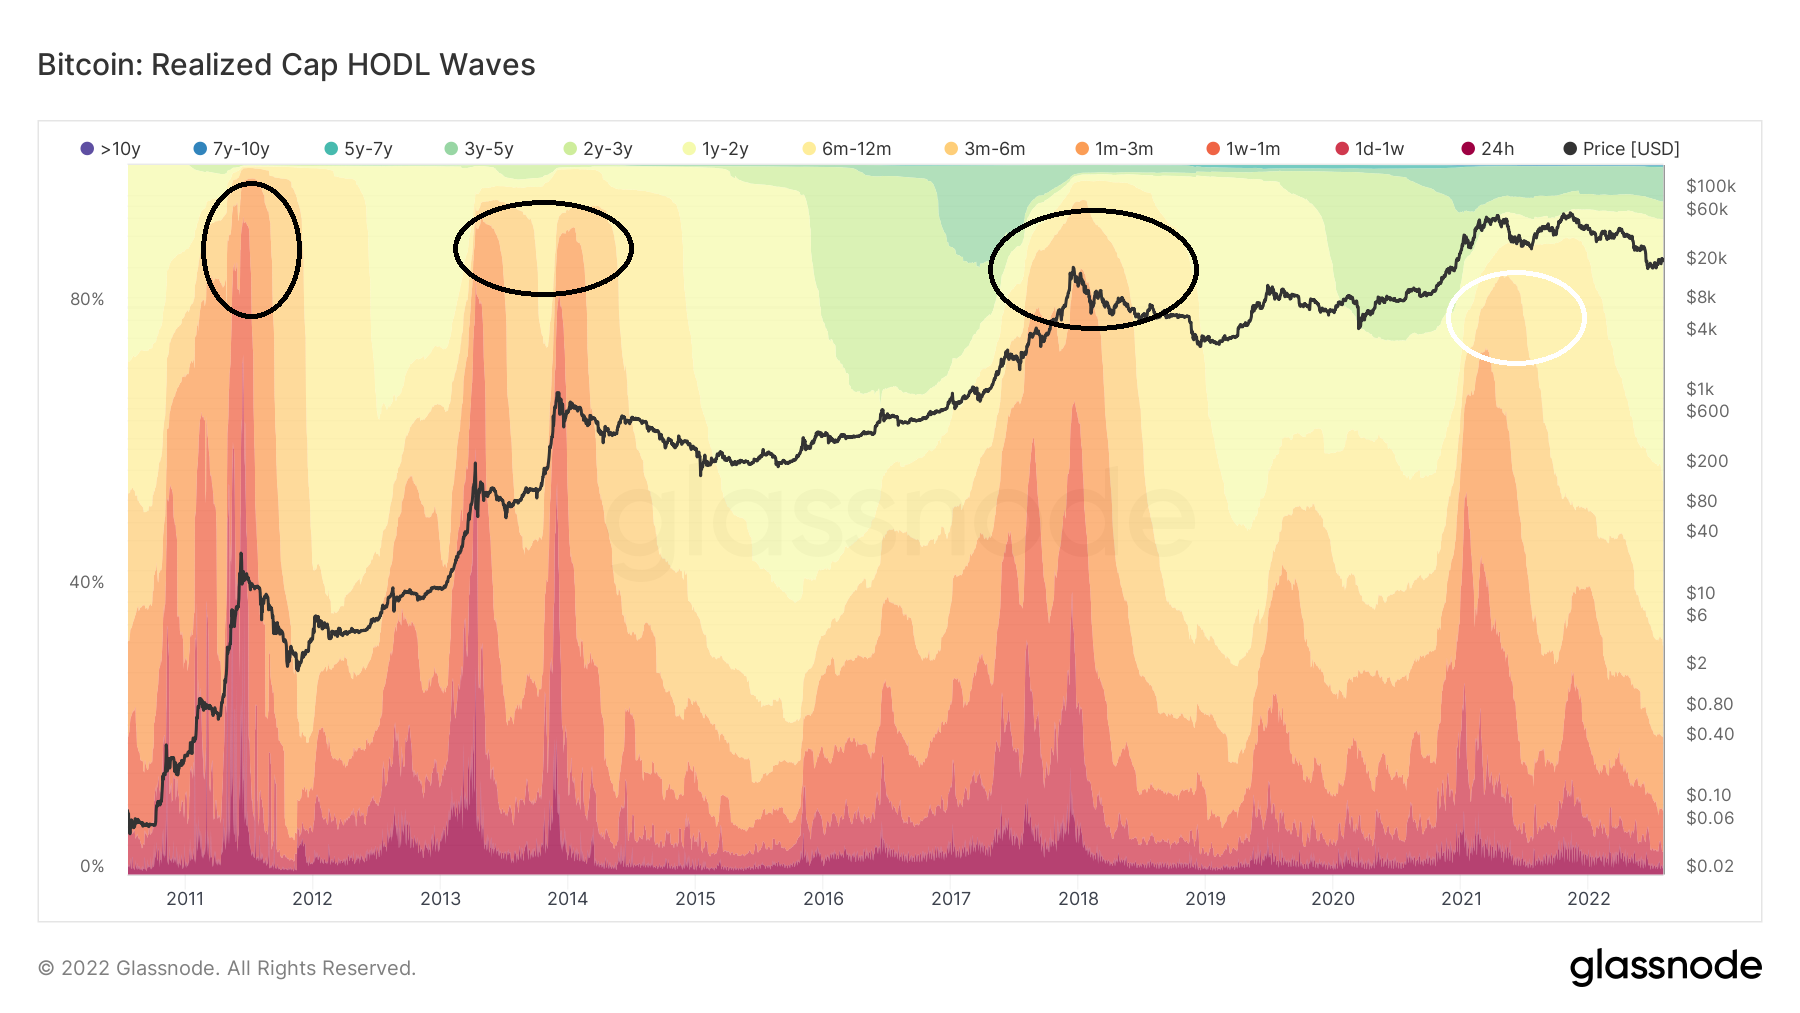
During market cycle tops, bands between one day and one month (red) spike considerably. This occurs as a result of long-term holders having distributed all of their coins to short-term holders. This was visible in the 2013, 2017, and 2021 market cycle tops (black circles). While also present, it was not as pronounced in the May or Nov 2021 highs (white circle).
Short-term BTC holders are at a bottom
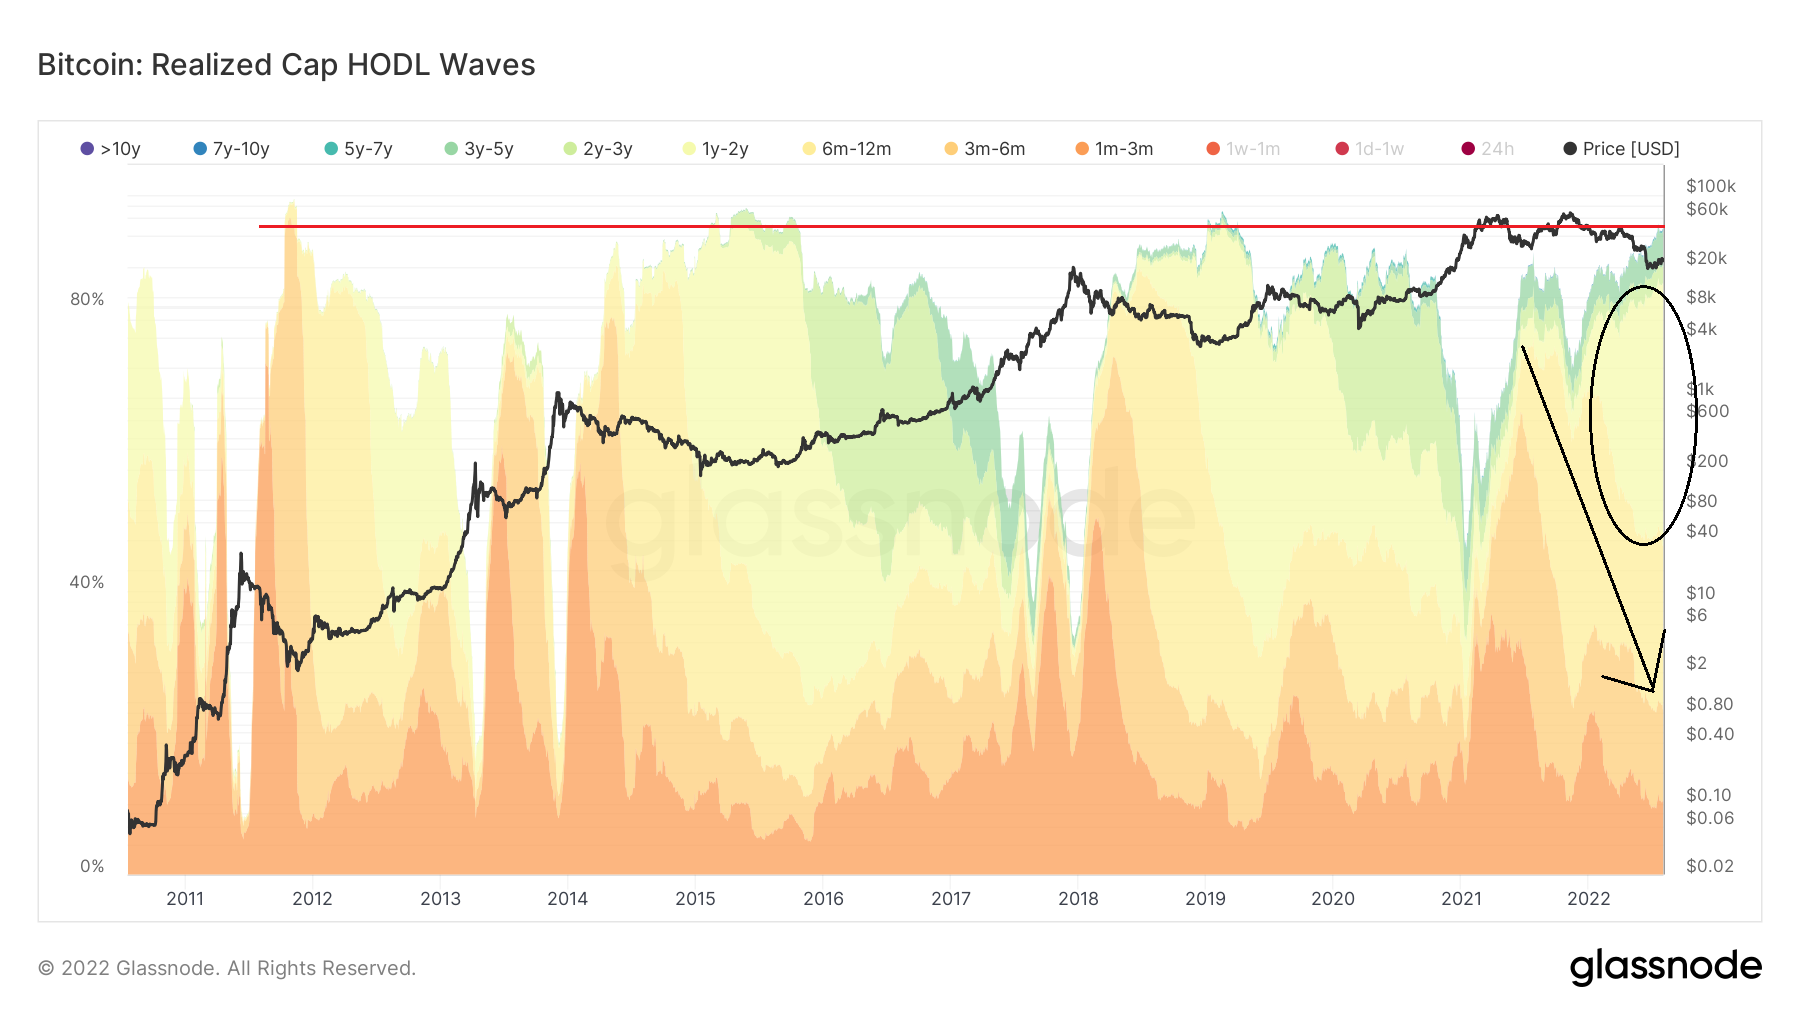
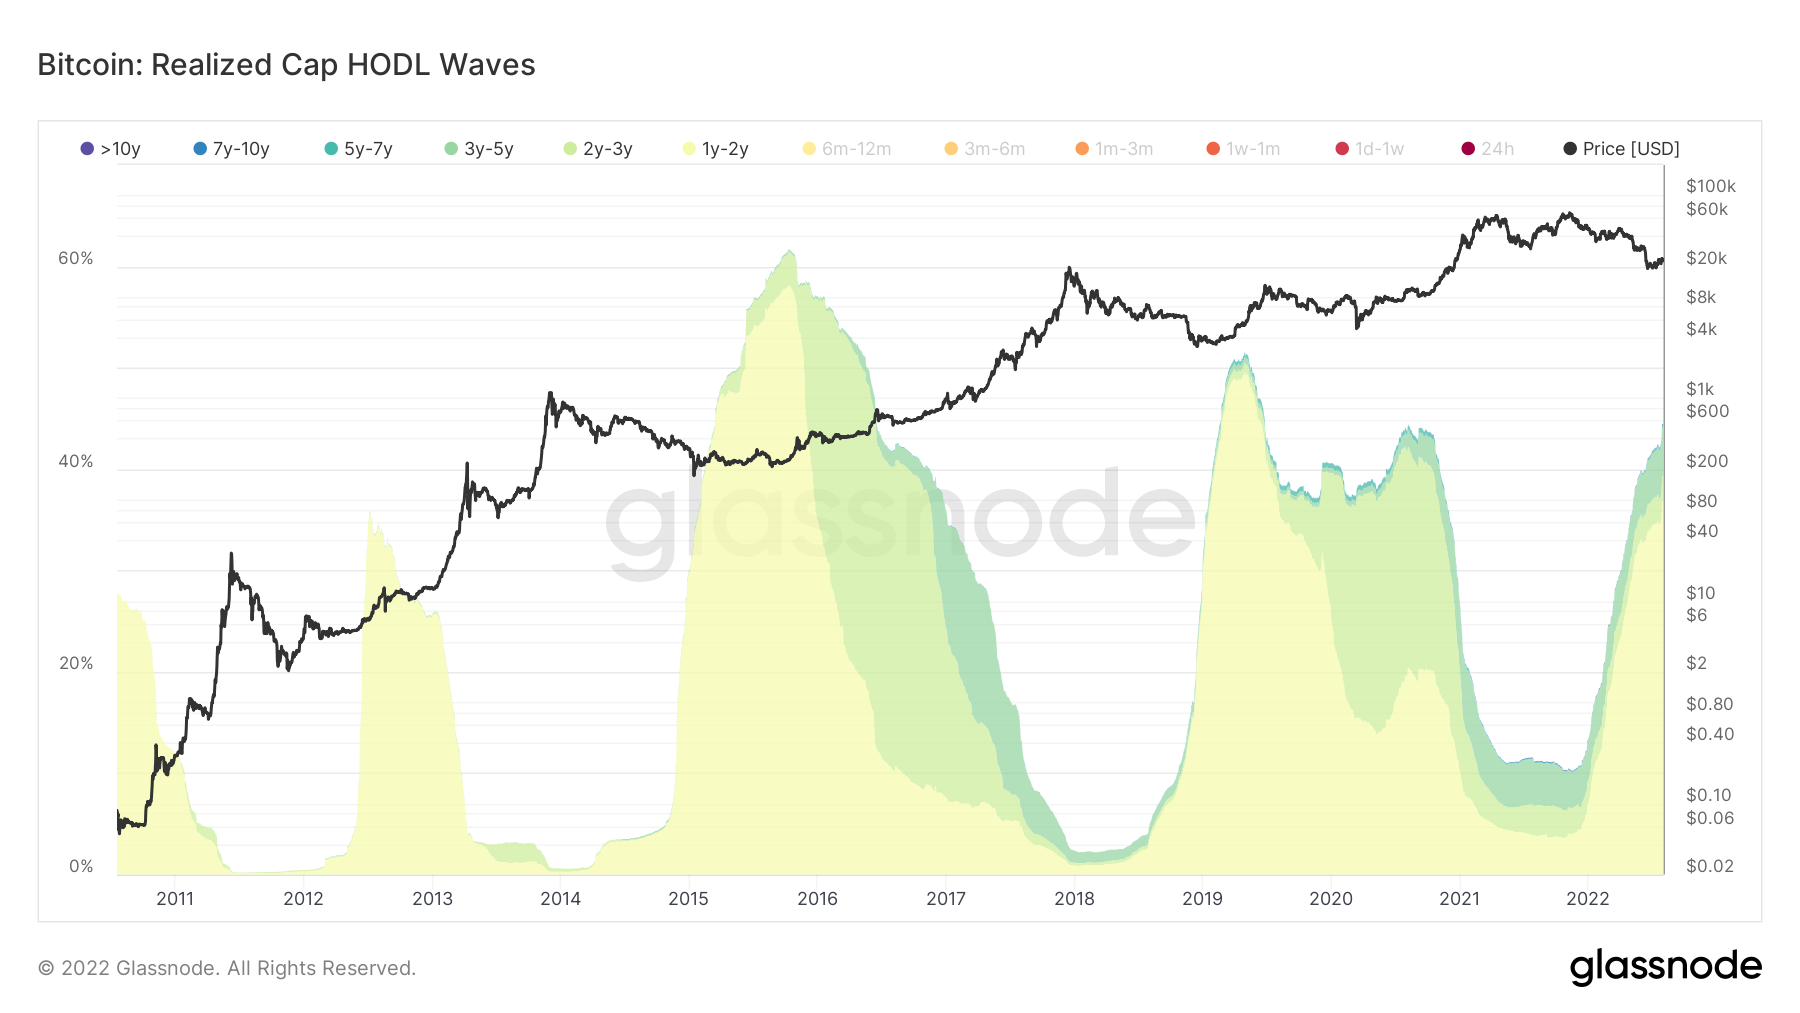
Since the all-time high, the most interesting development is the increase in the one to two-year bands. This has occurred as a result of the decrease in shorter-term bands between one week and 12 months.
Since Nov, the one to two-year band has increased considerably (black circle). During this time, short-term bands have decreased considerably (black circle).
To summarize, the change in bands from Nov 2021 to Aug 2022 has been:
- 1 week – 1 month: 15 to 5%
- 1-3 months: 15 to 10%
- 3-6 months: 17 to 14%
- 6-12 months: 38 to 22%
- 1-2 years: 4 to 37%
Moreover, when removing bands smaller than one month, the current percentage of 91% is in line with previous market cycle bottoms. This means that short-term holders currently have only 9% of the tokens in circulation.
Previous market cycles
Historically, the one to two-year band has been close to 35% when the absolute bottom was reached. In 2015, the band was at 33% when the bottom was reached, while in 2018 it was at 30%, but increased rapidly and reached a high of 48% only three months later.
Currently, the band is at 37% and increasing. Therefore, it is possible that the price is in the accumulation phase after the bottom.
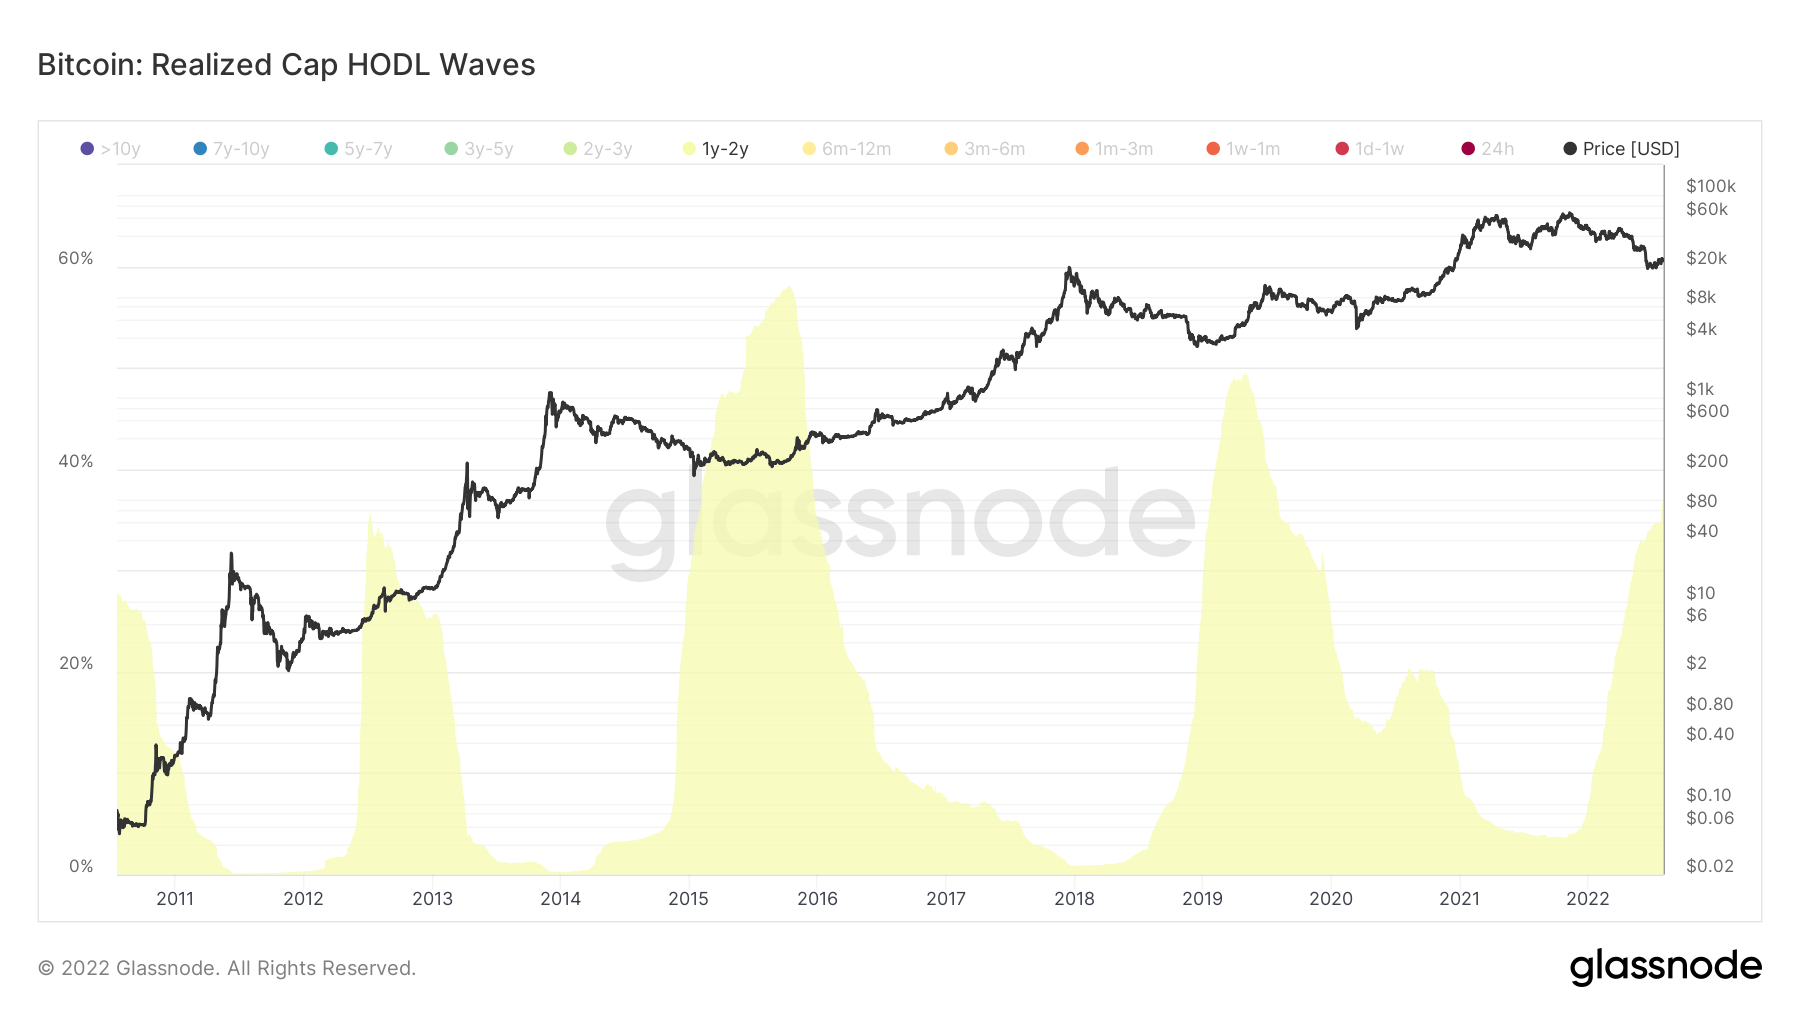
At the end of the accumulation phase, the one to two-year band decreases once more, while the two to three-year band begins to swell.
Since the one to two-year band has been increasing since Nov, if those buyers were to hold, they would gradually move to the two to three-year band (green) starting in Nov 2022. If this were to occur, it would likely mark the end of the accumulation phase and the beginning of the next bull market.
For Be[in]Crypto’s latest Bitcoin (BTC) analysis, click here
Disclaimer
In line with the Trust Project guidelines, this price analysis article is for informational purposes only and should not be considered financial or investment advice. BeInCrypto is committed to accurate, unbiased reporting, but market conditions are subject to change without notice. Always conduct your own research and consult with a professional before making any financial decisions. Please note that our Terms and Conditions, Privacy Policy, and Disclaimers have been updated.
