
Be[In]Crypto takes a look at the Mayer Multiple (MM) and its components in order to determine if the long-term bias for bitcoin (BTC) is bullish or bearish.
BTC and the 200-day MA
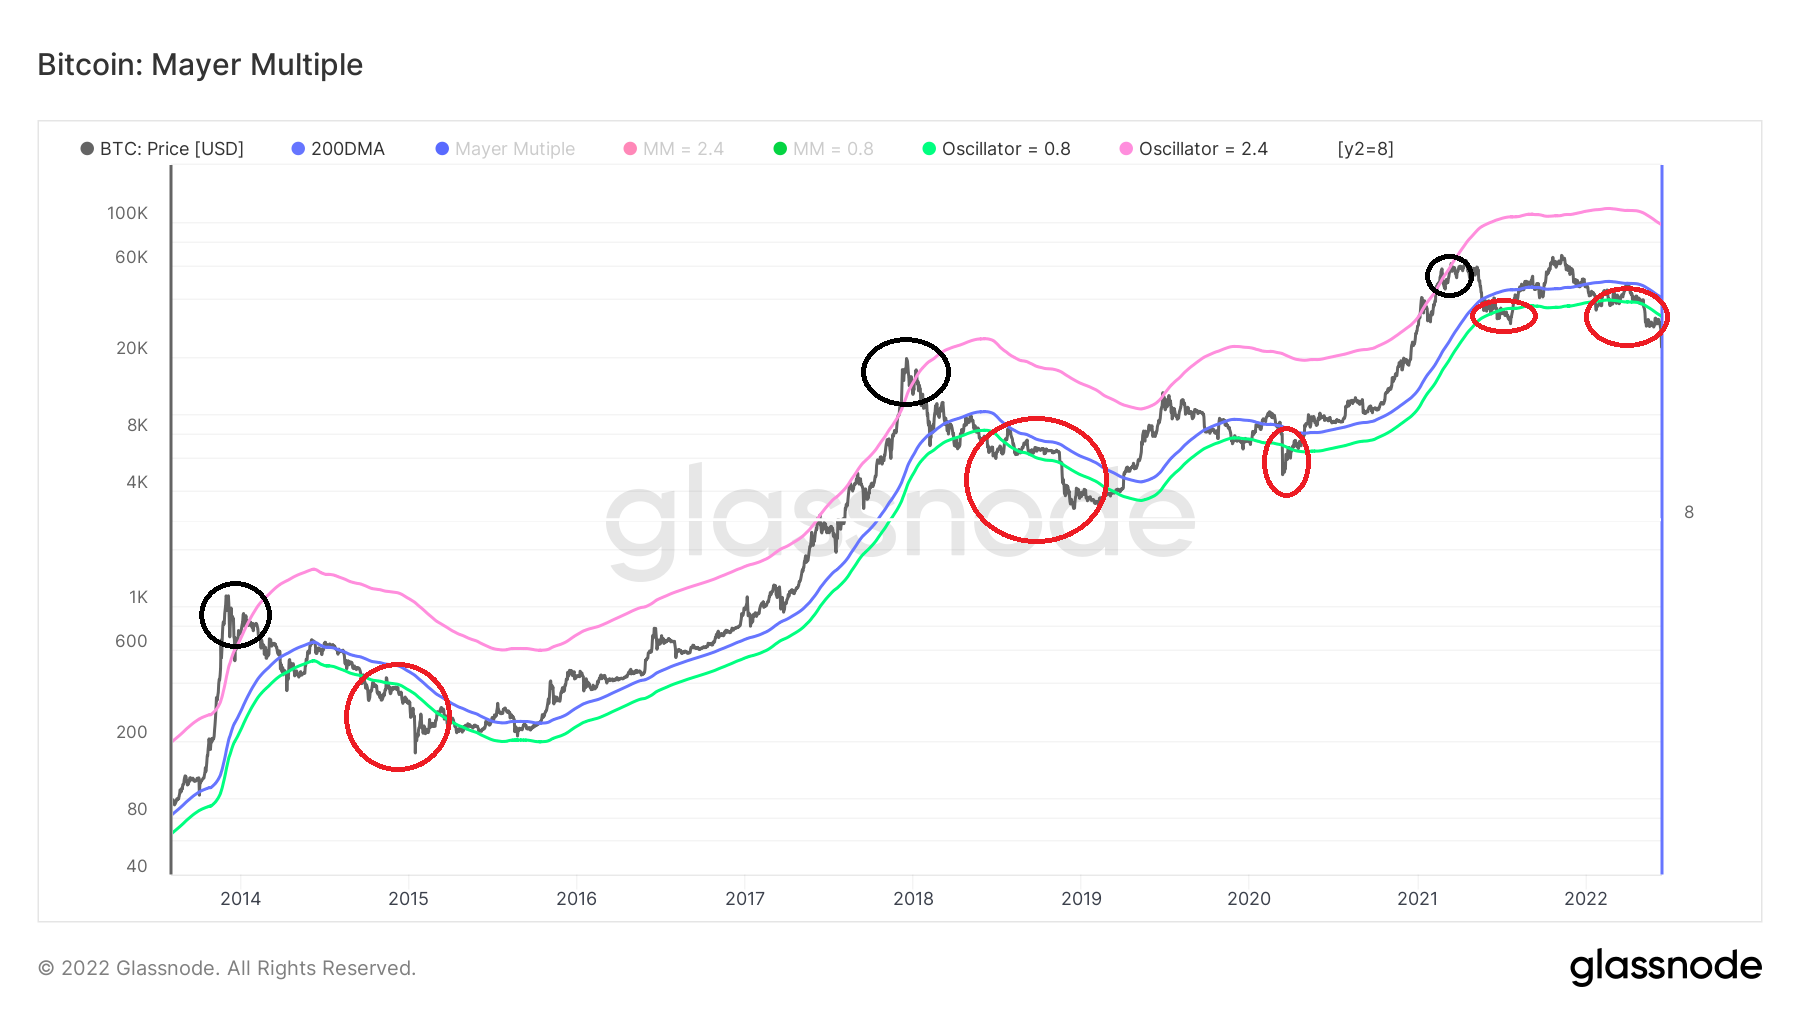
In order to determine the direction of the trend, the BTC price (black) is plotted alongside its 200-day moving average (MA, blue). In simplified terms, the trend is bullish if the price is trading above this MA while it is bearish if it is trading below it.
Afterward, in order to more accurately determine tops and bottoms, the 0.8 (green) and 2.4 (purple) oscillators of this MA are added to the chart.
Throughout the price history of BTC, the 2.4 oscillator has been very accurate in determining market cycle tops. All three tops (black circles) have been made once the price has moved above this oscillator.
Conversely, while all market bottoms (red circles) have been made below the 0.8 oscillator, the indicator has not been as accurate in determining bottoms since they usually took a considerable time to form measuring from the first breakdown.
More recently, BTC fell below this MA in July 2021 and Jan 2022. After a brief pause, it decisively broke down in early June, and is now trading considerably below this level.
Capitulation and bottom
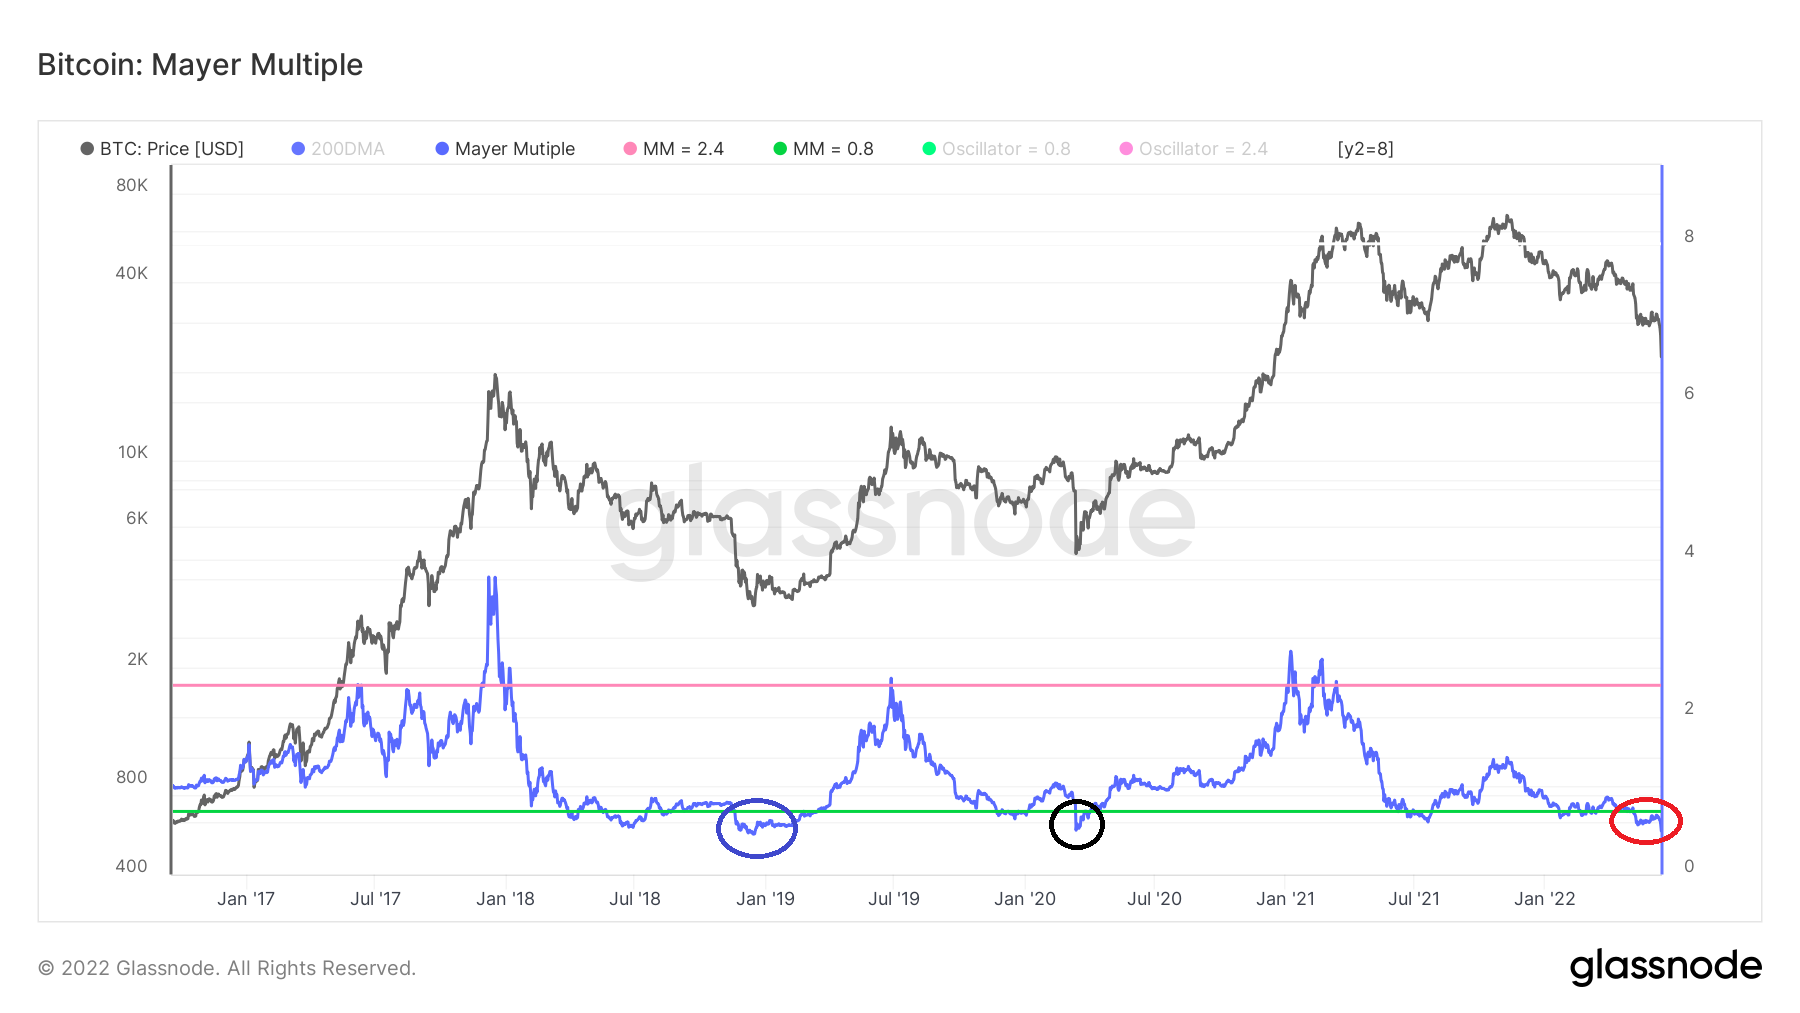
The Mayer Multiple (MM) is an oscillator that is calculated by taking the ratio between the BTC price and its 200-day moving average (MA).
The Mayer Multiple indicator (blue) is afterward created by taking the difference of the BTC price and its 200-day MA. The 0.8 (green) and 2.4 (purple) oscillator are then plotted in order to determine market tops and bottoms.
This method is more accurate than simply using raw data, especially when predicting bottoms.
In our previous analysis, it was stated that a “capitulation event similar to that of Nov to Dec 2018” could occur. This was said due to the movement above and below the 0.8 MM oscillator.
Now, MM has reached a value of 0.55 (red circle). This is slightly lower than that of March 2020 (black circle) and in line with the reading during Dec 2018 (blue circle), at the absolute bottom that marked the beginning of the current market cycle.
So, if previous history is followed, BTC will soon reach, or has already reached, a bottom.
For Be[in]Crypto’s latest bitcoin (BTC) analysis, click here
