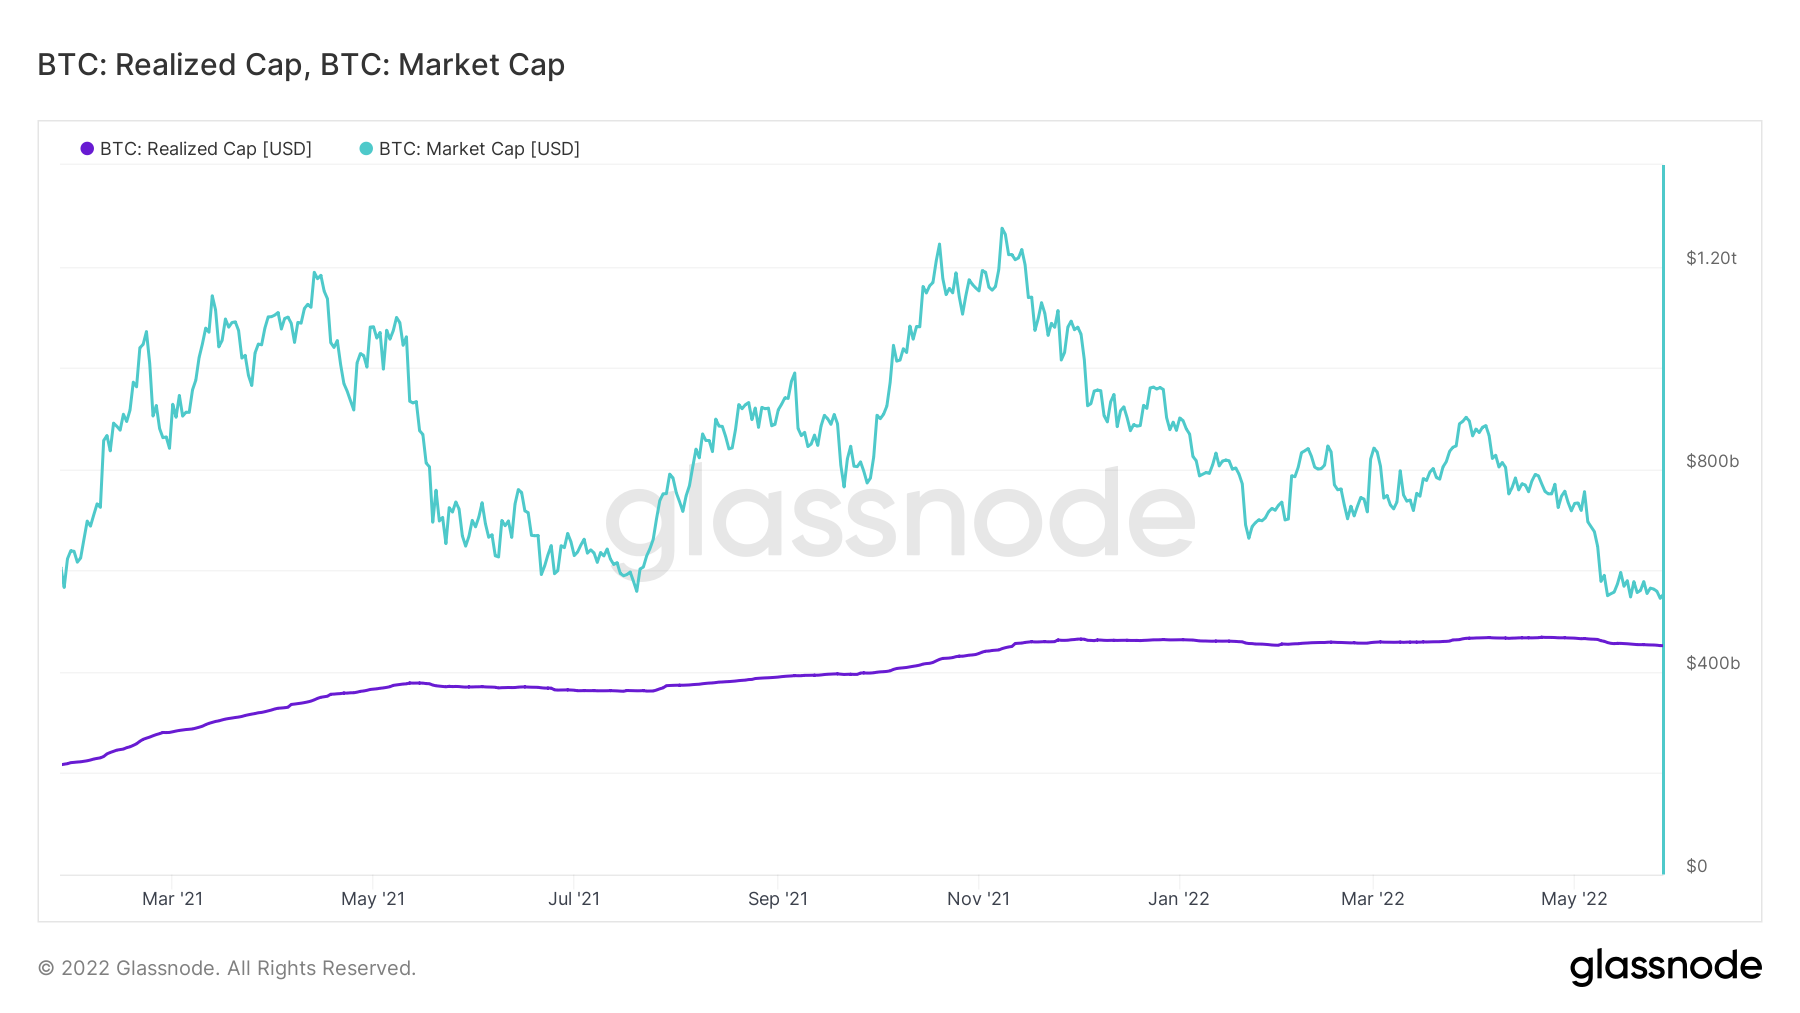
BeInCrypto takes a look at Bitcoin (BTC) on-chain indicators, more specifically the realized and market capitalization and their relationship with each other.
Realized and market caps
The market cap (MC), is derived by multiplying the total number of coins that are minted with the current BTC price. The realized cap (RC) uses a slightly different formula. Instead of the current price, it uses the price at the time they last moved. As a result of this modification, it can be seen as a more accurate representation of the current value of BTC. One of the main features of the realized cap is the devaluation of coins that have not moved for a long time or those that are lost.
In bull markets, RC usually increases at a rapid rate, since old coins are moved in order to realize profits. Conversely, it falls in bear markets when investors sell at a loss.
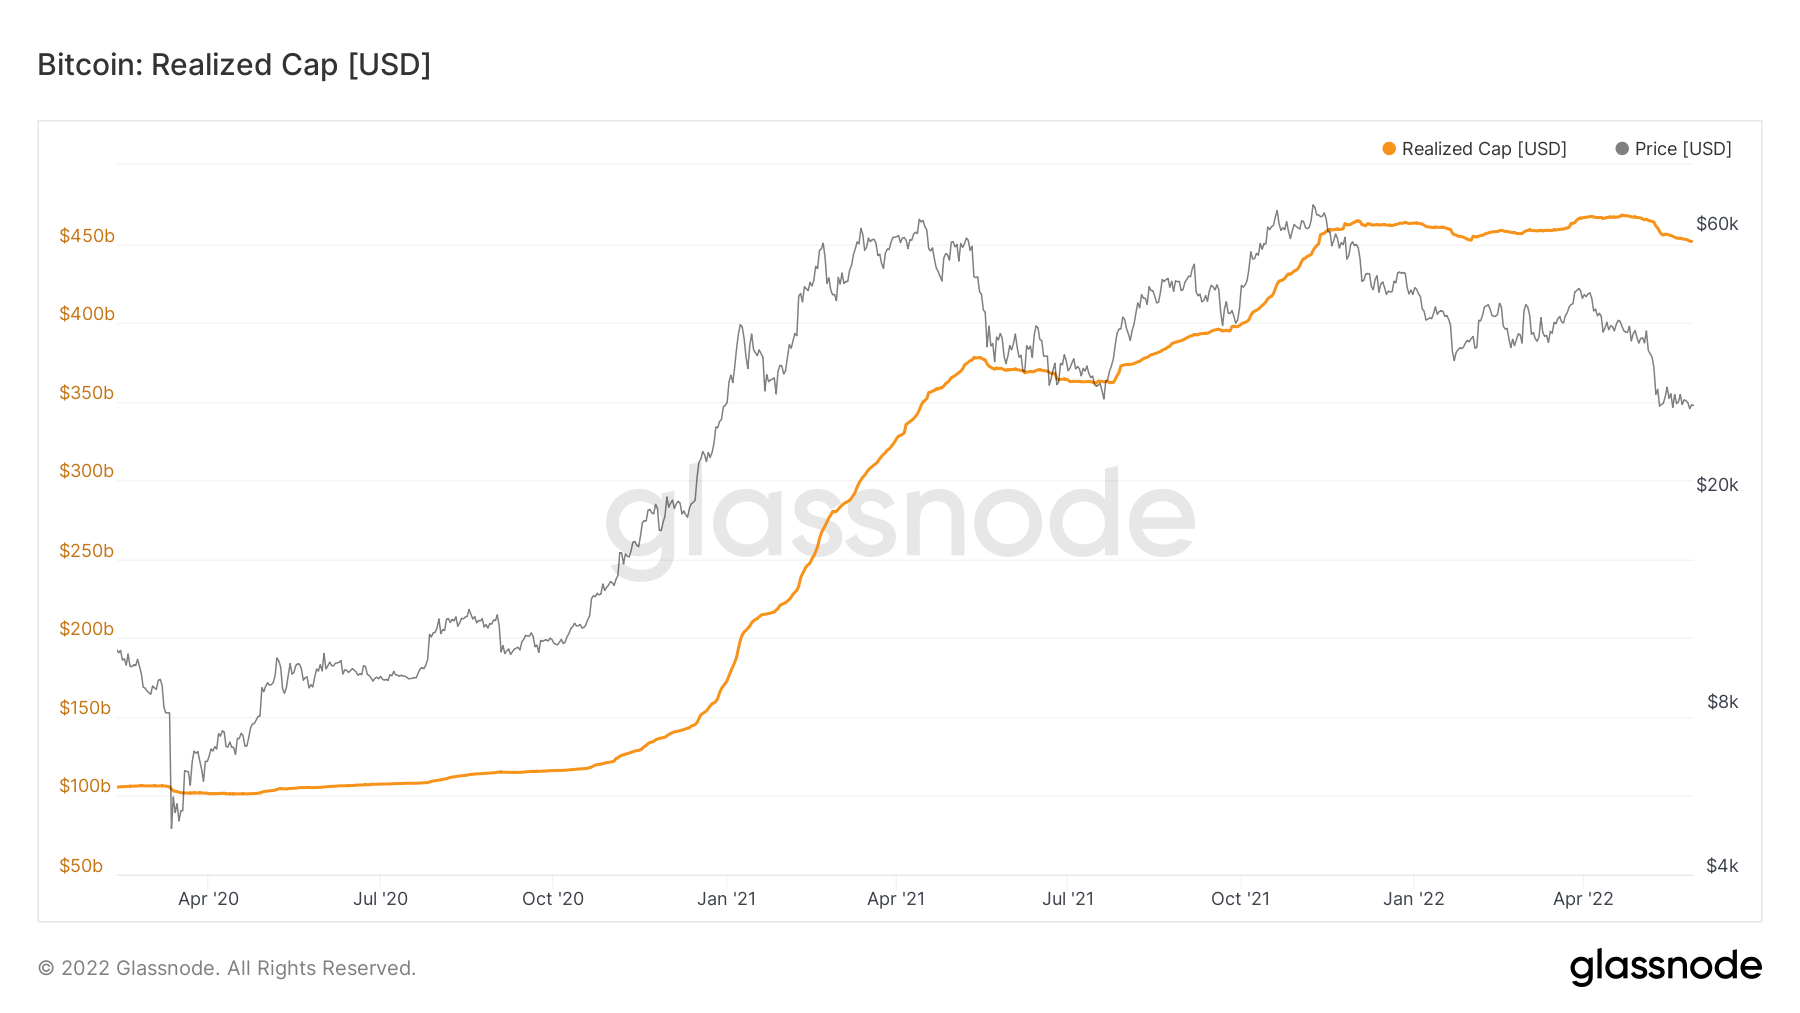
The realized cap increased at a rapid pace in the period between Nov. 2020 and May 2021. Afterward, it initiated another upward movement that continued until Nov. 2021. This movement was much more gradual than the preceding one.
The realized cap reached an all-time high of $466 Billion (Bn) on March 25, 2022. At the time, BTC was trading at $47,000. This reading suggests that investors did not take profits close to the Nov. 2021 all-time high, rather they waiter for the decrease and ensuing bounce in order to do so.
As a result, while the BTC price has fallen by more than 50% since the all-time high, the realized cap has fallen by less than 10%.
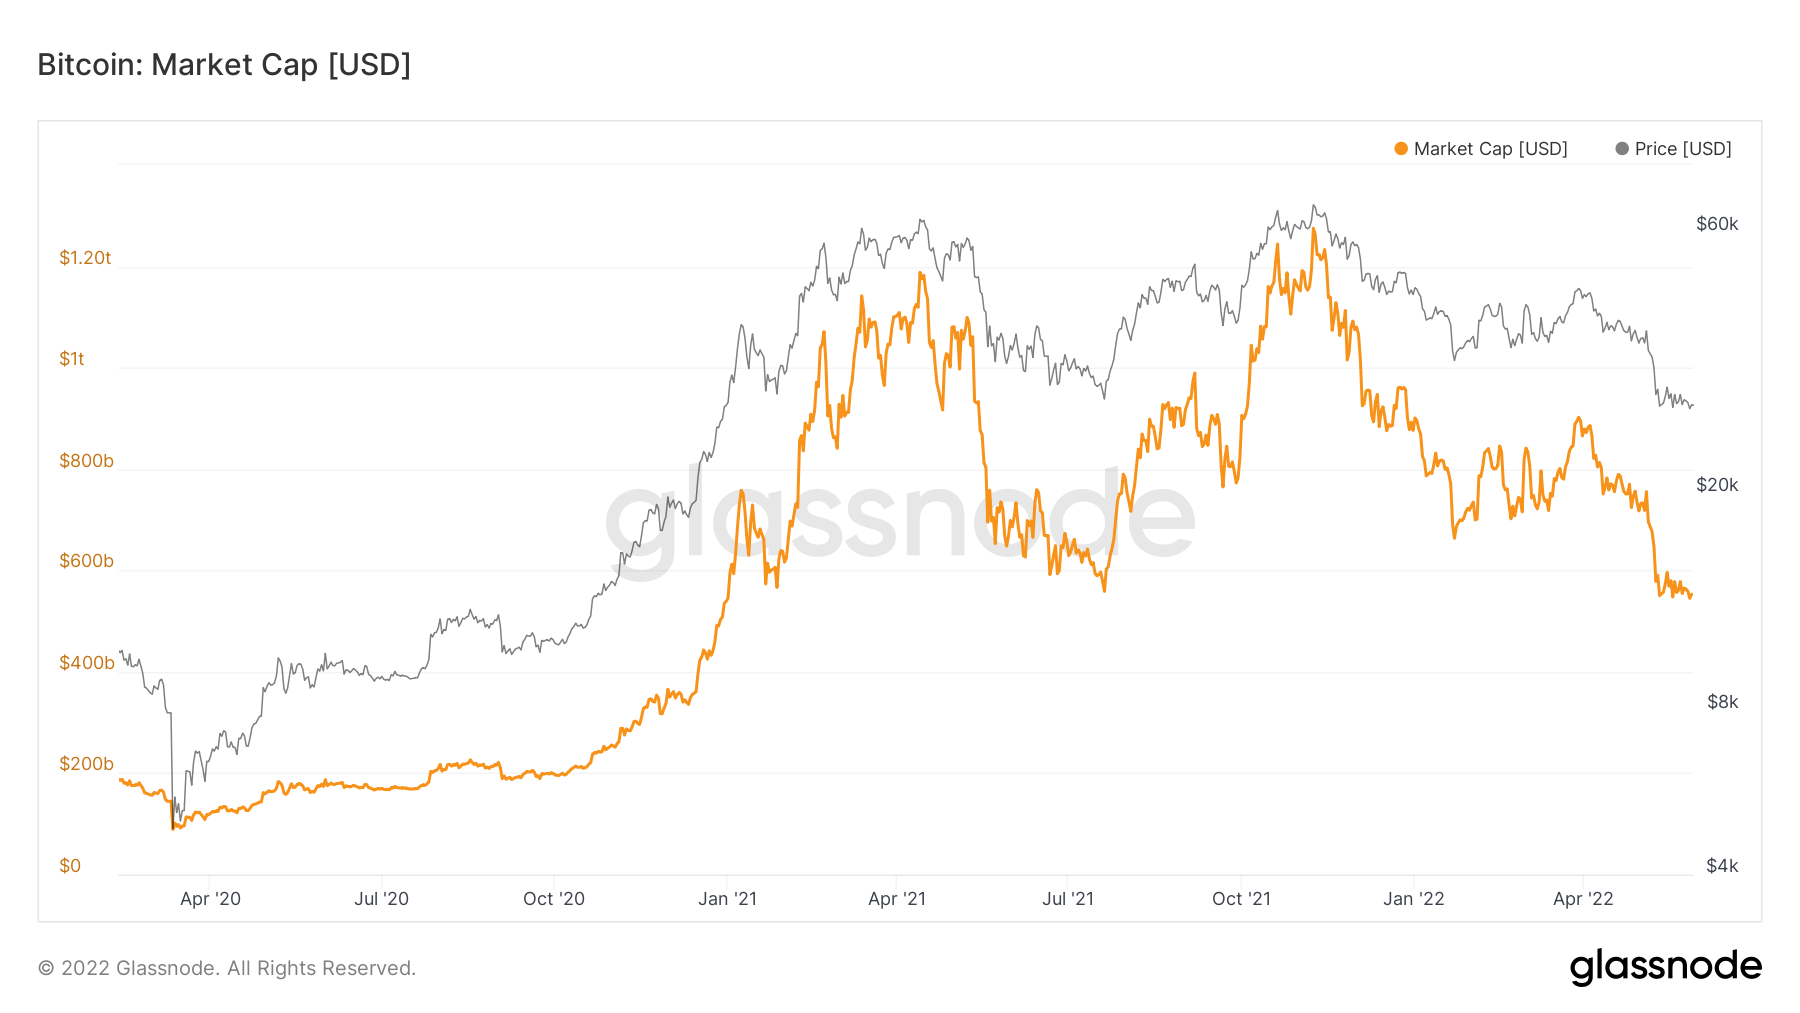
Since the market cap uses the current price instead of the time in which the coin last moved, its movement mimics that of the BTC price. The market cap is currently at $558 Bn.
Ratio between the two
The more interesting characteristics for determining the trend come from the relationship between the two capitalization formulas.
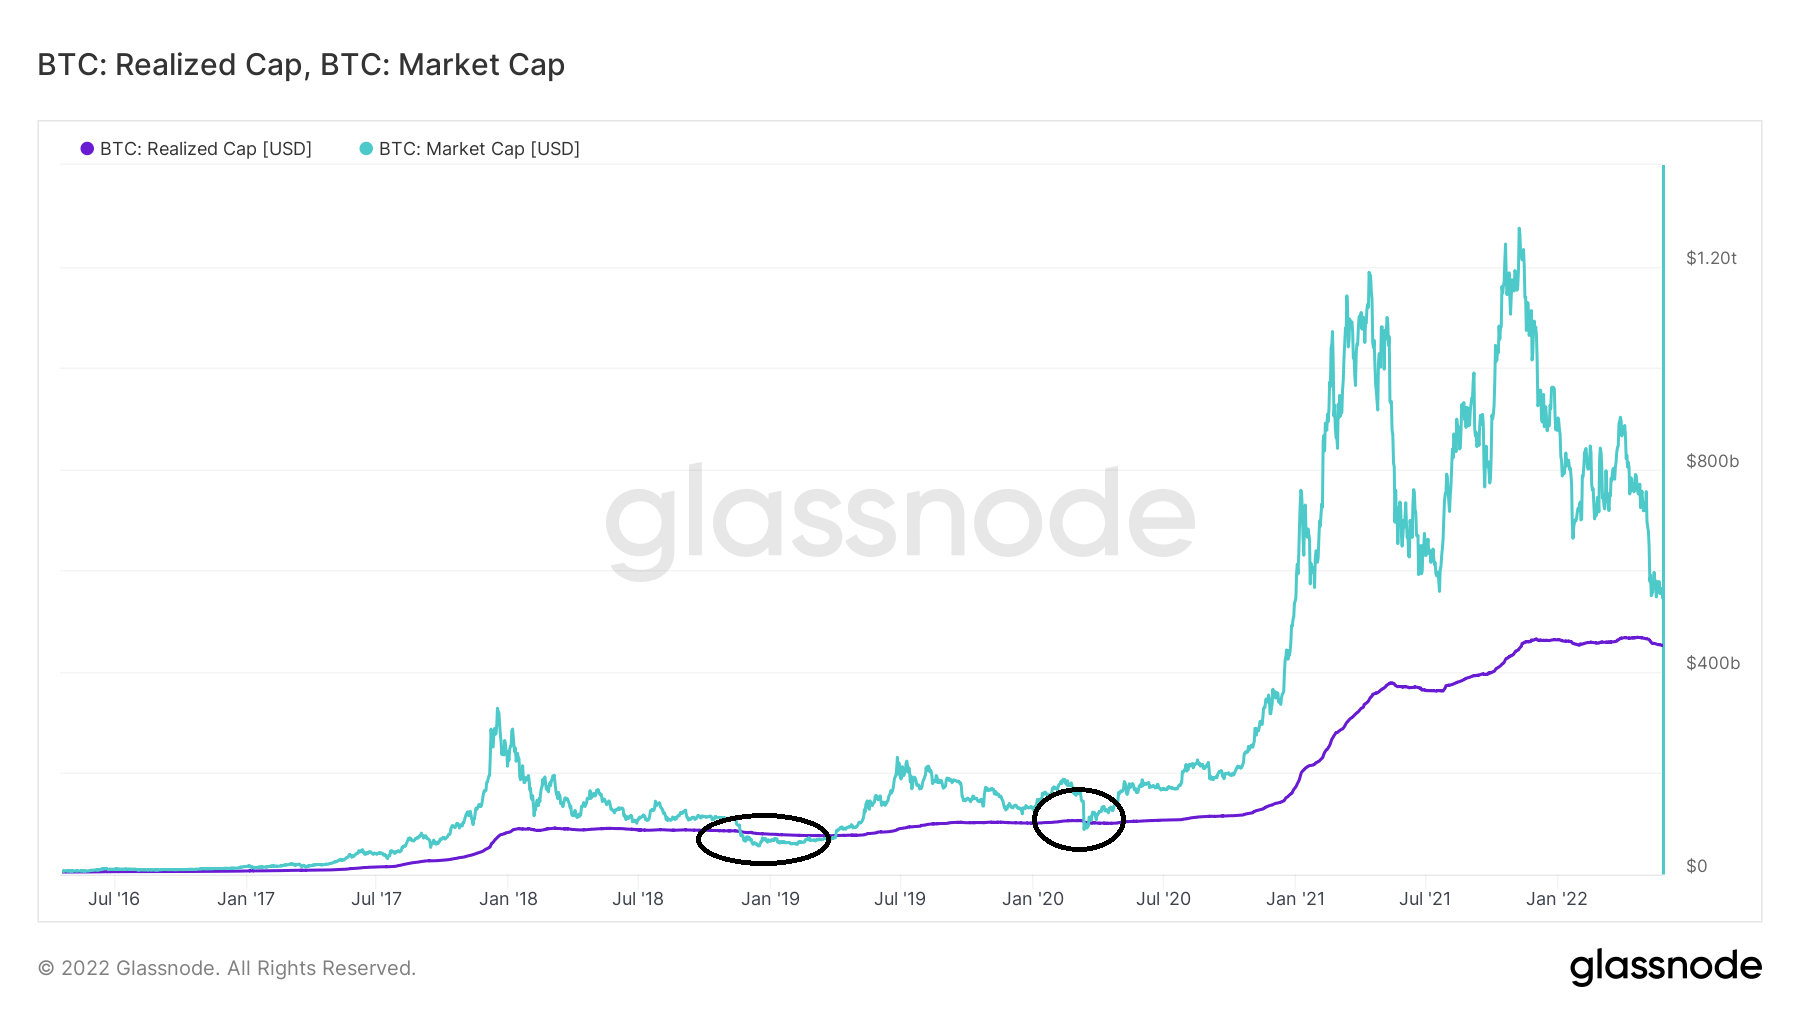
Since 2017, there have been only two periods in which the market cap (light blue) falls below the realized cap (purple). Those occurred in Dec 2019 and March 2020 (black circles).
Therefore, it is possible to state that market bottoms are formed when the market cap falls below the realized cap.
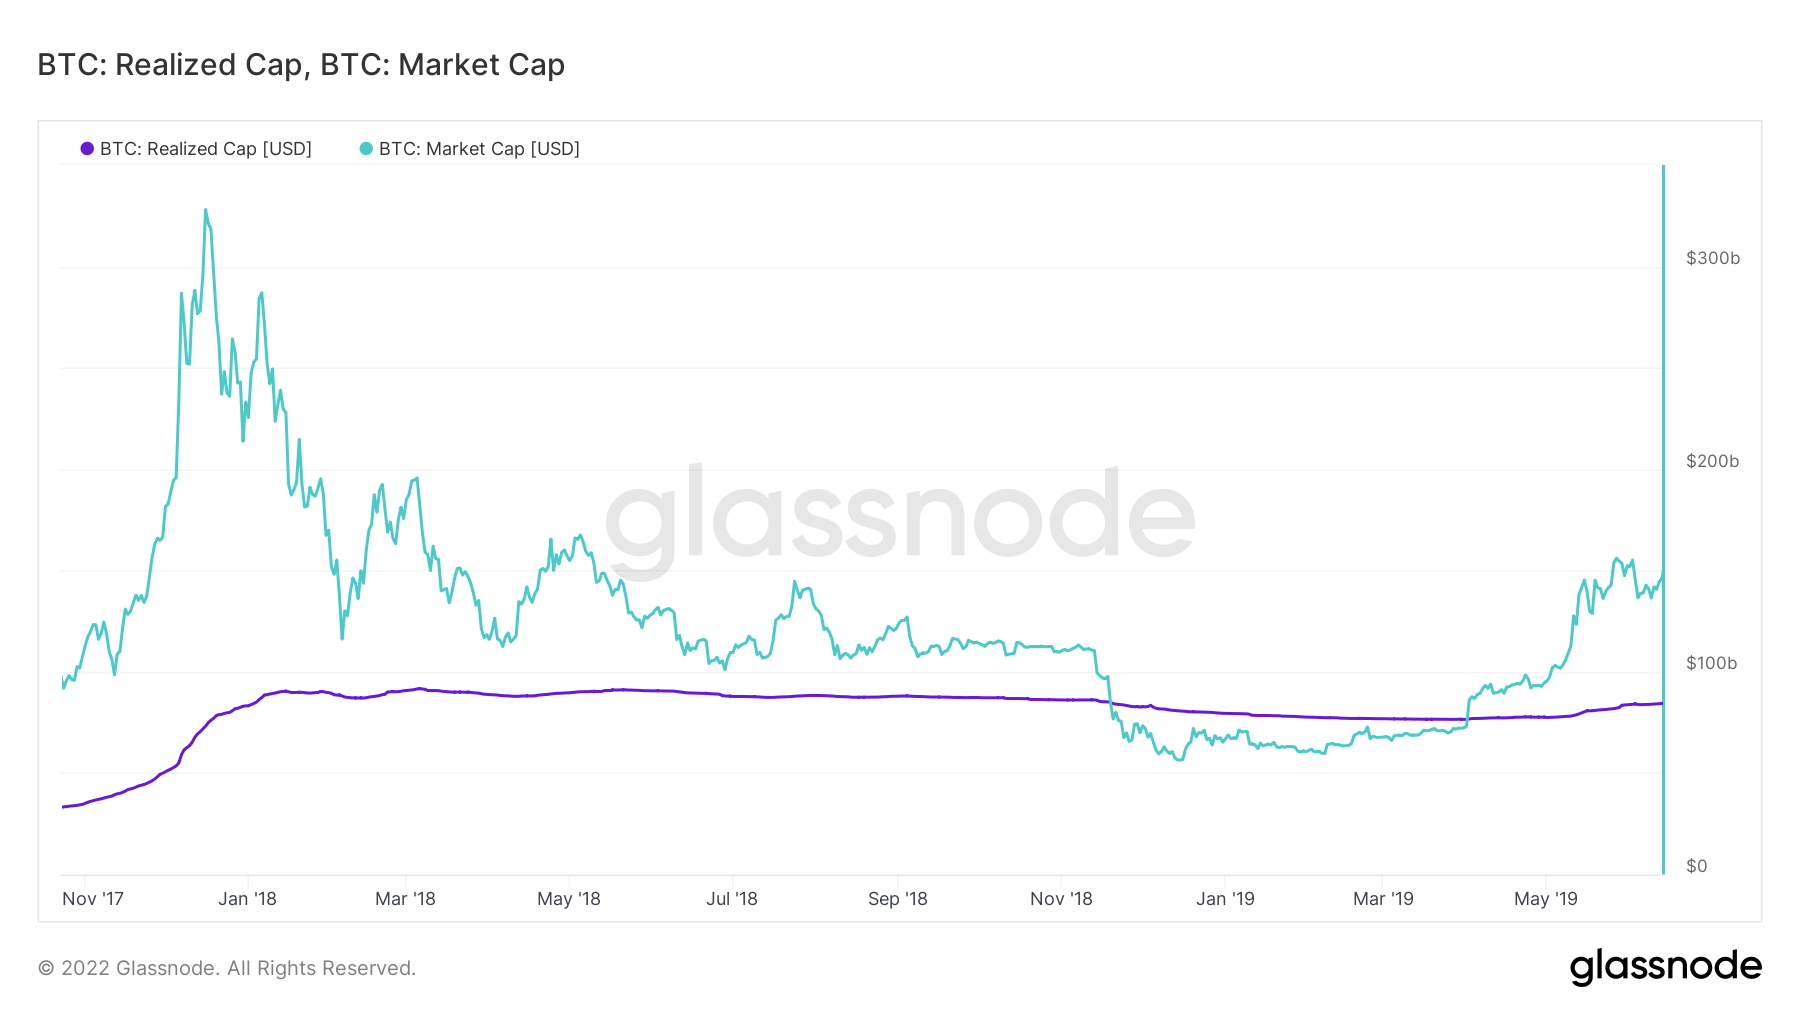
There is a similarity between the period leading up to the Jan 2019 bottom and the current one.
After a sustained upward movement, the market cap consolidated above the realized cap in the period between Jan – Sept 2018, reaching three bottoms just above it.
Afterward, it dropped below it before reaching its bottom.
Currently, after a sustained upward movement, the market cap has reached two bottoms just above the realized cap and is rapidly approaching it from above.
If previous history is followed, it would suggest that a drop below the market cap could occur. This would likely be a signal that the bottom is reached.
For Be[in]Crypto’s latest bitcoin (BTC) analysis, click here
Disclaimer
In line with the Trust Project guidelines, this price analysis article is for informational purposes only and should not be considered financial or investment advice. BeInCrypto is committed to accurate, unbiased reporting, but market conditions are subject to change without notice. Always conduct your own research and consult with a professional before making any financial decisions. Please note that our Terms and Conditions, Privacy Policy, and Disclaimers have been updated.


