


Be[in]Crypto takes a look at bitcoin (BTC) on-chain indicators that relate to lifespan. More specifically, the HODL Wave is analyzed in order to draw similarities with the previous market cycles.
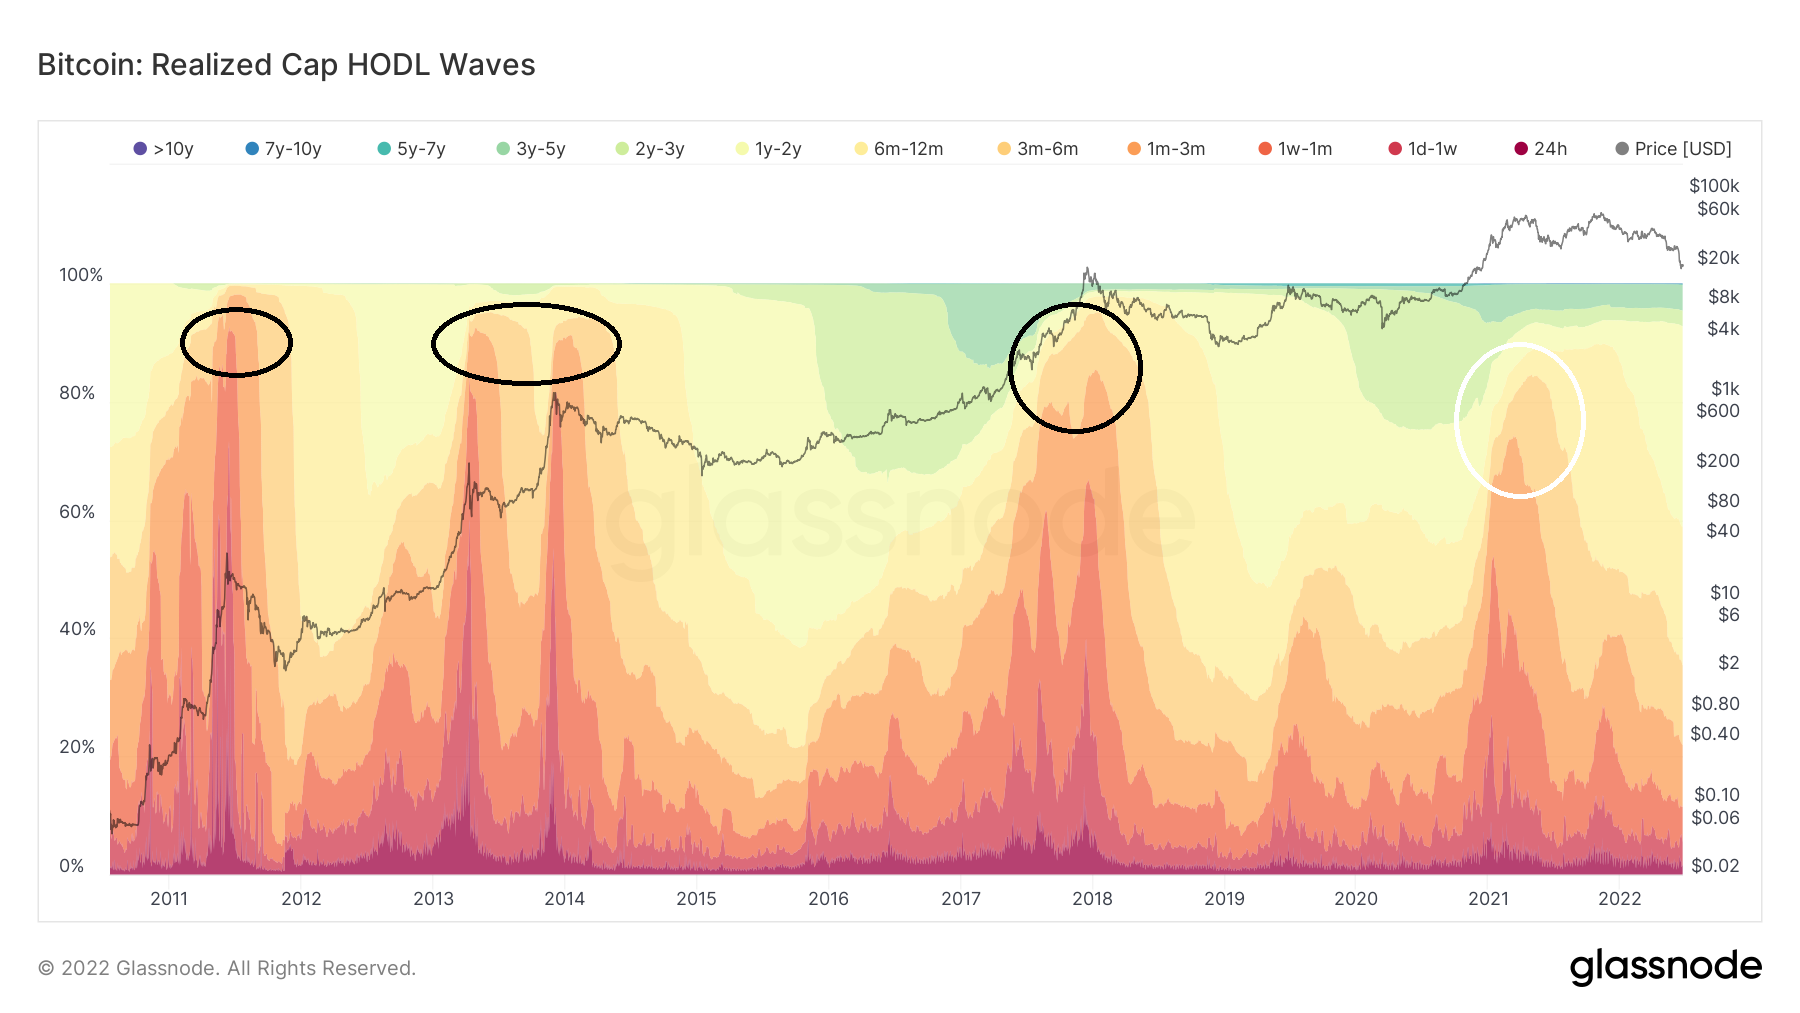
The HODL wave shows the percentage of the total BTC that has moved in a specific time period. The realized cap HODL wave uses the realized price instead of the market one in order to provide more precise data.
For example, if the HODL waveband of three to six months has a width of 20%, it means that 2-% of the total BTC supply previously moved between three and six months ago.
In the case of the HODL wave, short-term bands (red) increase once the price gets close to a market cycle top. This occurs because long-term holders are distributing their coins to new market participants. This phenomenon was especially visible in the 2013, 2017, and 2021 market cycle tops (black circles). However, it was not as visible during the current market cycle, neither in May 2021 (white) circle or during the Nov. all-time high.
Underwater buyers become holders
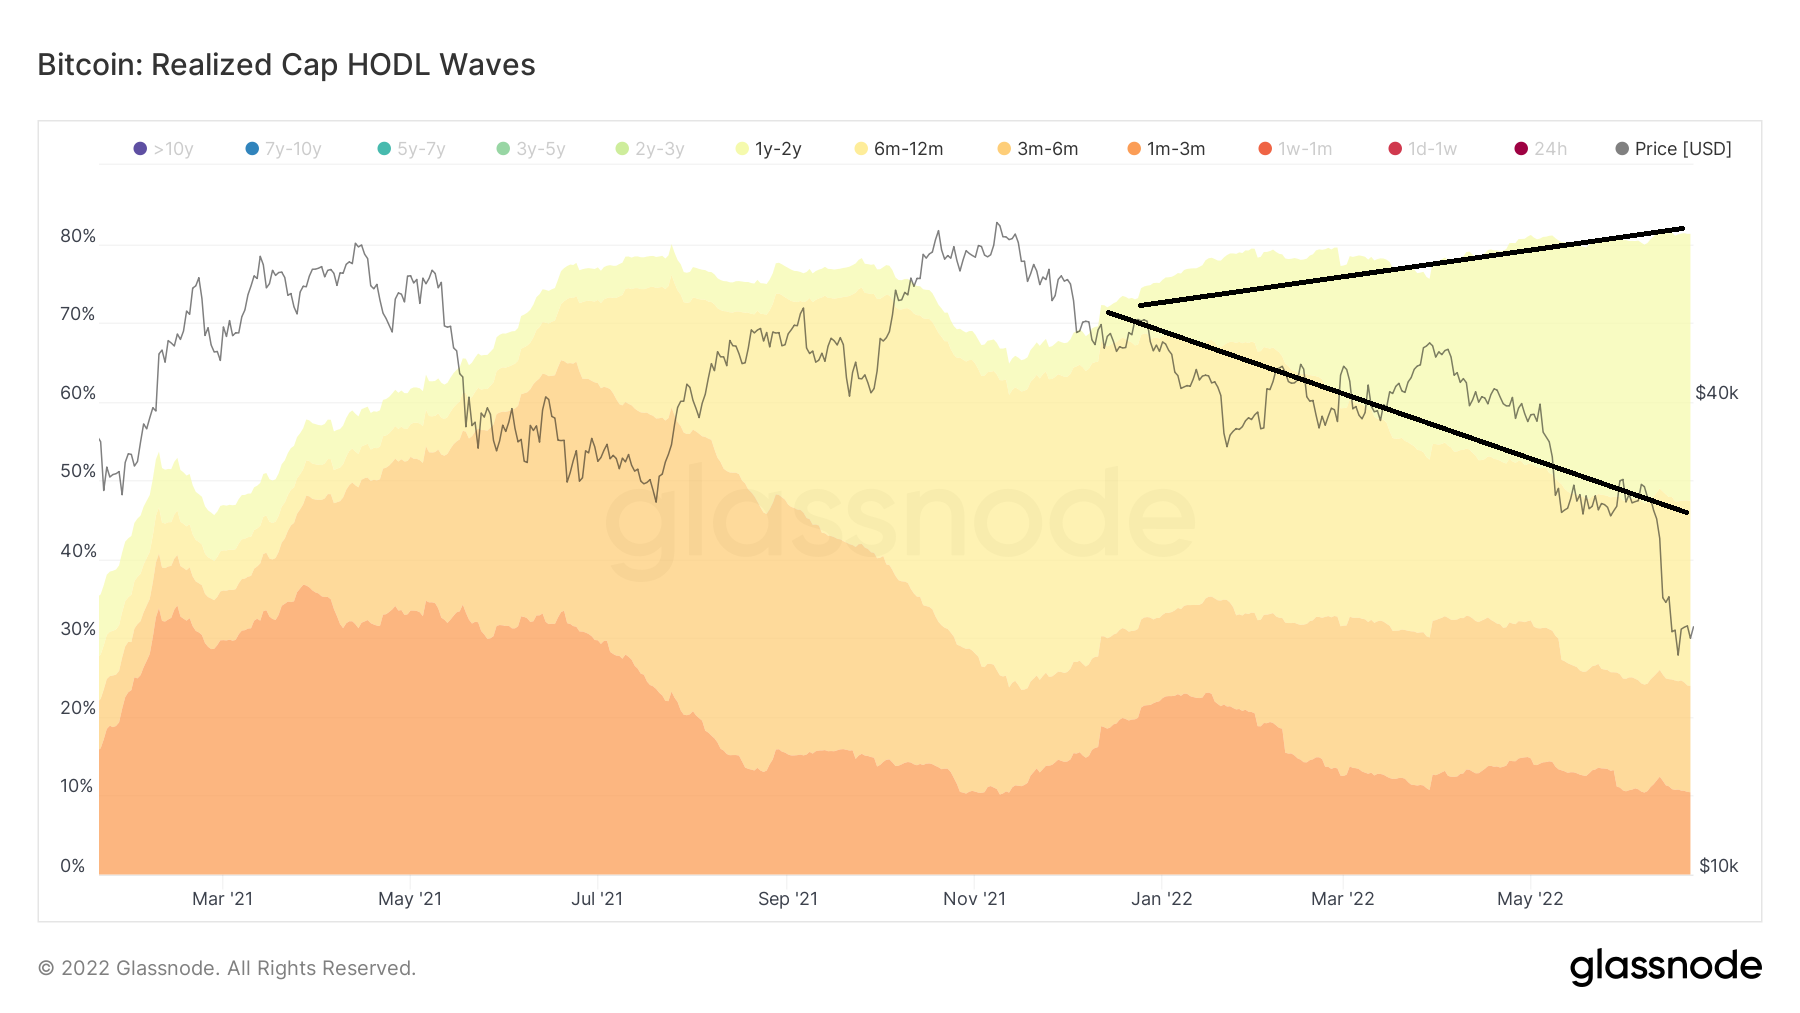
Since the all-time high, the most interesting development is the swelling of the 1-2 year bands as a result of the decrease from the 1-3, 3-6 and 6-12 month bands.
Since the beginning of Feb. 2022, the 1-2 year band has increased considerably (black lines), as a result of the decrease in shorter-term bands between 1 and 12 months. So, those that bought between Feb. 2021 – 2022 have now become holders instead of selling.
To summarize, the change in bands from Feb. to June 2022 has been:
- 1-3 months: 23 to 10%
- 3-6 months: 13 to 11%
- 6-12 months: 34 to 22%
- 1-2 years: 12 to 33%
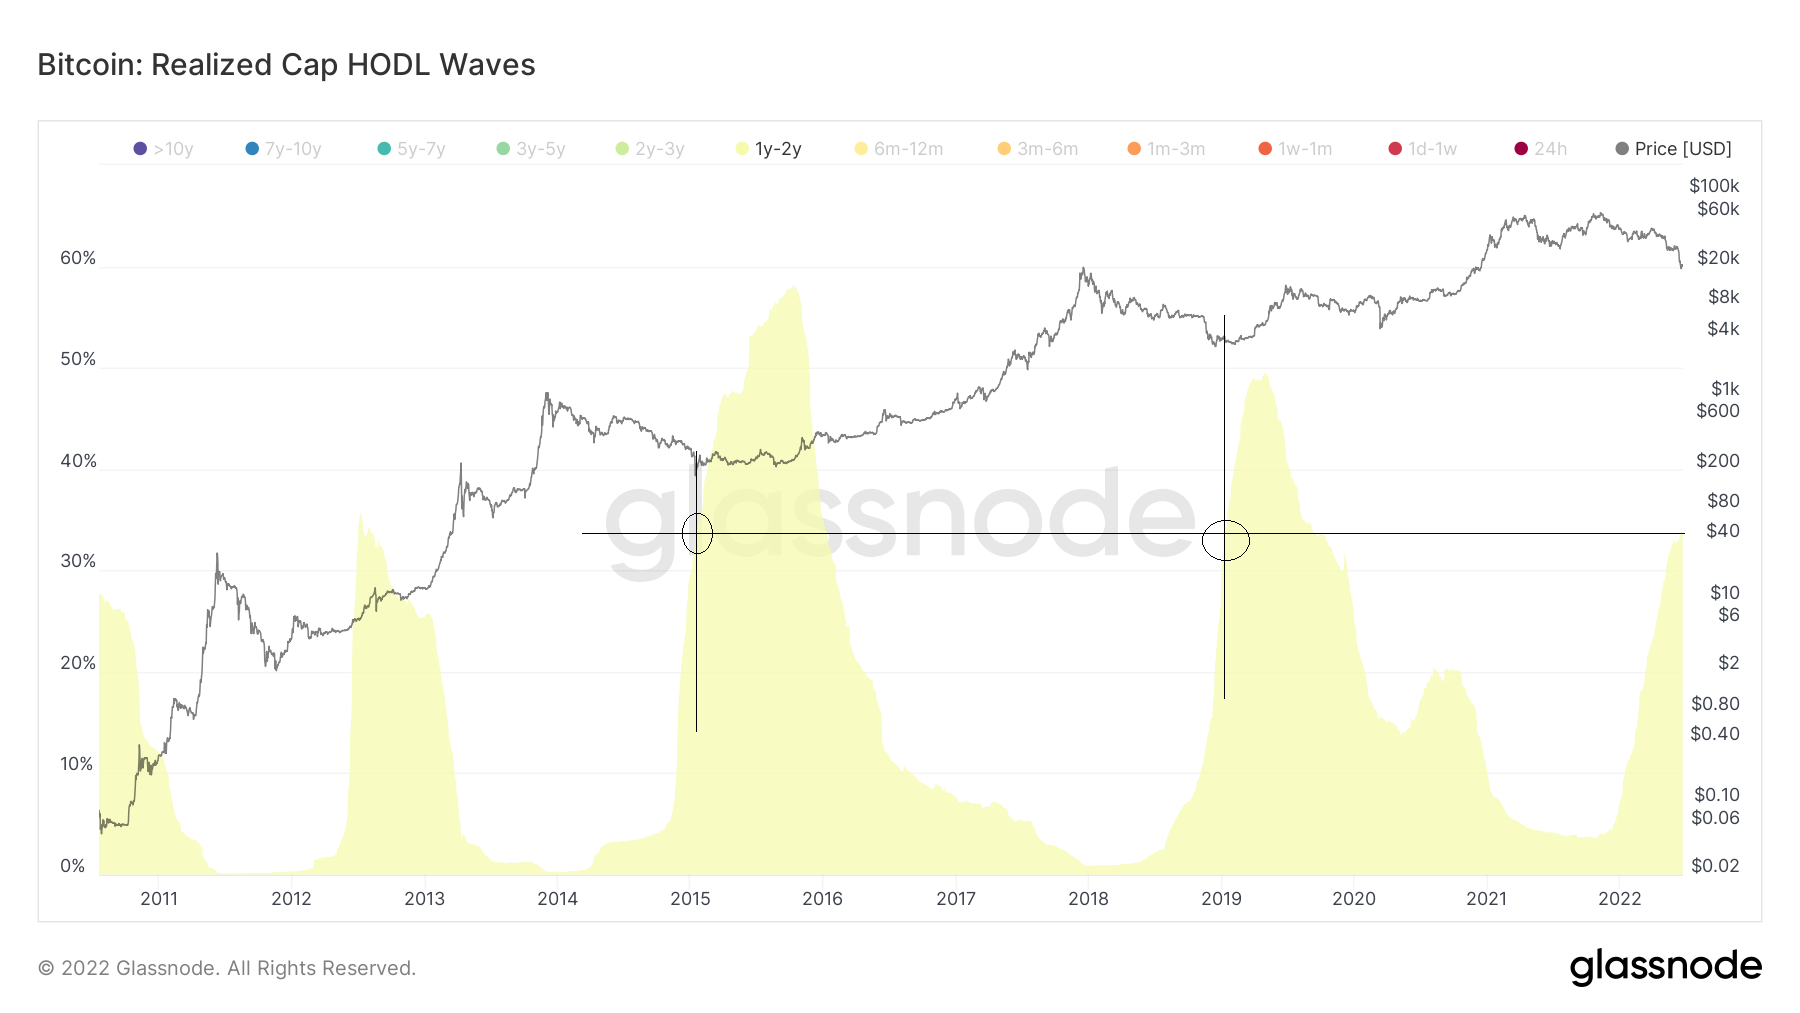
1-2 year band
Historically, the one to the two-year band has increased considerably during periods of accumulation, after a market bottom was reached.
In 2015, the band was at 33% when the bottom was reached, while in 2018 it was at 33% only two weeks before the bottom (black circles).
Afterward, during the accumulation period, this band increased to 57% and 47% in 2015 and 2018, respectively.
So, the previous history indicates that a bottom has been reached or is very close, and an accumulation period will follow.
For Be[in]Crypto’s latest bitcoin (BTC) analysis, click here


