
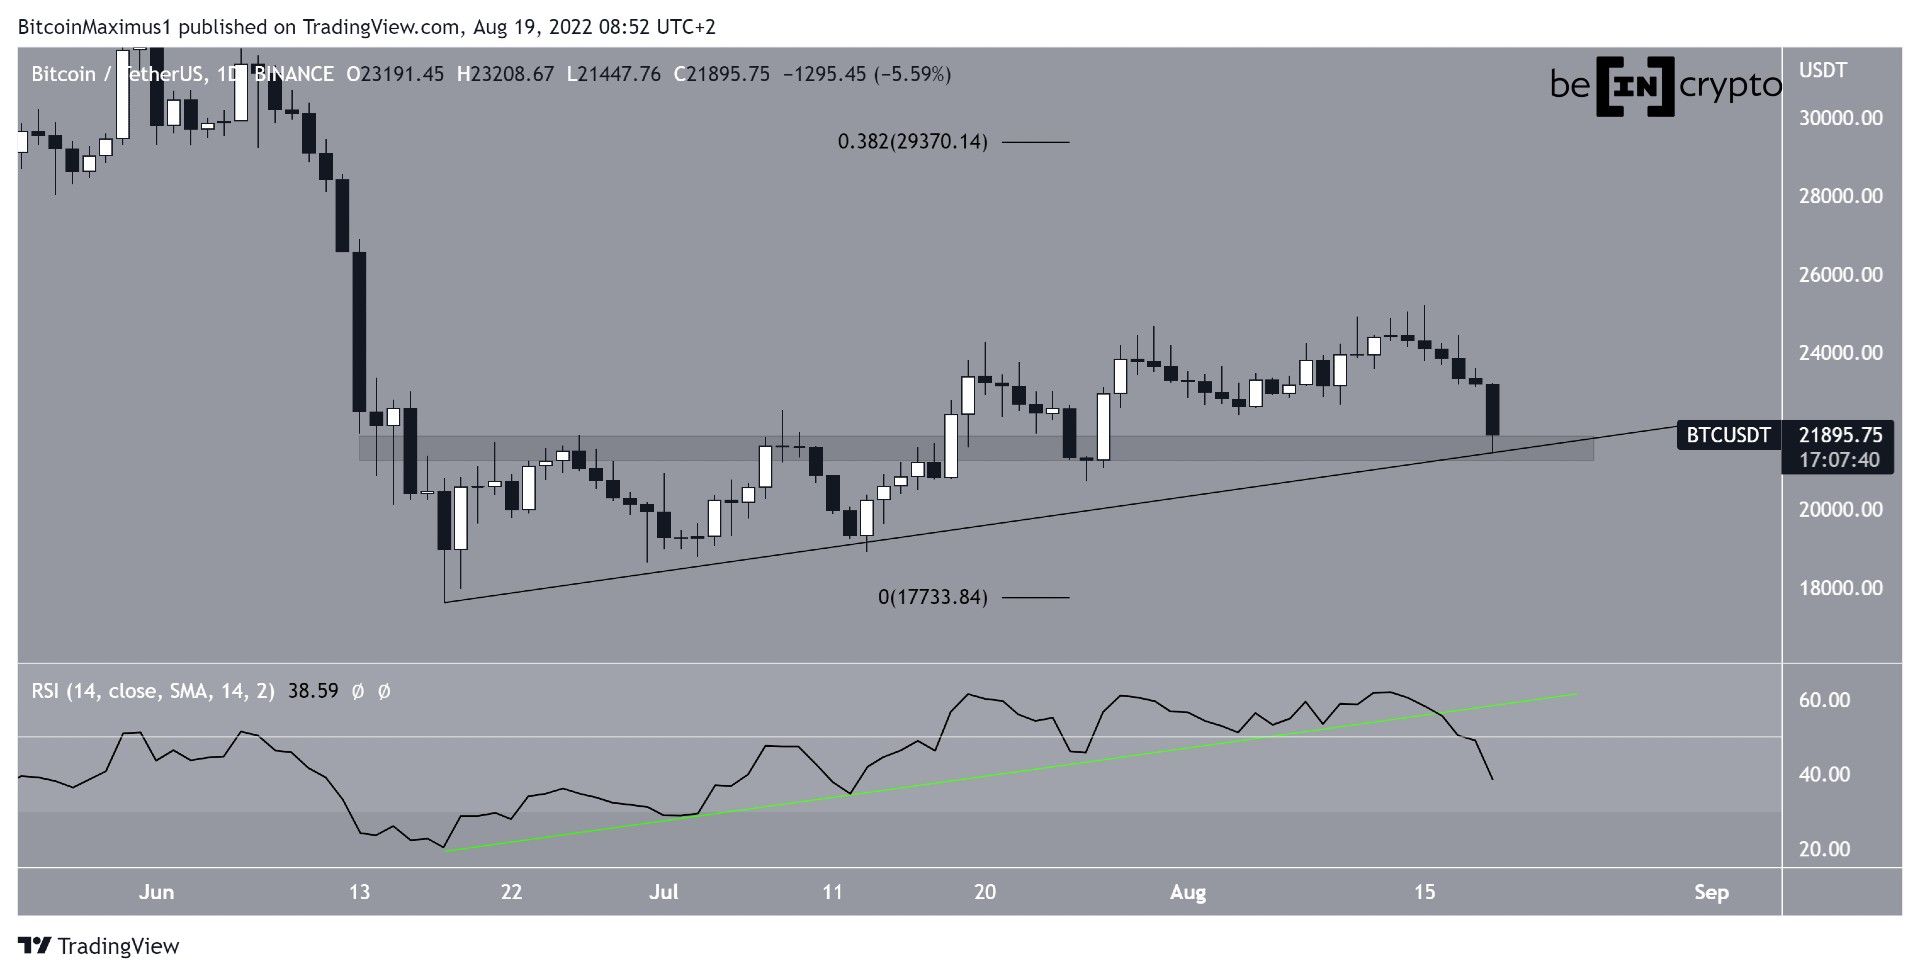
Bitcoin (BTC) reached a local low of $21,447 on Aug. 19, continuing its ongoing decrease that began on Aug. 15.
Bitcoin had been increasing since reaching a local low of $17,622 on June 18. The upward move, however, stalled at a high of $25,211 on Aug. 12.
BTC has been moving downwards since then and is in the process of creating a large bearish candlestick. On Aug. 19, BTC dropped back to support near $21,447 and rebounded slightly.
Despite the bounce, the outlook from the daily chart looks bearish. The main reason for this is the daily RSI, which has broken down from its ascending support line (green line) that had been in place since the July 18 lows. Such breakdowns usually precede a drop in price.
If this is the case, Bitcoin would be expected to soon break down from the ascending support line.
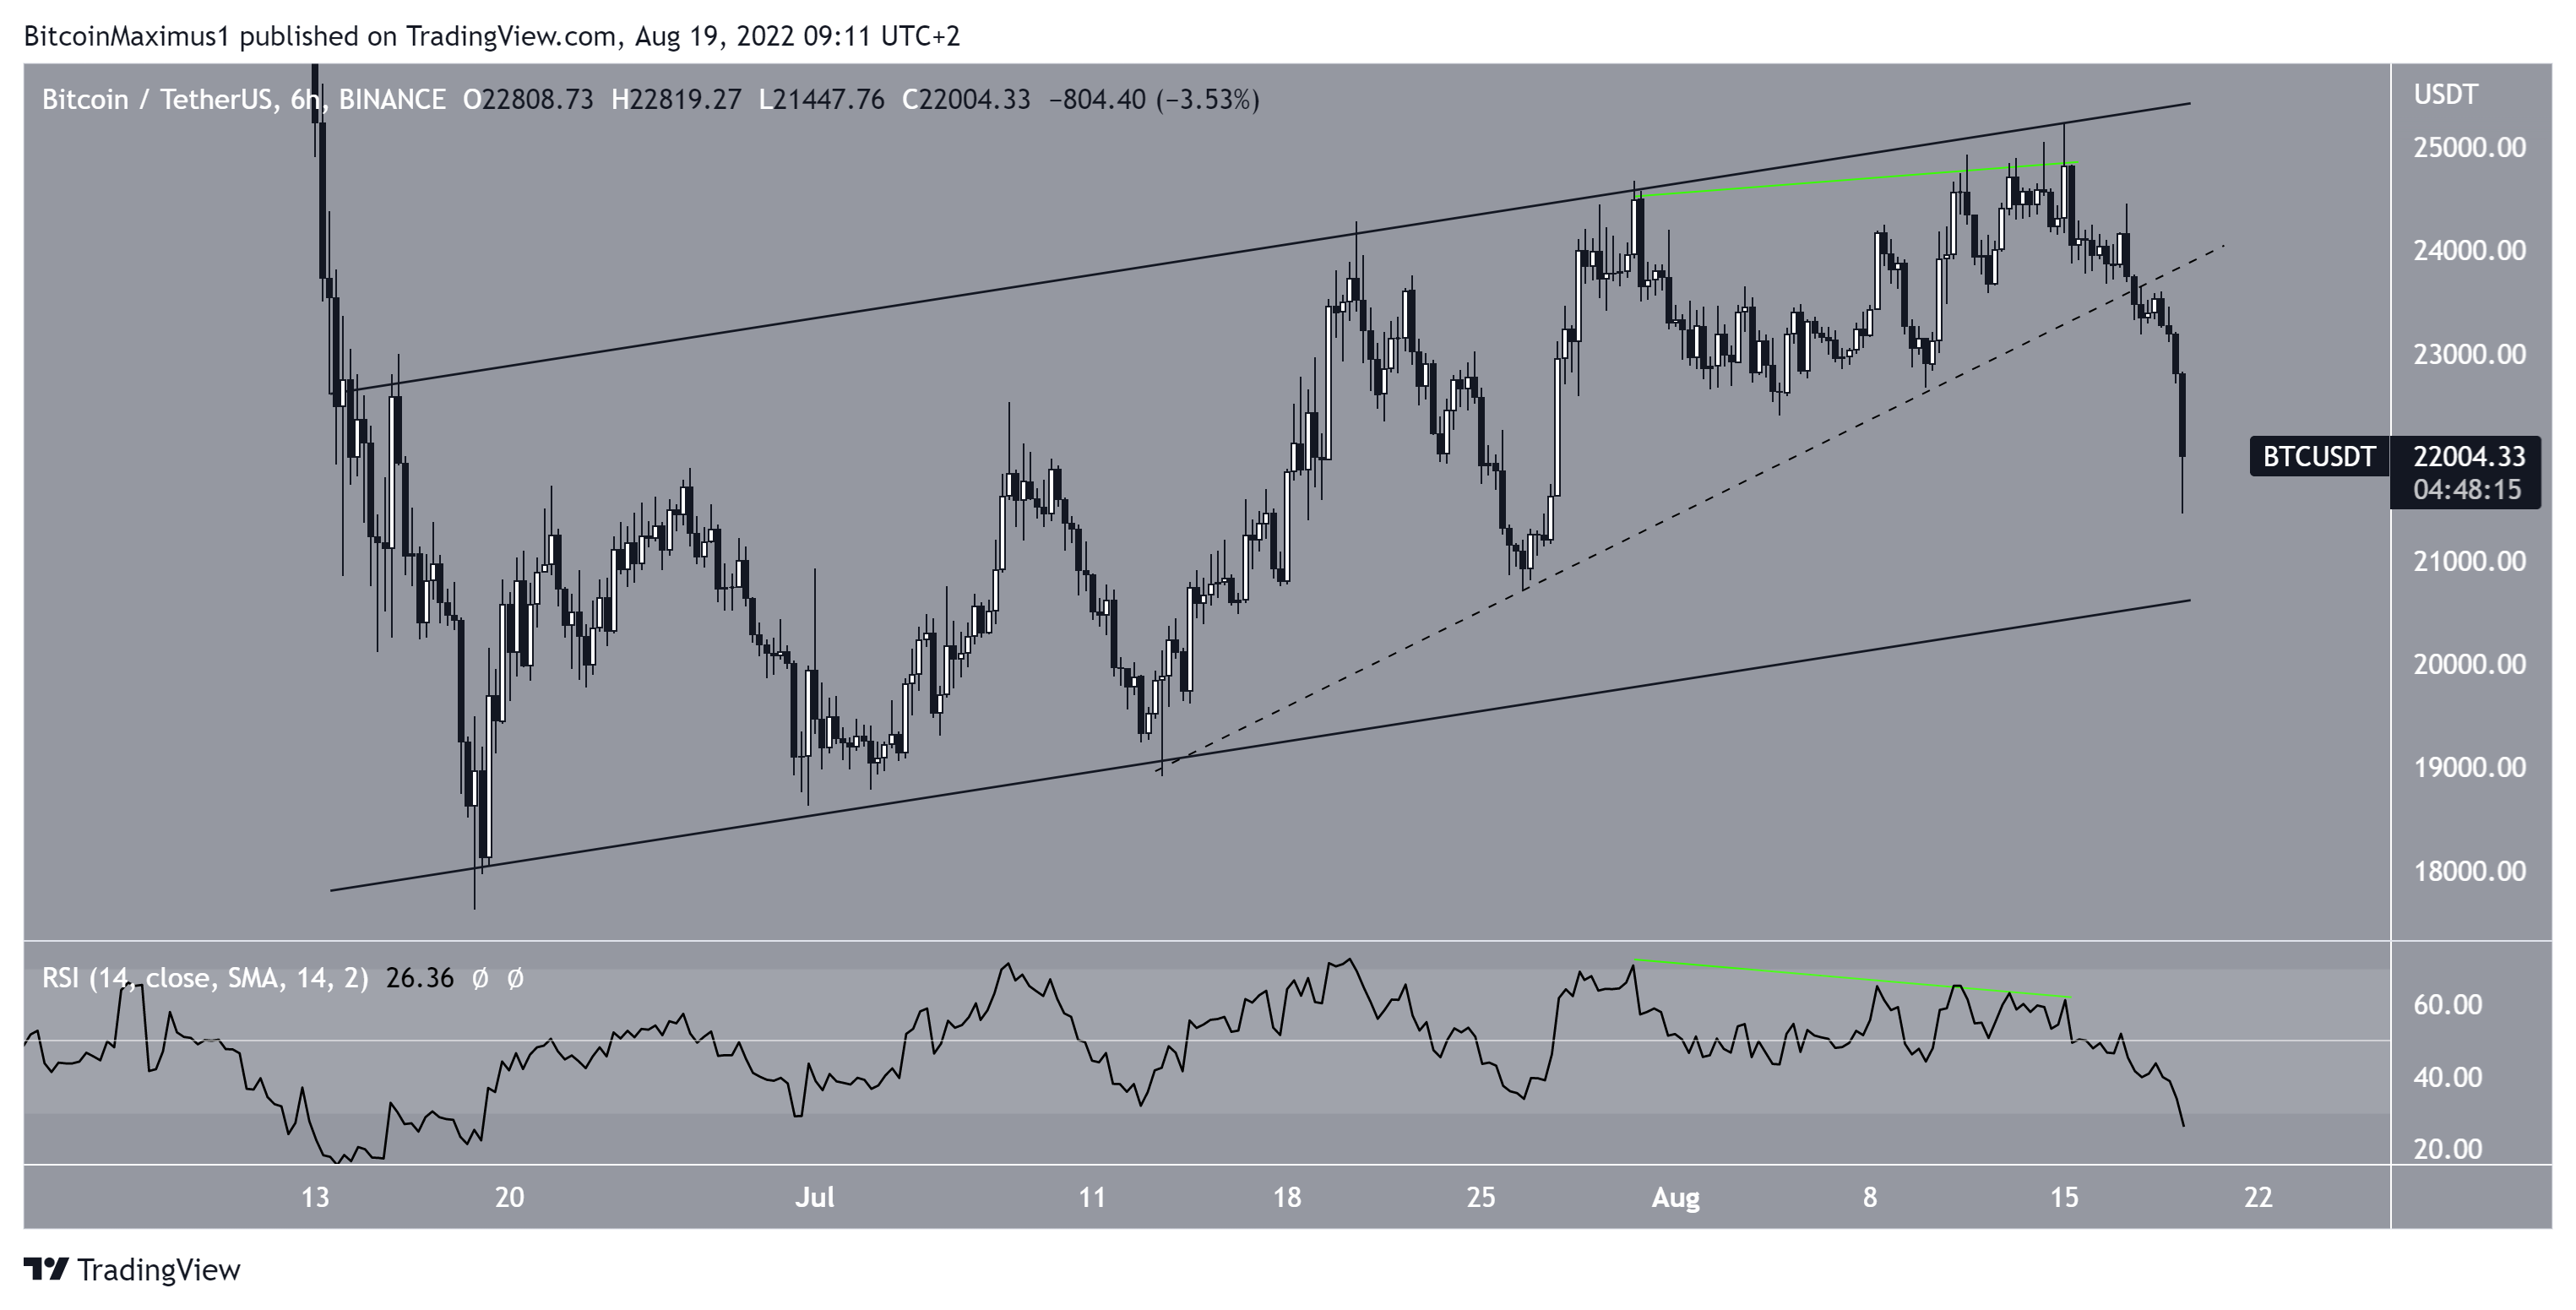
Short-term pattern
The six-hour chart shows that BTC has been trading inside an ascending parallel channel since making its June 18 low. Such channels usually contain corrective patterns, meaning that an eventual breakdown from the channel would be expected.
Bitcoin generated a bearish divergence at the resistance line of this pattern on Aug. 15 and has been decreasing since. It also broke down from a short-term ascending support line shortly after.
The support line of the channel is currently found near $21,000. If BTC falls below this, it could easily lead to new 2022 lows.
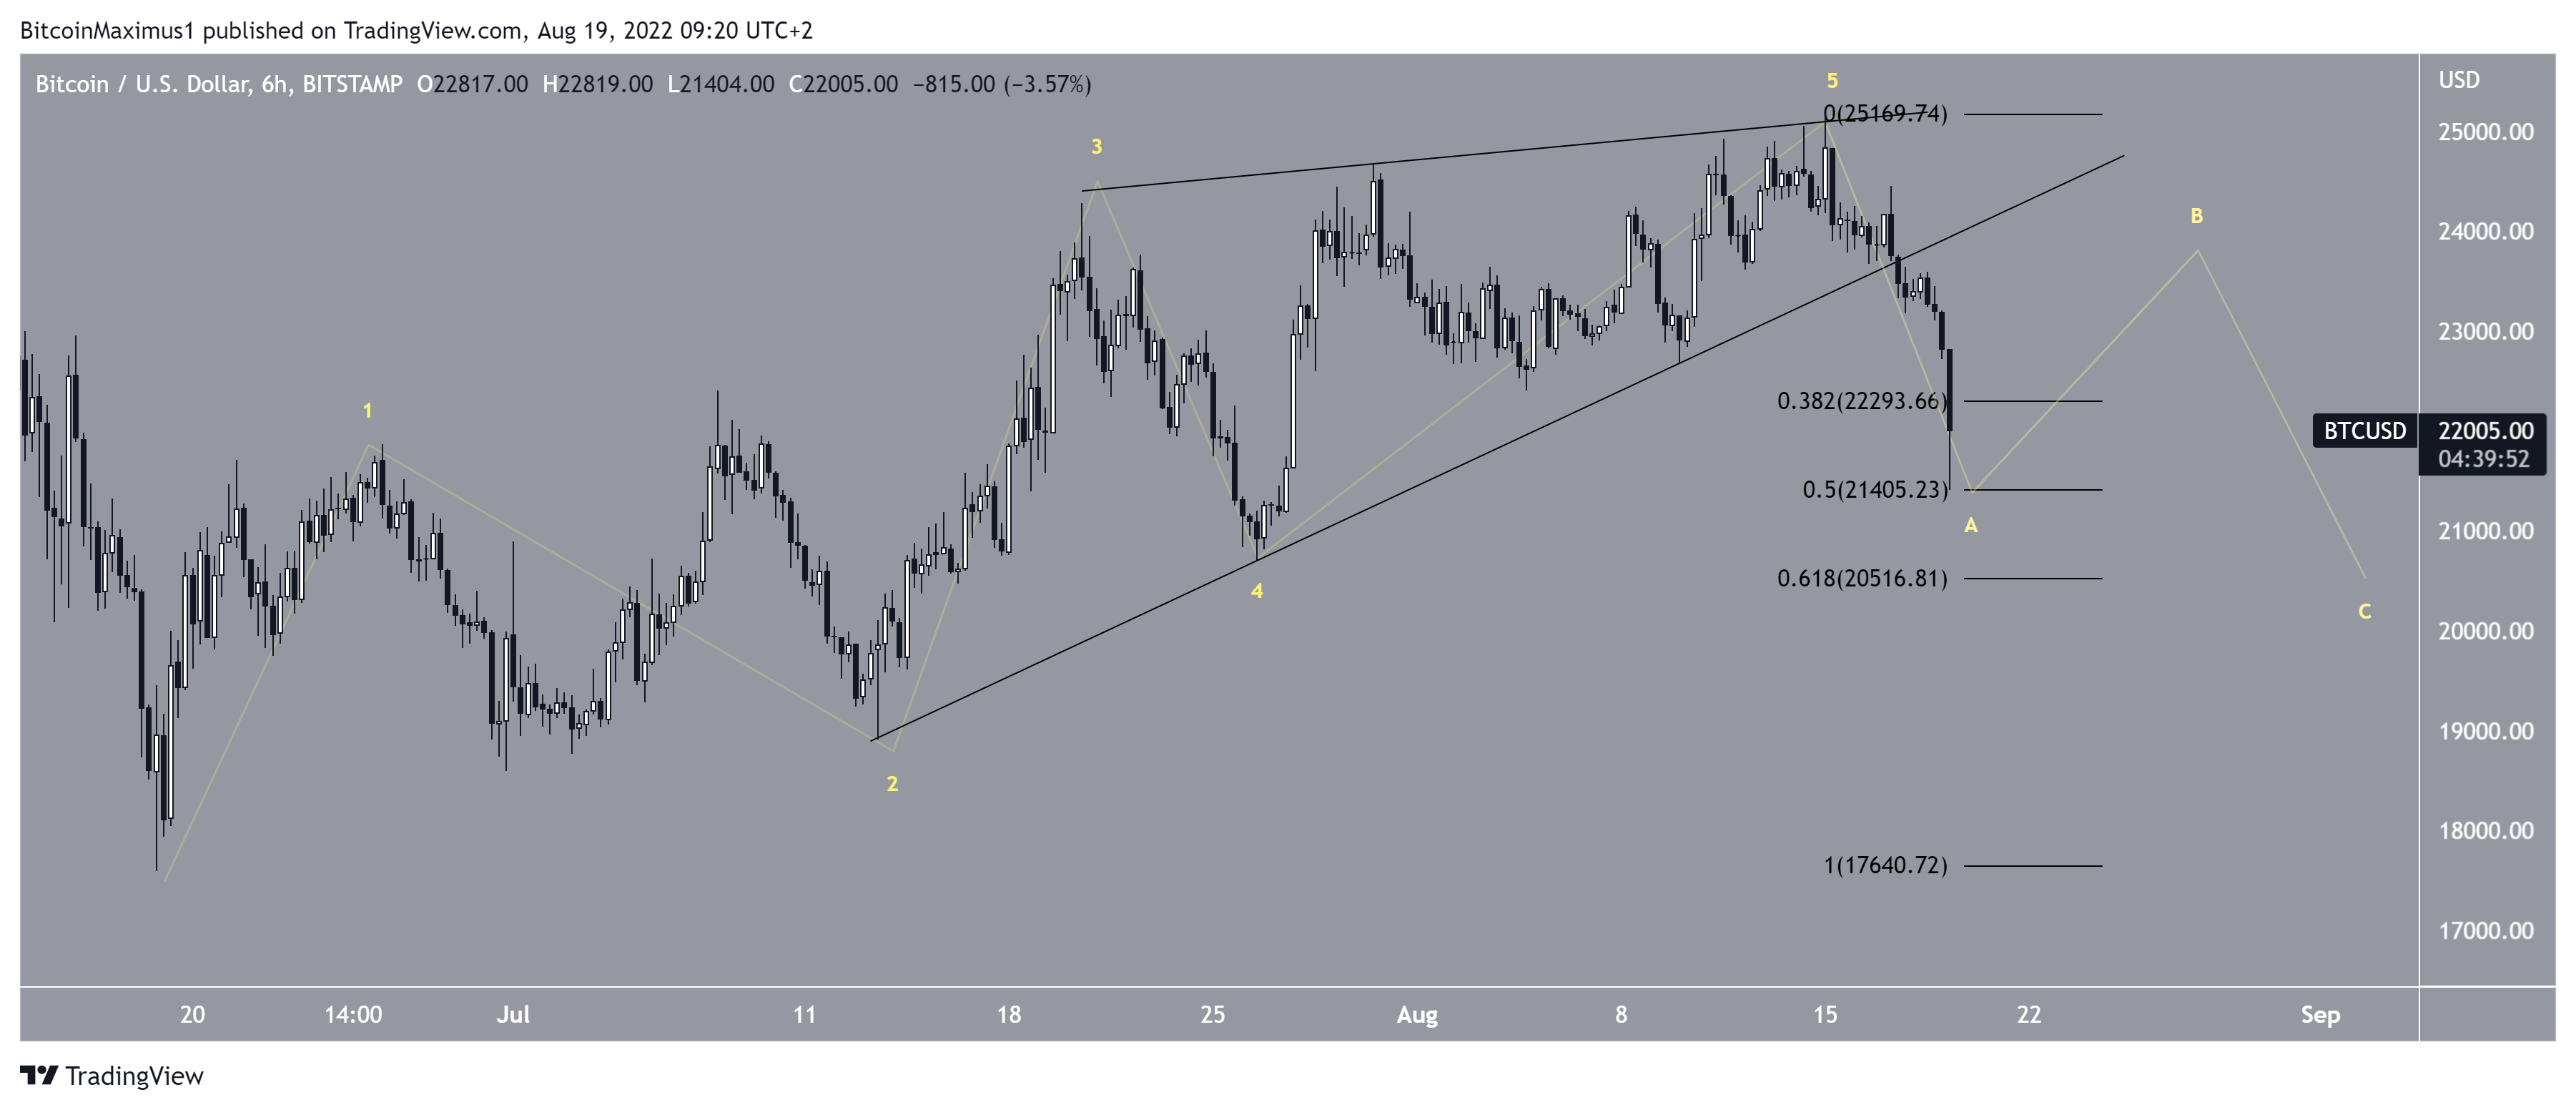
BTC wave count analysis
The most likely short-term wave count suggests that Bitcoin has completed a leading diagonal, thus the shape of the ascending wedge and breakdown that followed. The breakdown from the wedge suggests that this is part of the A wave of an A-B-C corrective structure.
BTC recently dropped back to the 0.5 Fib retracement support level at $21,400 and bounced. The most likely scenario for the future trend is that Bitcoin will now correct in the B wave before another eventual retracement.
The most likely long-term wave count still suggests that a bottom has already been reached.
For Be[in]Crypto’s previous Bitcoin (BTC) analysis, click here
