


After failing to do so for two weeks, Bitcoin (BTC) has finally broken out above the $51,200 resistance area.
Technical indicators are turning bullish and BTC is gradually increasing towards the next resistance area at $57,250.
BTC breaks out
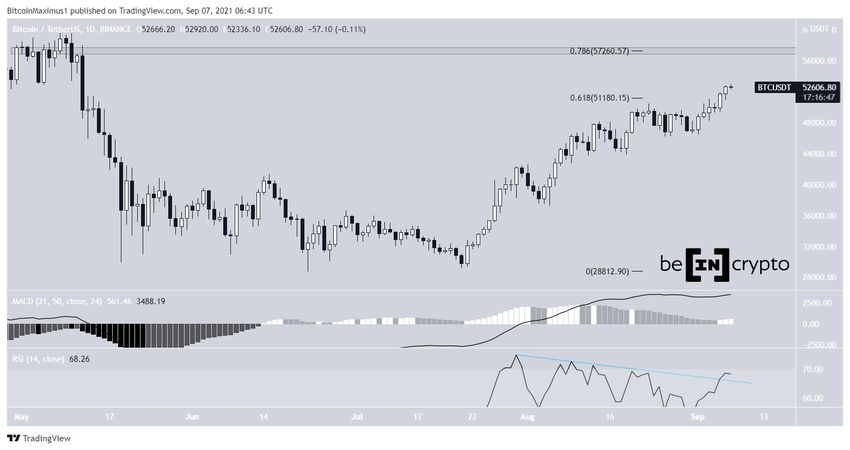
On Aug 23, BTC reached a high of $50,500. However, it was rejected by the 0.618 Fib retracement resistance level and created a shooting star candlestick.
After consolidating for nine days, BTC began an upward movement and moved above this area on Sept 5. So far, it has reached a high of $52,920 on Sept 7.
Technical indicators are bullish. While the RSI had previously generated a considerable bearish divergence, its trendline has now been broken. Furthermore, the MACD has created two successive higher momentum bars.
The closest resistance is found at $57,250. This is both a horizontal resistance area and the 0.786 Fib retracement resistance level.
Future movement
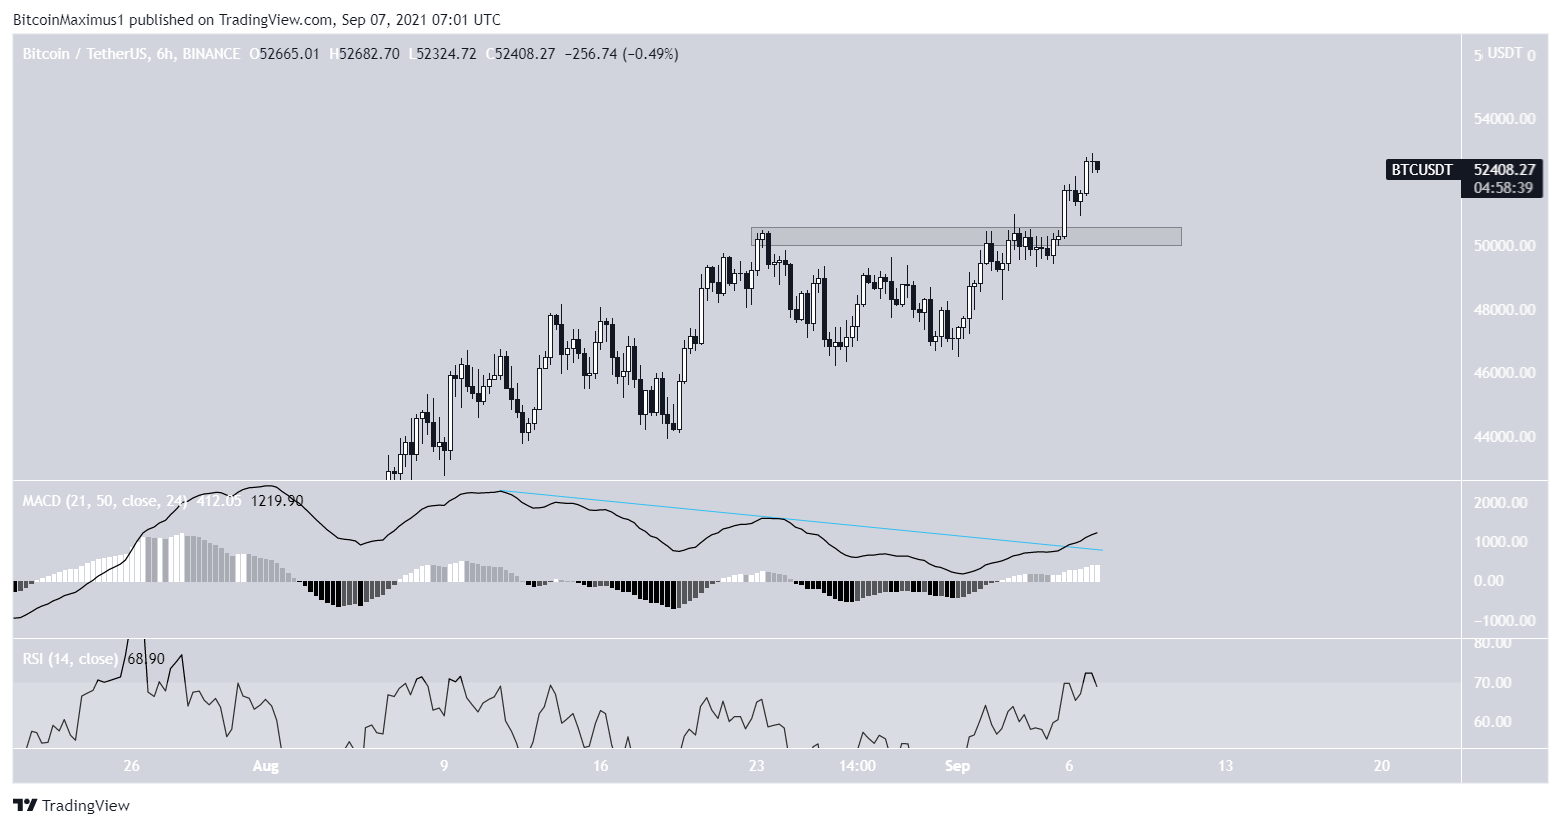
A look at lower timeframes shows that the $50,500 area is now likely to act as support since it acted as resistance prior to the breakout.
Similar to the daily time frame, the six-hour chart shows a breakout of the bearish divergence trendline, this time in the MACD instead of the RSI. The RSI has just moved above 70, which can be seen as another sign of strength.
Wave count
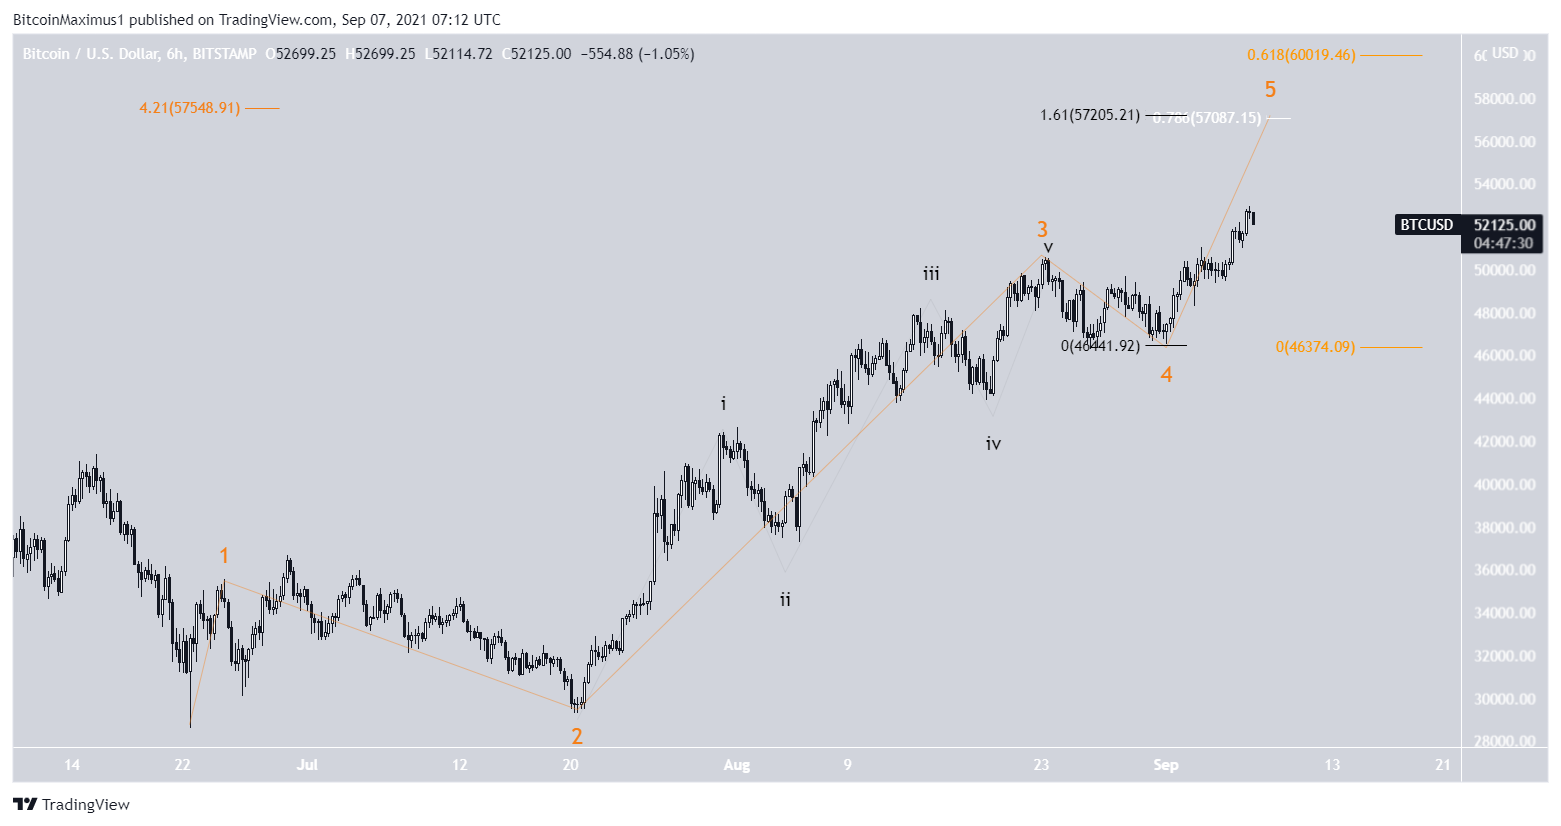
The wave count suggests that BTC is in wave five of a bullish impulse (orange). The most likely target for the top of the upward move is found near $57,100. This target is a confluence of Fib levels that include:
- 1.61 length of wave one (black)
- 4.21 extension of wave one (orange)
- 0.786 Fib retracement resistance level (white)
In BeInCrypto’s wave count analysis, we also outlined a potential corrective count. However, the short-term movement would be the same as the bullish count that is presented.
For BeInCrypto’s previous Bitcoin (BTC) analysis, click here.


