

Bitcoin (BTC) has resumed the ascent which began on Sept 7 and created a large bullish candlestick on Sept 12, reaching an important resistance area in the process.
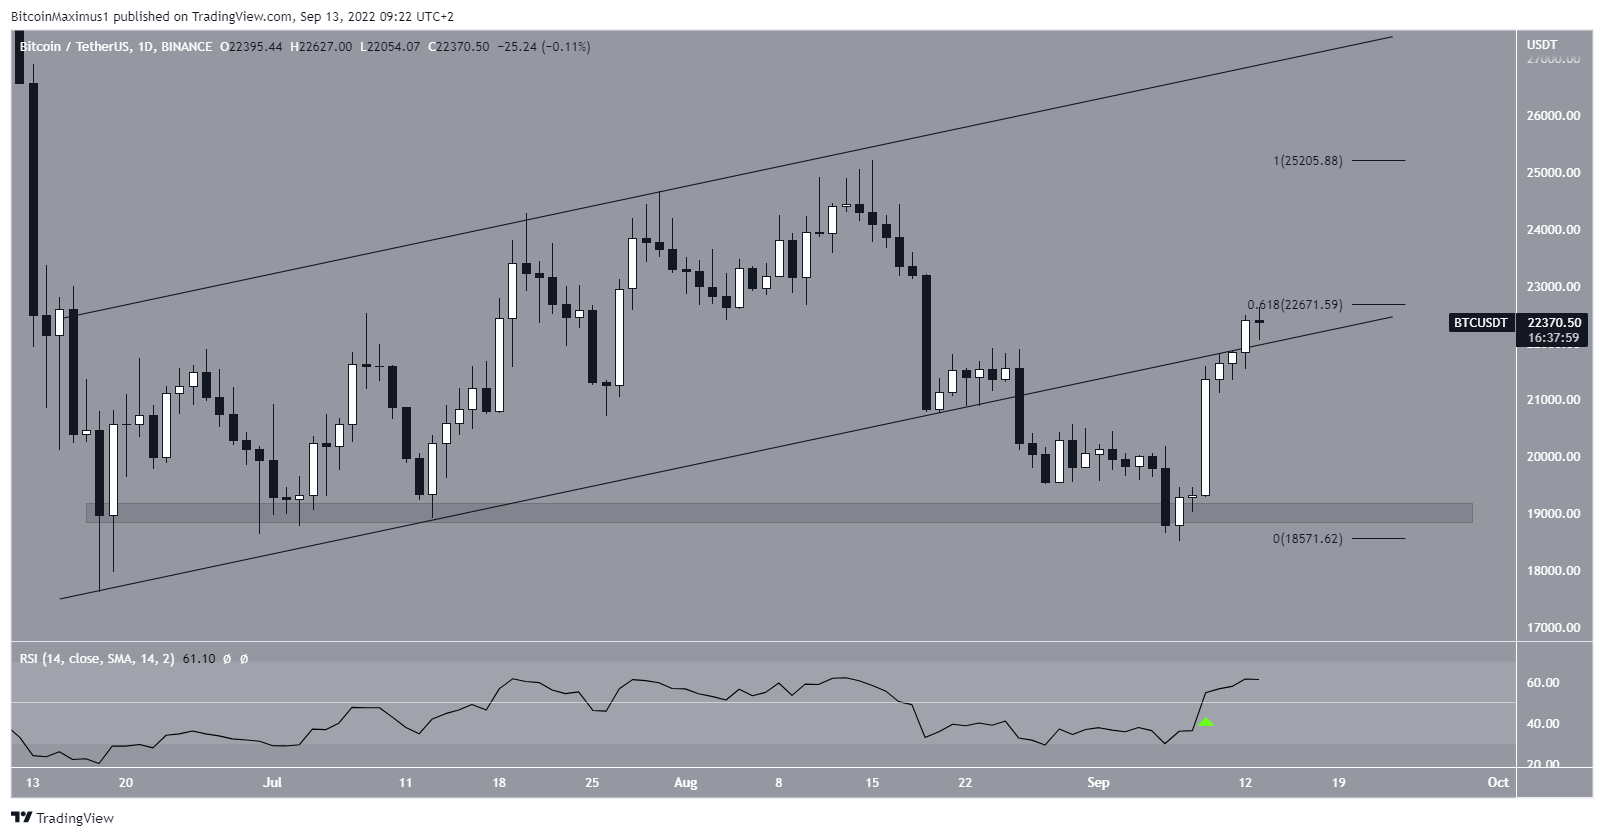
BTC has been increasing since reaching a low of $18,519 on Sept 7. The bounce and ongoing upward movement served to validate the $19,000 area as support. So far, Bitcoin has reached a high of $22,627.
Throughout this upward movement, the daily RSI has also moved above 50 (green icon). This is a sign associated with bullish trends.
Currently, it is facing resistance from the 0.618 Fib retracement resistance level at $22,670. Despite the struggle to move above this level, Bitcoin has reclaimed the support line of the previous ascending parallel channel. This is a bullish sign that suggests that the previous breakdown has likely come to an end.
Long-term bullishness
Well-known cryptocurrency trader @davthewave tweeted a chart of BTC which shows that the price is hovering inside a long-term buy area. Moreover, the monthly histogram is close to generating a bullish contraction, even though there is still time until the monthly close.
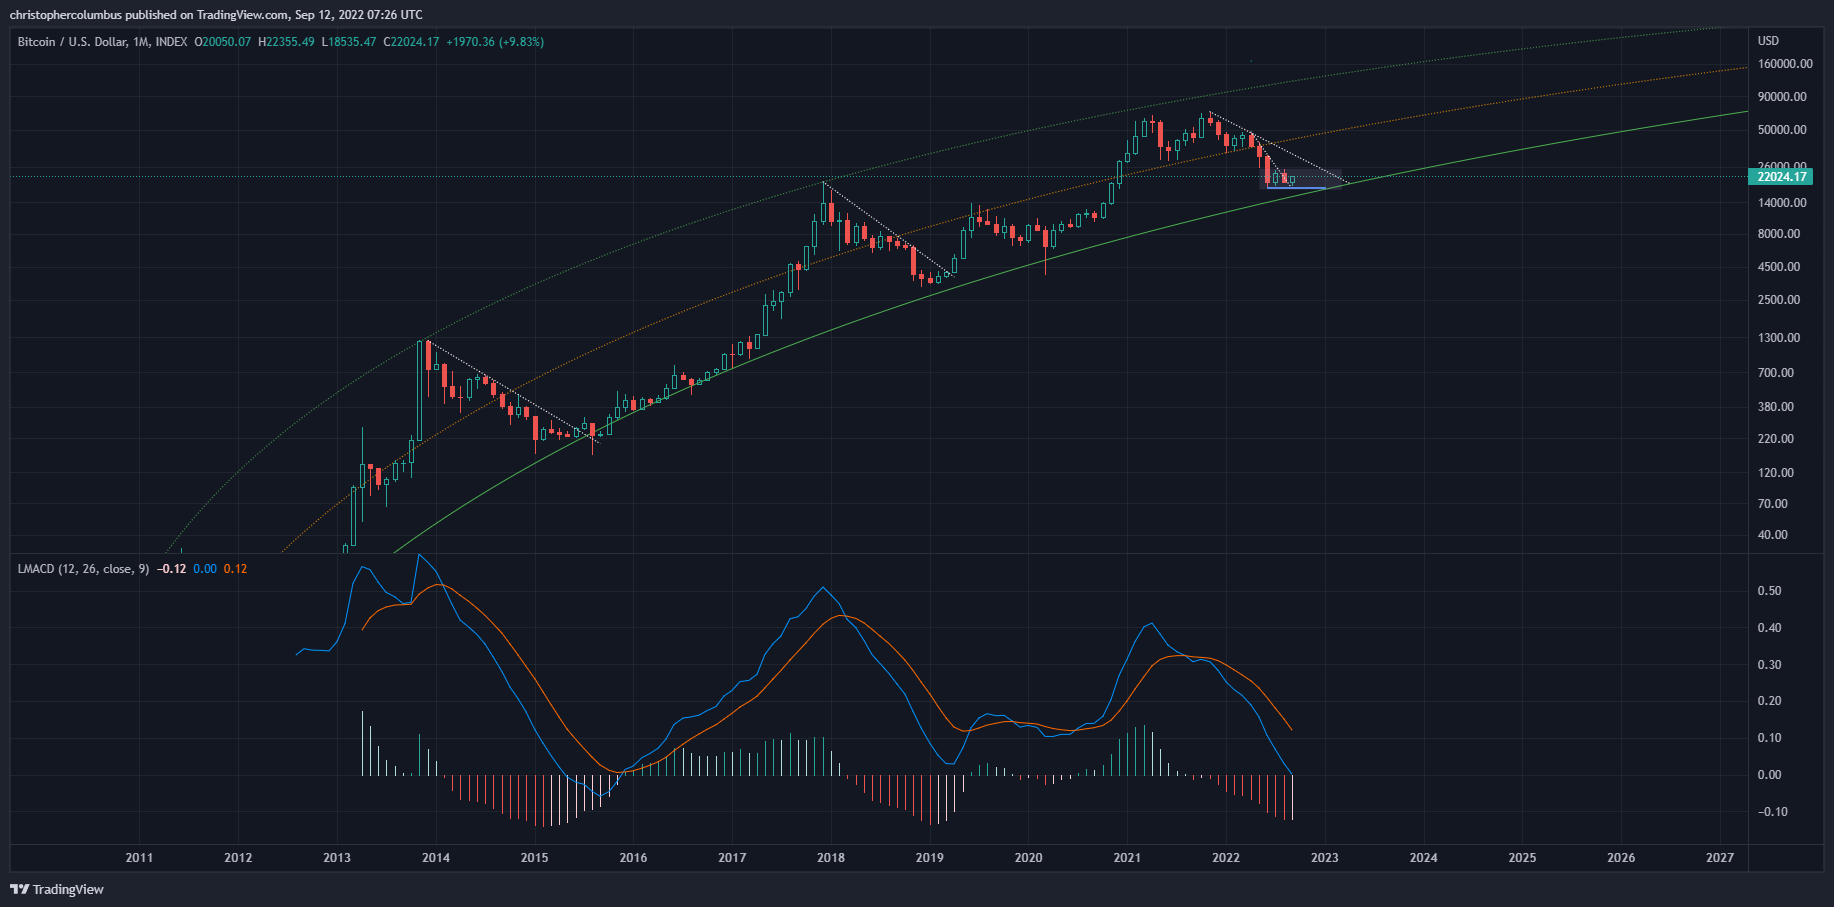
The monthly MACD histogram will close on Sept 30. Even though there are 17 days left until the close, it is very likely that the histogram will contract.
After significant periods of descent, this has only occurred thrice before (green icons):
- Jan 2015
- Feb 2019
- April 2020
In each of these times, a very significant upward movement followed, which either led to a new all-time high (2015 and 2020) or a five-fold increase in the price (2019).
BTC wave count analysis
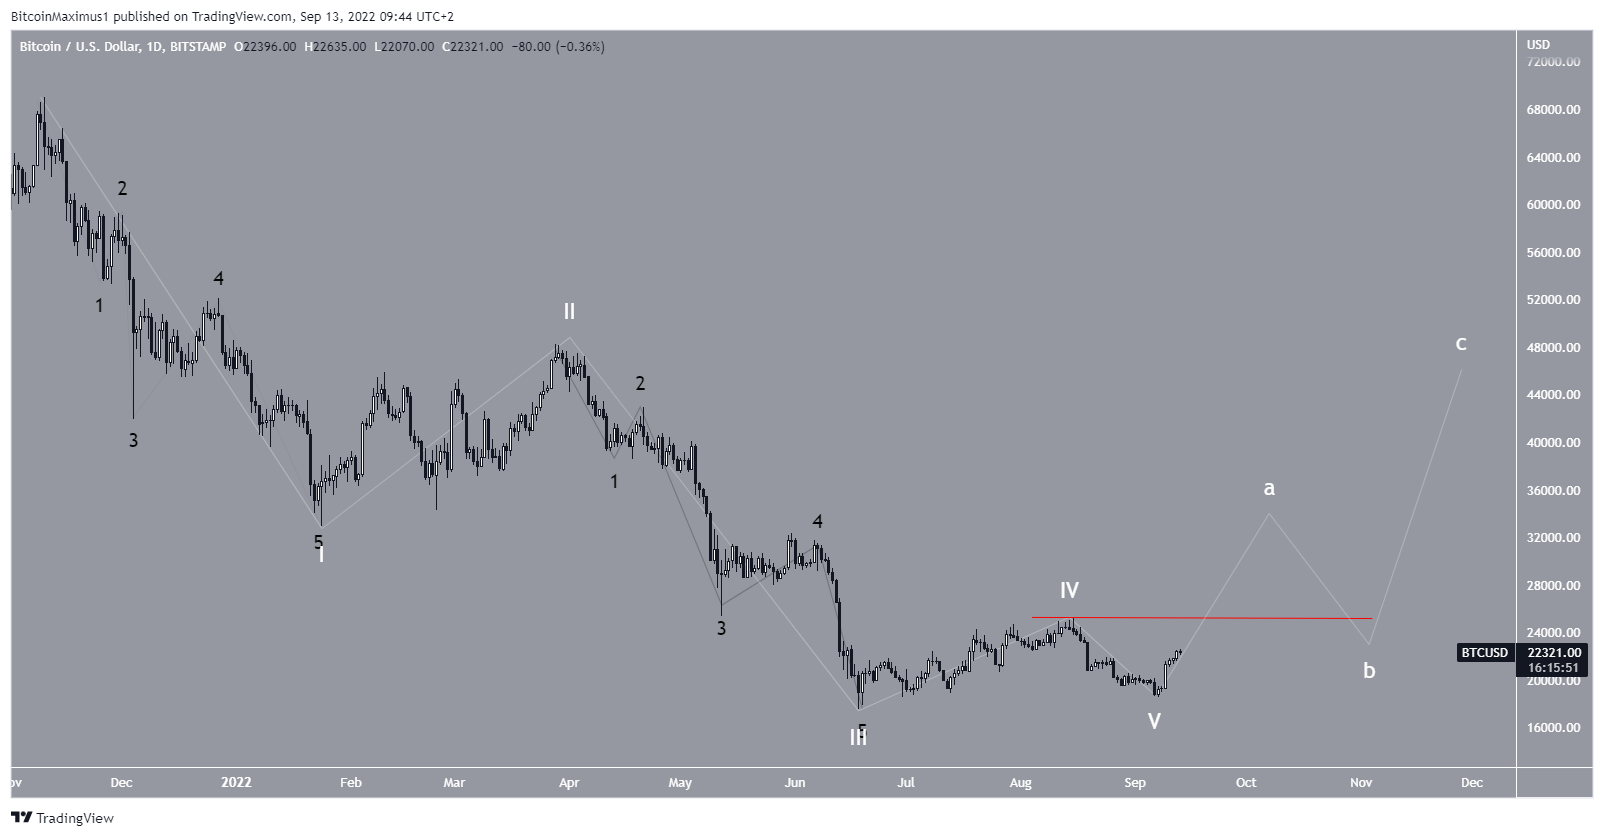
There are three main possibilities from the long-term wave count, which is found when measuring the downward movement since the all-time high.
The first one suggests that Bitcoin has completed a five-wave downward movement (white), in which wave five was truncated.
If correct, it would mean that the price has now begun an A-B-C corrective structure that is likely to take it above $30,000.
However, another downward movement towards new lows would follow afterward. The upward movement would be confirmed with an increase above $25,200 (red line), the highs of Aug 15.
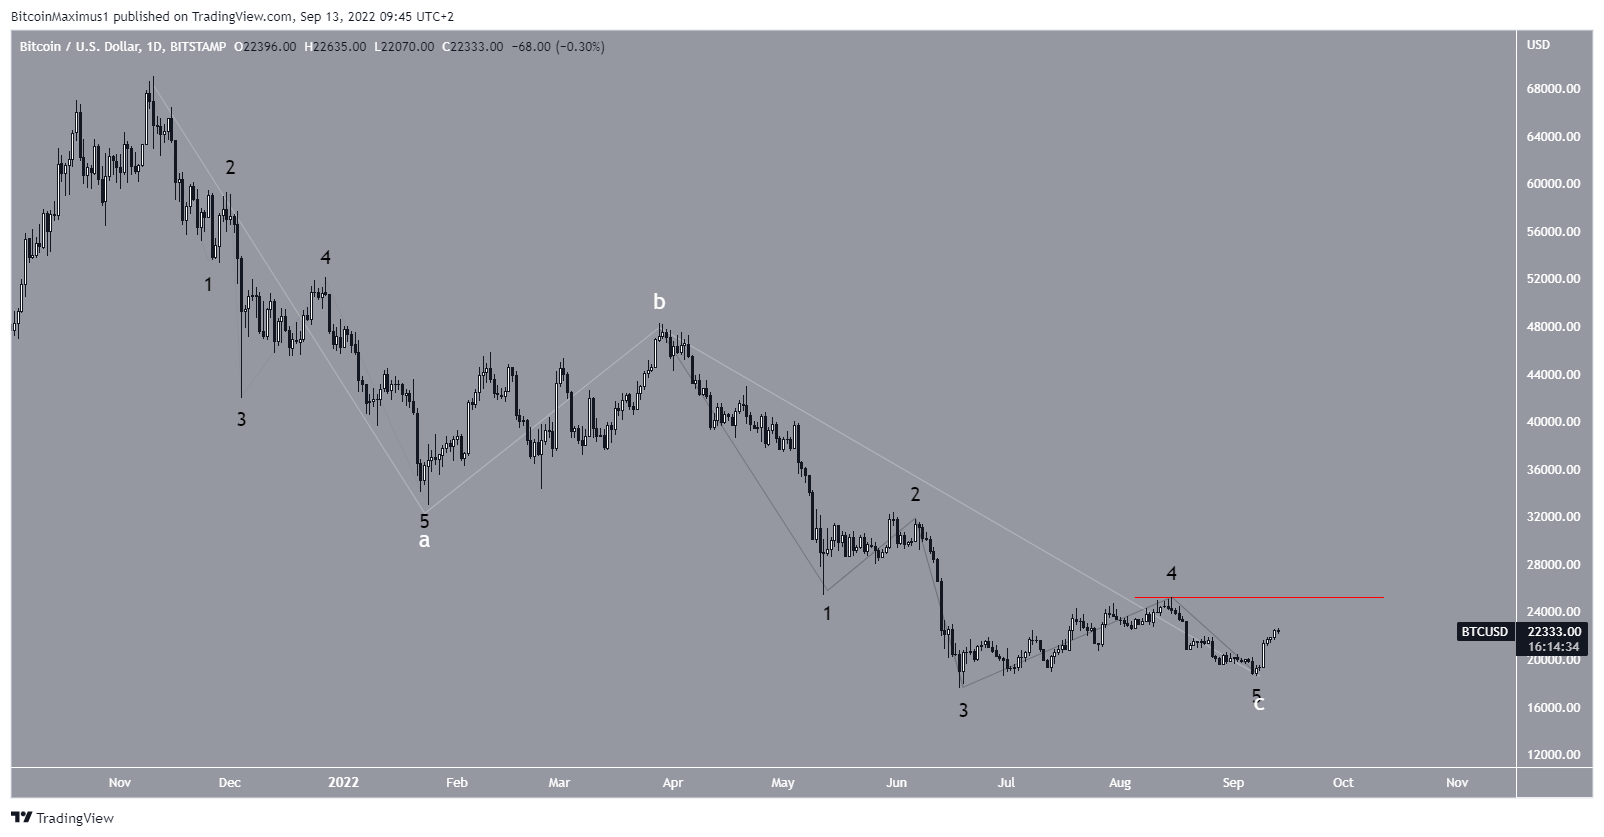
The second count is similar but implies that BTC has completed an A-B-C corrective structure instead (white), in which sub-wave five (black) was truncated.
While the ensuing movement would be similar to the previous count, the price would have begun a new bullish reversal in this case, meaning that it would take it towards new highs.
Similarly, the upward movement would be confirmed by an increase above $25,200.
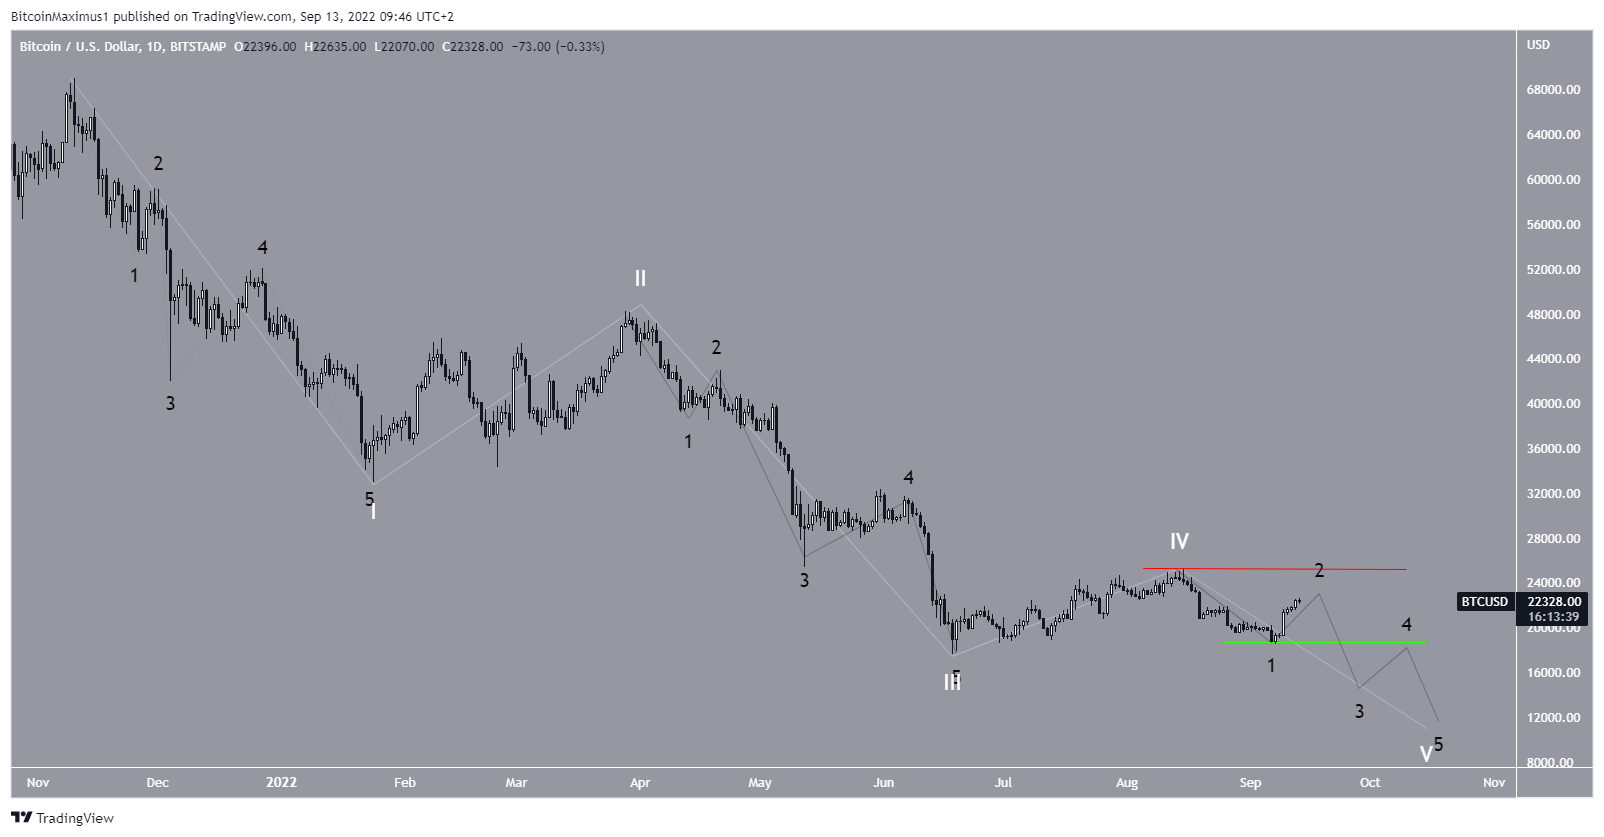
Finally, the third potential count is bearish. It is similar to the first one, but suggests that Bitcoin is still in wave five (white). However, the count is looking less likely due to the shape of the ongoing increase, which has been rapid.
An increase above $25,200 (red line) would invalidate this count while a decrease below $18,500 (green line) would confirm it.
For Be[in]Crypto’s previous Bitcoin (BTC) analysis, click here
Disclaimer
In line with the Trust Project guidelines, this price analysis article is for informational purposes only and should not be considered financial or investment advice. BeInCrypto is committed to accurate, unbiased reporting, but market conditions are subject to change without notice. Always conduct your own research and consult with a professional before making any financial decisions. Please note that our Terms and Conditions, Privacy Policy, and Disclaimers have been updated.
