
Bitcoin (BTC) decreased considerably on Aug 30, reaching a close of $46,892. This was nearly $2,000 below the opening price of $48,787.
It initially broke down from an ascending support line and followed that up with a breakdown from a descending parallel channel.
BTC hangs below resistance
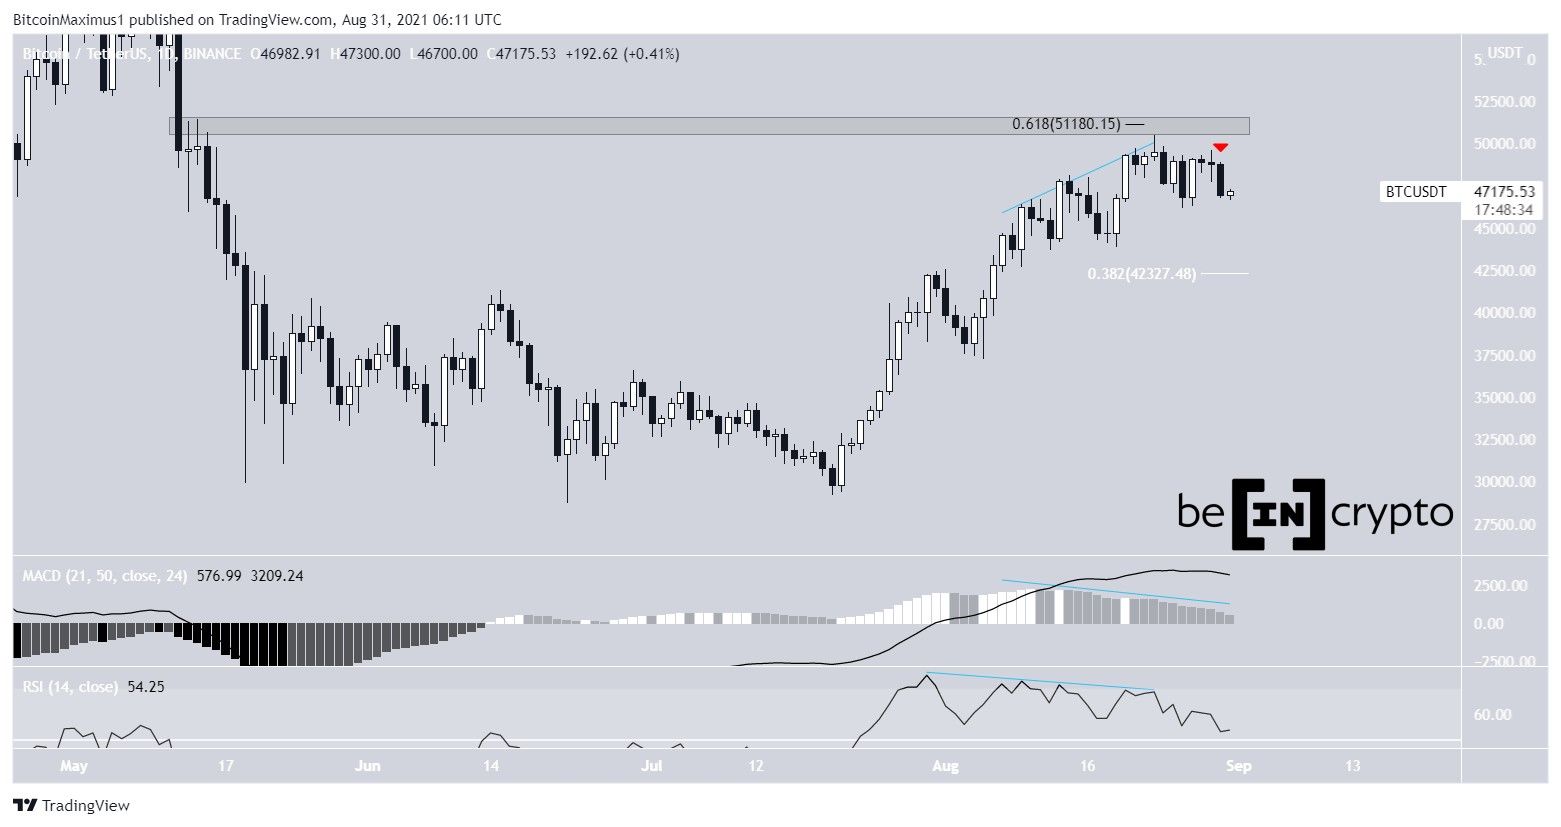
BTC has been moving downwards since Aug 22, after it reached a high of $50,500. The high was reached very close to the $51,200 resistance area, which is the 0.618 Fib retracement resistance level and horizontal resistance area. The same day, it created a shooting star candlestick.
The ongoing decrease was preceded by significant bearish divergences in both the RSI and MACD. On the other hand, there is a potential hidden bullish divergence developing, but that would be invalidated with a close below the $46,348 low of Aug 26.
Yesterday’s bearish candlestick can be seen as a considerable sign of weakness.
Unless BTC manages to reclaim the $51,200 resistance area, the trend cannot be considered bullish.
The closest support area is found at $42,400. This is the 0.382 Fib retracement support level (white).
Future movement
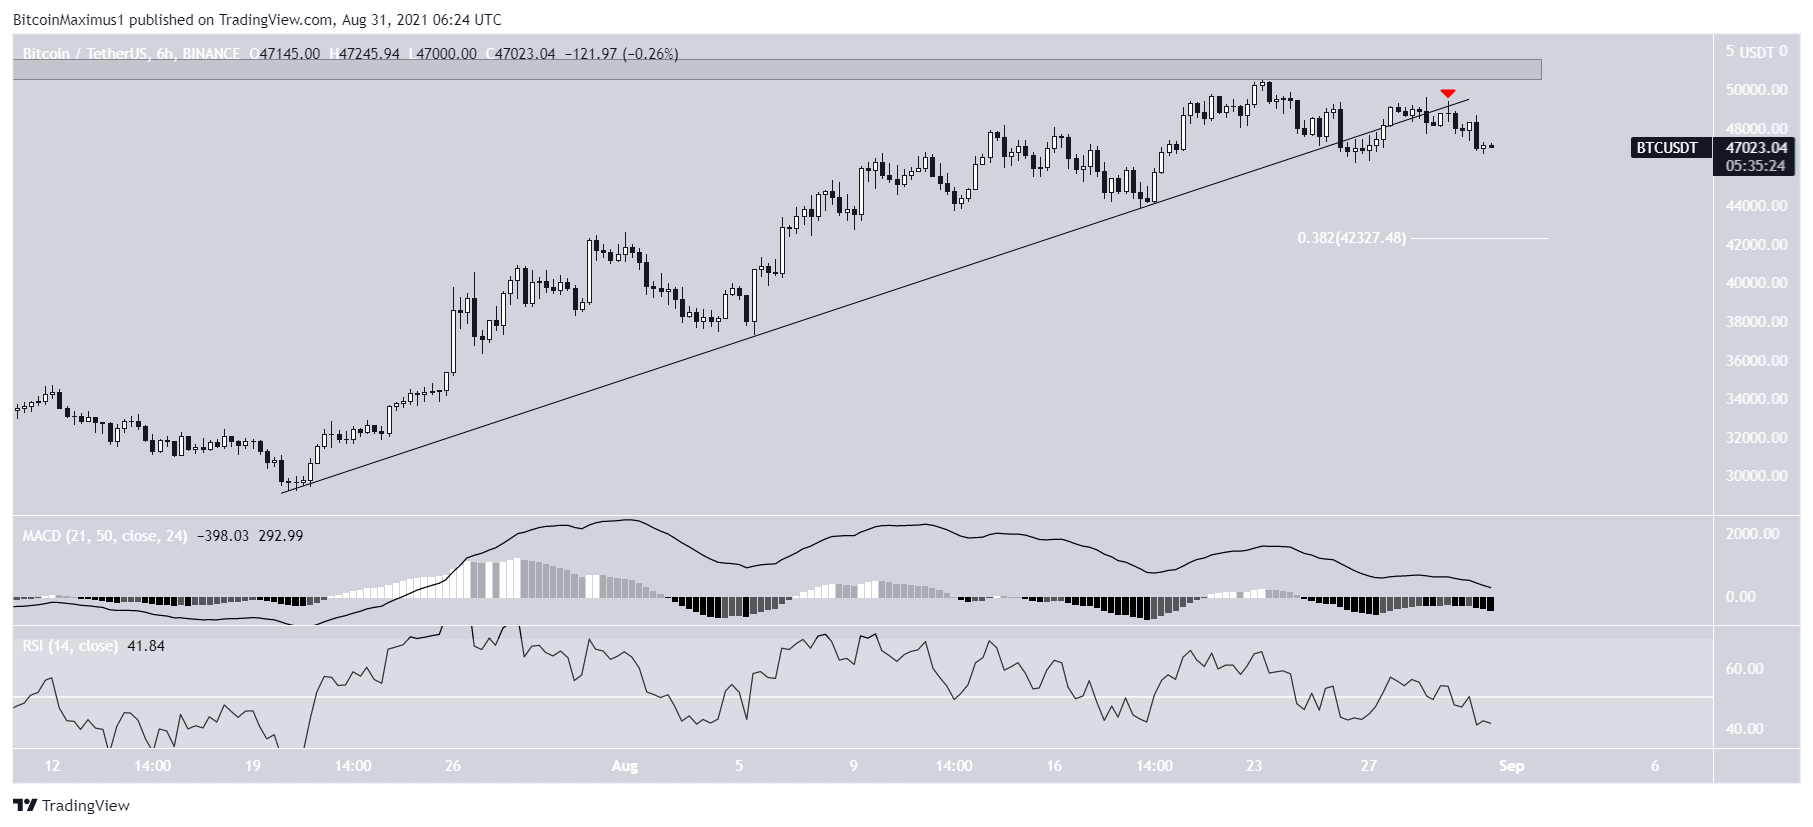
The six-hour chart supports the possibility that BTC will move downwards. It appears to have broken down from an ascending support line and validated it as resistance (red icon).
The MACD and RSI support the continuation of the downward movement. The former is negative while the latter is below 50.
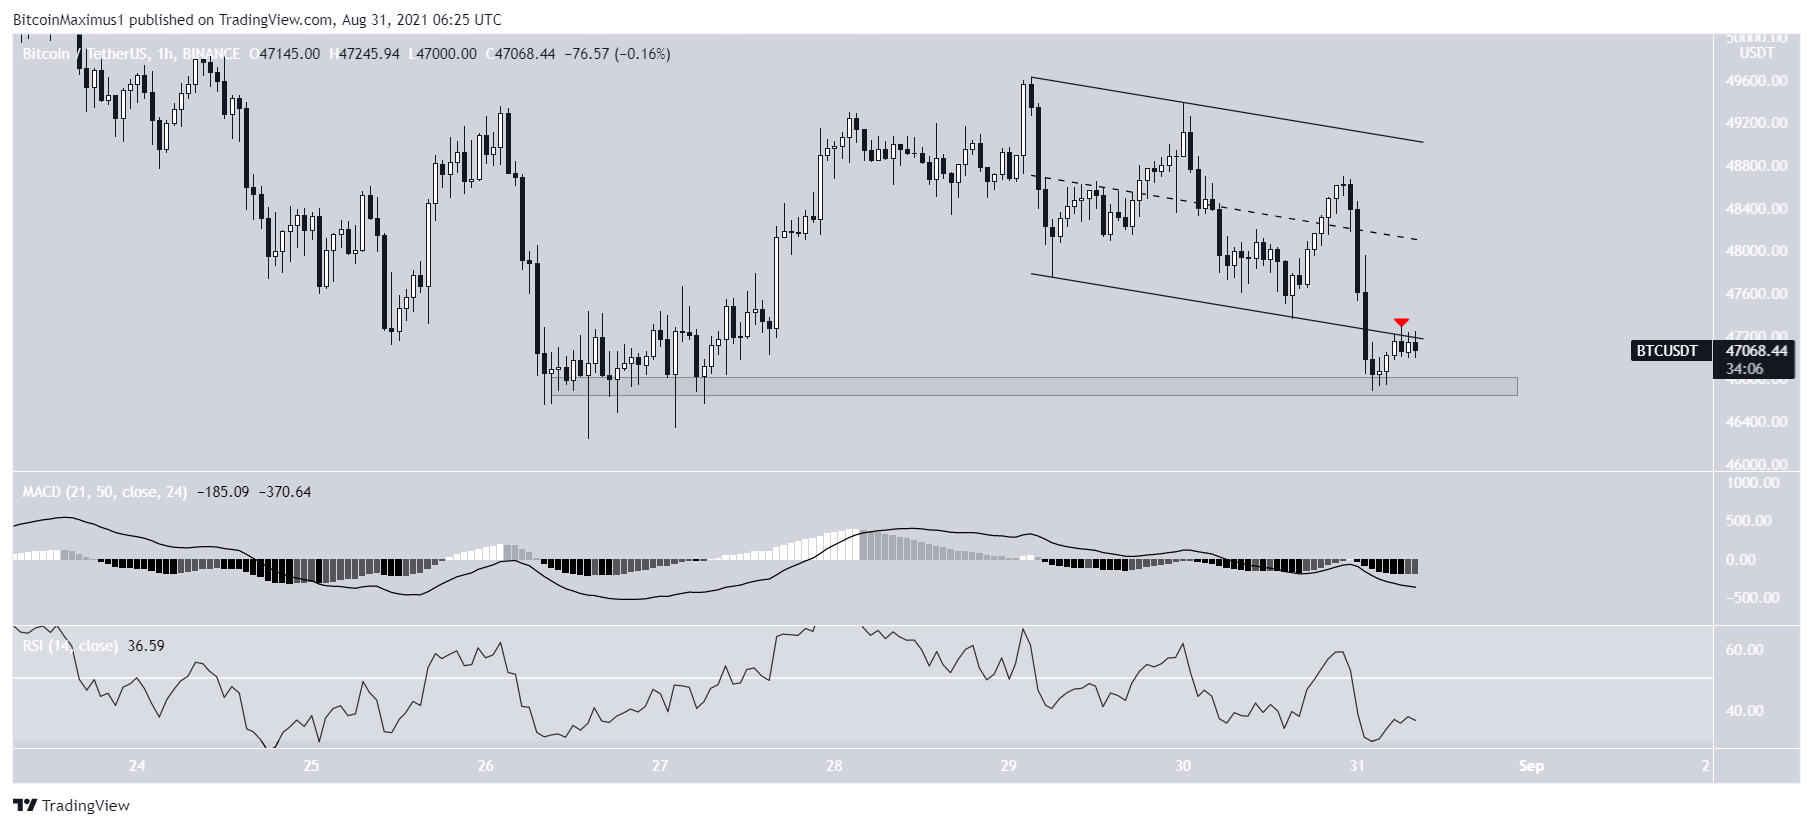
The one-hour chart shows that BTC has already broken down from a descending parallel channel and is in the process of validating it as resistance (red icon).
A breakdown below the $46,700 horizontal support area would likely trigger a sharp fall.
Wave count
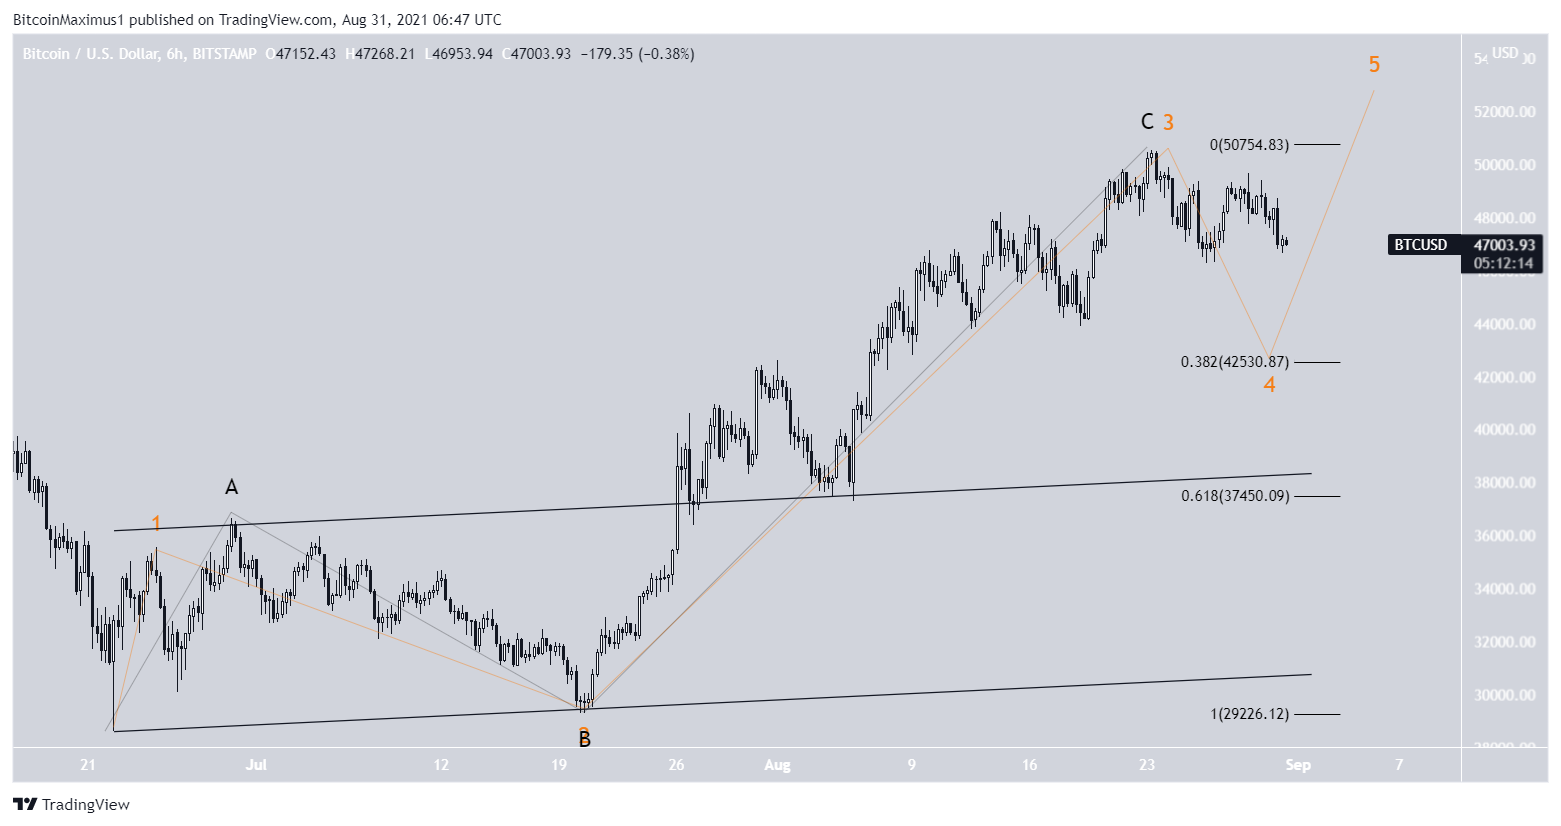
The definitive long-term wave count remains unclear. The bullish (orange) and bearish (black) counts are presented below.
Both indicate a likely short-term decrease, which could take BTC at least to the $42,400 support area.
For BeInCrypto’s latest Bitcoin (BTC) analysis, click here.
