
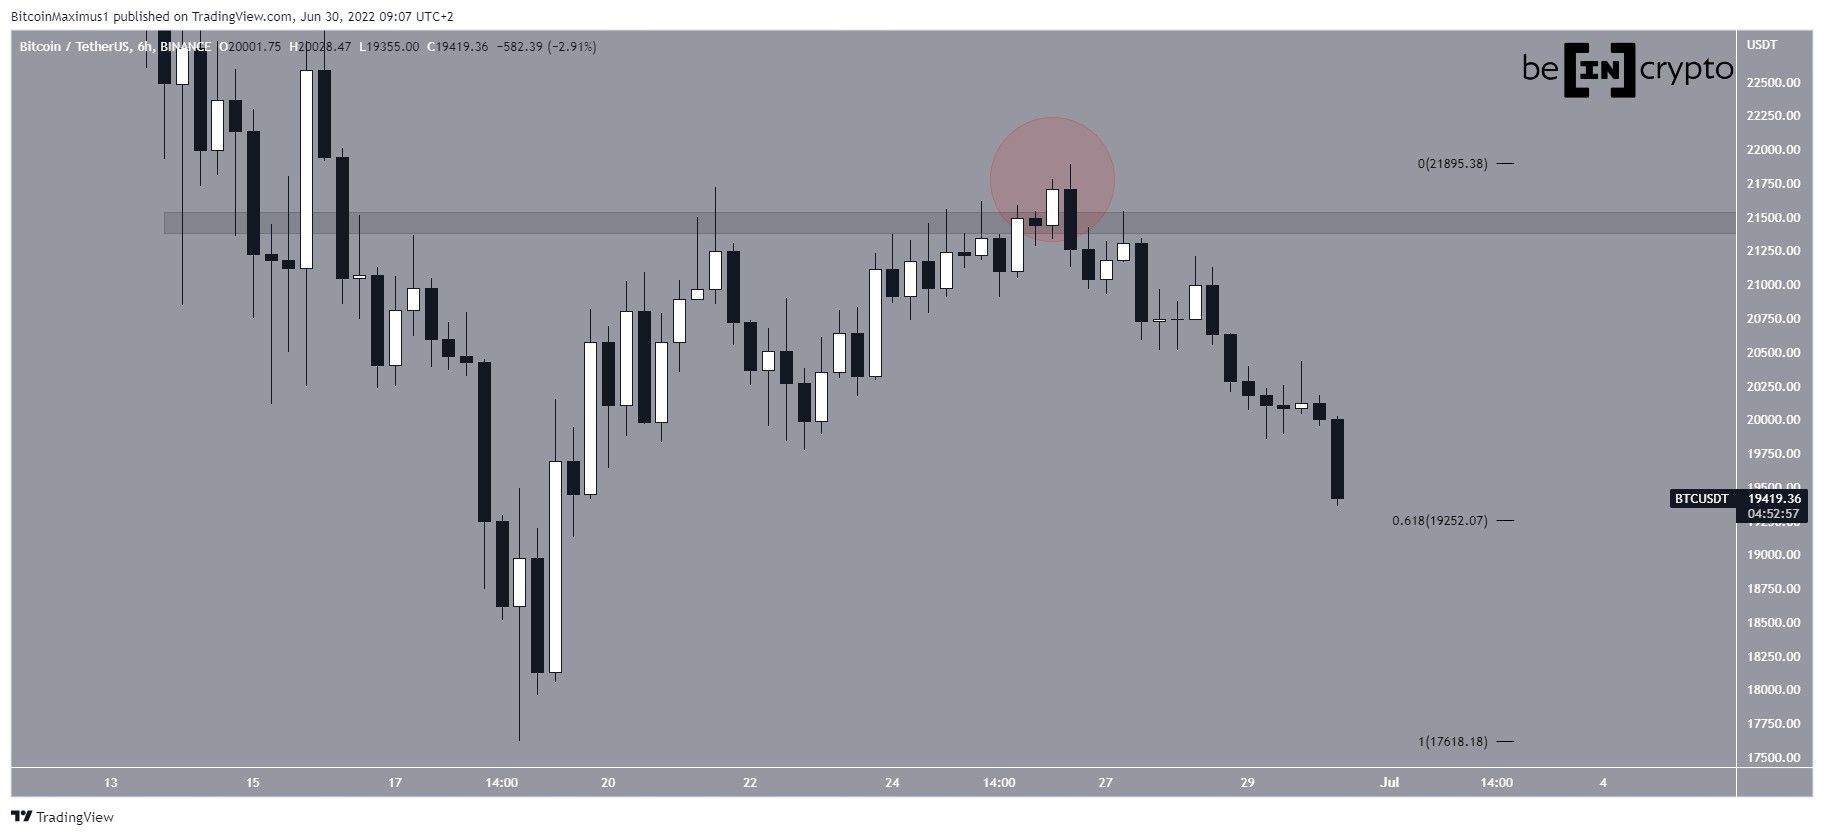
Bitcoin (BTC) is struggling to find support above the 0.618 Fib retracement support level at $19,250. If it fails to do so, it could break down below its June lows.
BTC has been falling since deviating (red circle) above the $21,450 horizontal resistance area. Such deviations often lead to sharp movements in the other direction.
So far, the price has reached a low of $19,321 on June 30. The low is very close to the 0.618 Fib retracement support level at $19,250. This is the final support level prior to the yearly lows at $17,618.
Potential breakdown
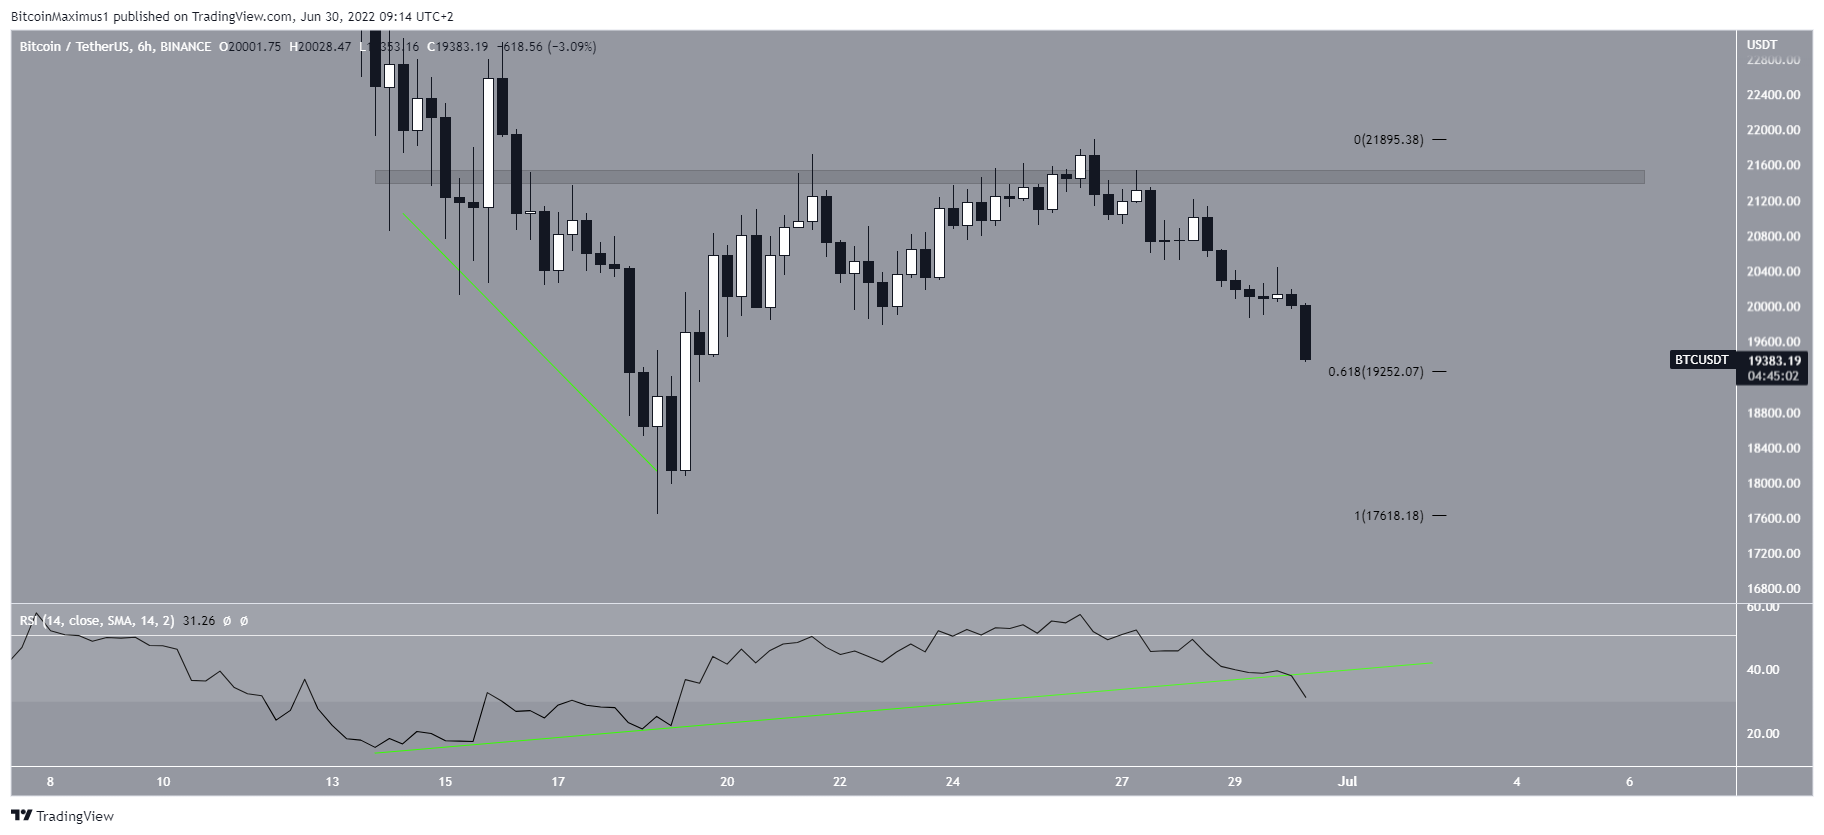
The six-hour chart provides a more bearish outlook. The reason for this is that the six-hour RSI bullish divergence trend line (green line) that was in place since June 14 has now broken down.
A breakdown from the RSI trend line usually precedes a price breakdown. So, the six-hour time frame indicates that the price is expected to head lower.
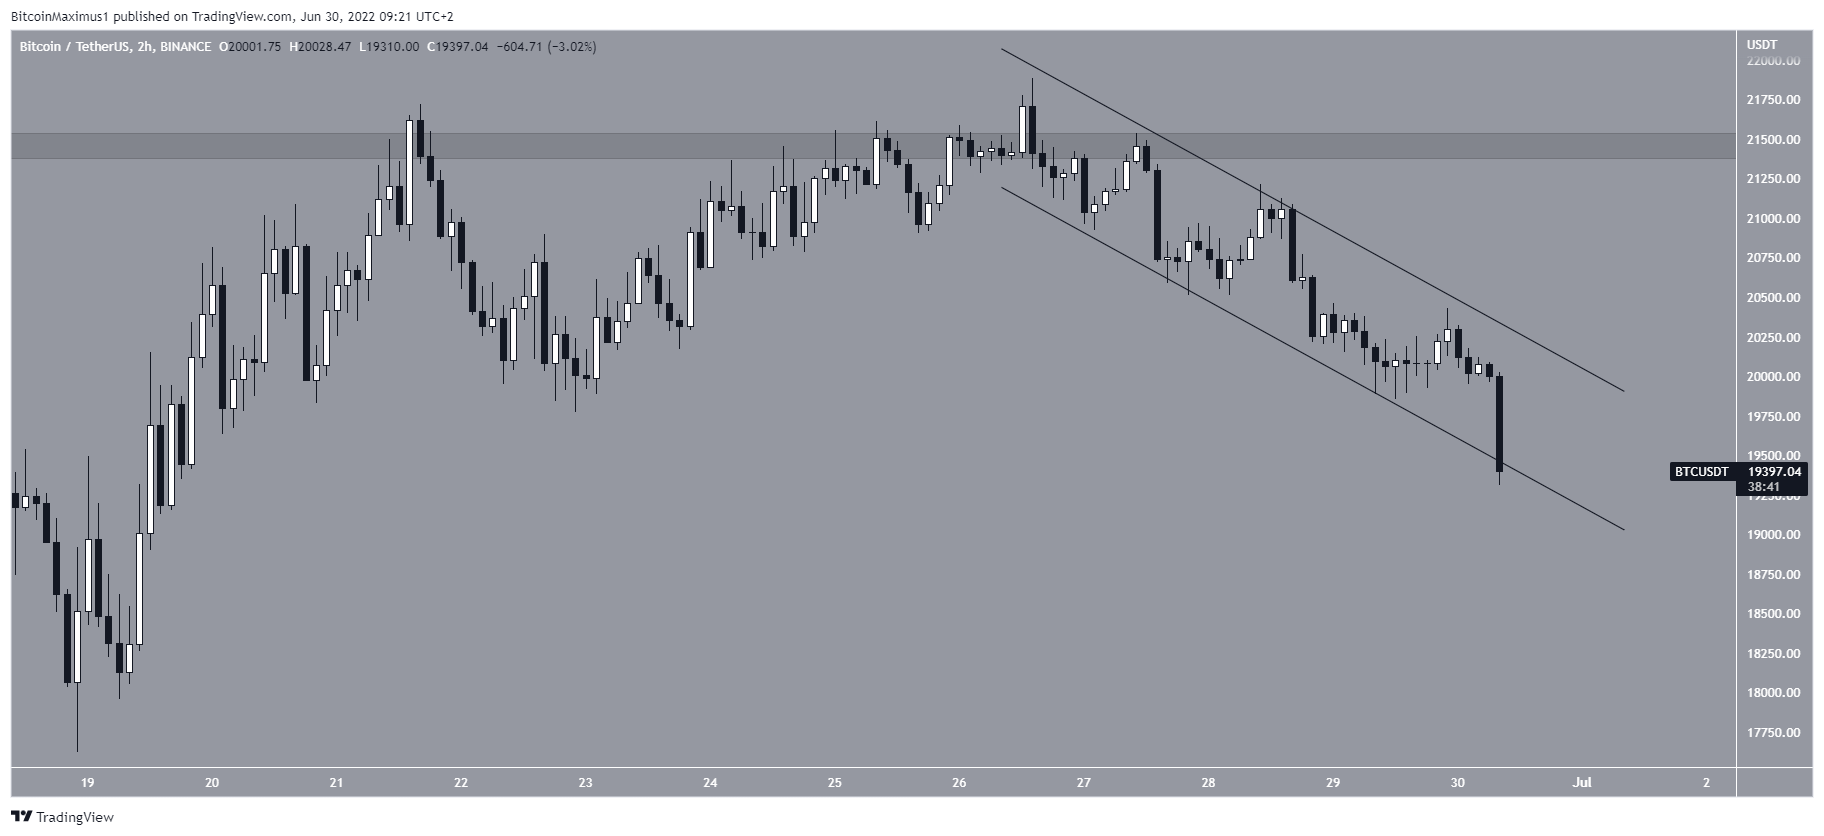
Measuring from the June 26 high, it is possible that the decrease has been contained inside a descending parallel channel. However, the channel is at risk of breaking down, so a bounce at the current level is required in order for the pattern to remain in place.
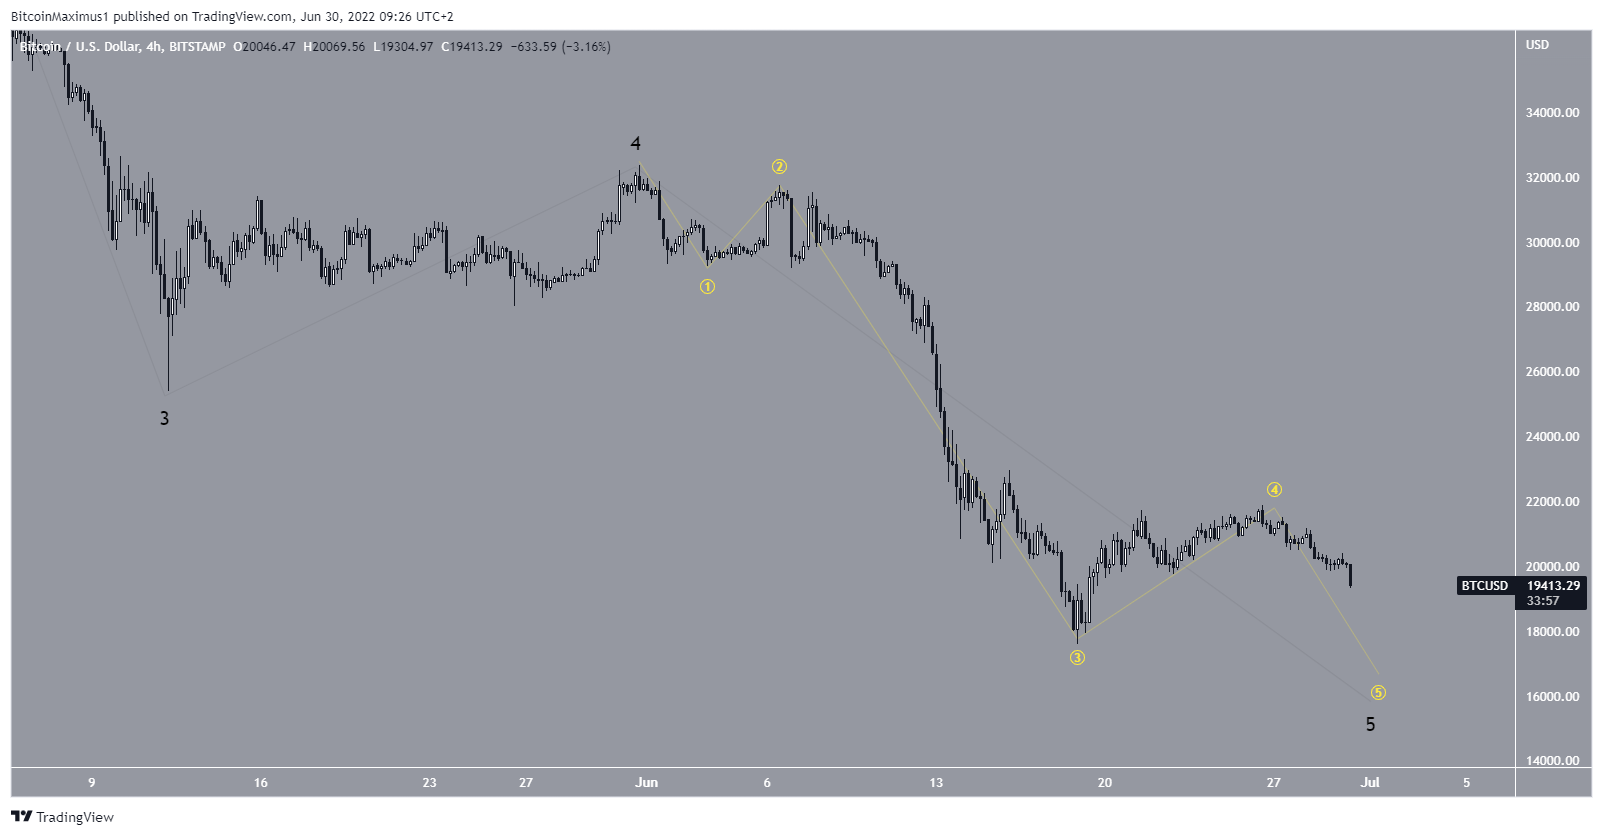
BTC wave count analysis
There are still several possibilities for the long-term wave count. On the other hand, there are two main possibilities for the short-term count.
The bullish outlook indicates that the price is very close to completing an A-B-C corrective structure, after which the upward movement that began on June 16 will continue.
So far, waves A:C have had a 1:1.27 ratio, which is somewhat uncommon.
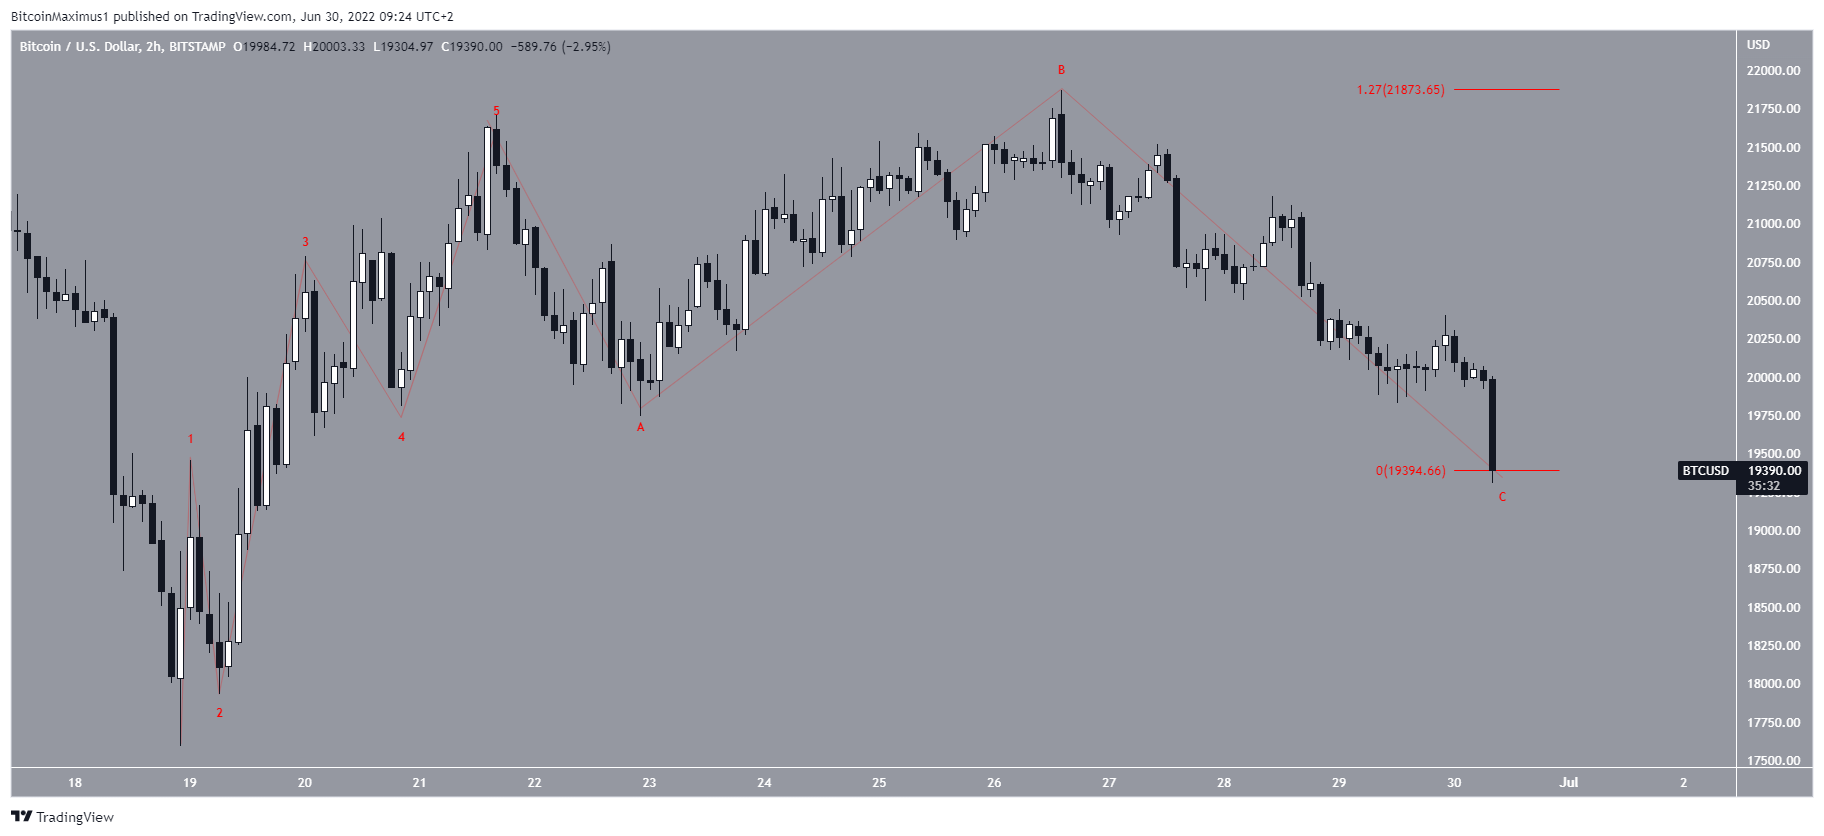
The bearish count indicates that the entire downward movement since the beginning of June is part of wave four (white) of a five-wave downward movement, and the price will fall towards $16,000 before eventually reversing.
Due to the mixed readings from the price action, indicators and the wave count, whether the price bounces at the current level will likely determine the direction of the next move.
For Be[in]Crypto’s previous bitcoin (BTC) analysis, click here
