

Bitcoin (BTC) was subjected to intense selling pressure last week and is now approaching its February lows once again.
During the week of Feb. 27-March 6, BTC created a candlestick with a very long upper wick (red icon), which is normally considered a sign of selling pressure.
Furthermore, the candlestick served to validate the $43,000 area as resistance. The area has been acting as resistance since BTC first broke down below it at the beginning of January.
The closest long-term support area is currently at $35,200.

BTC struggles to move above support
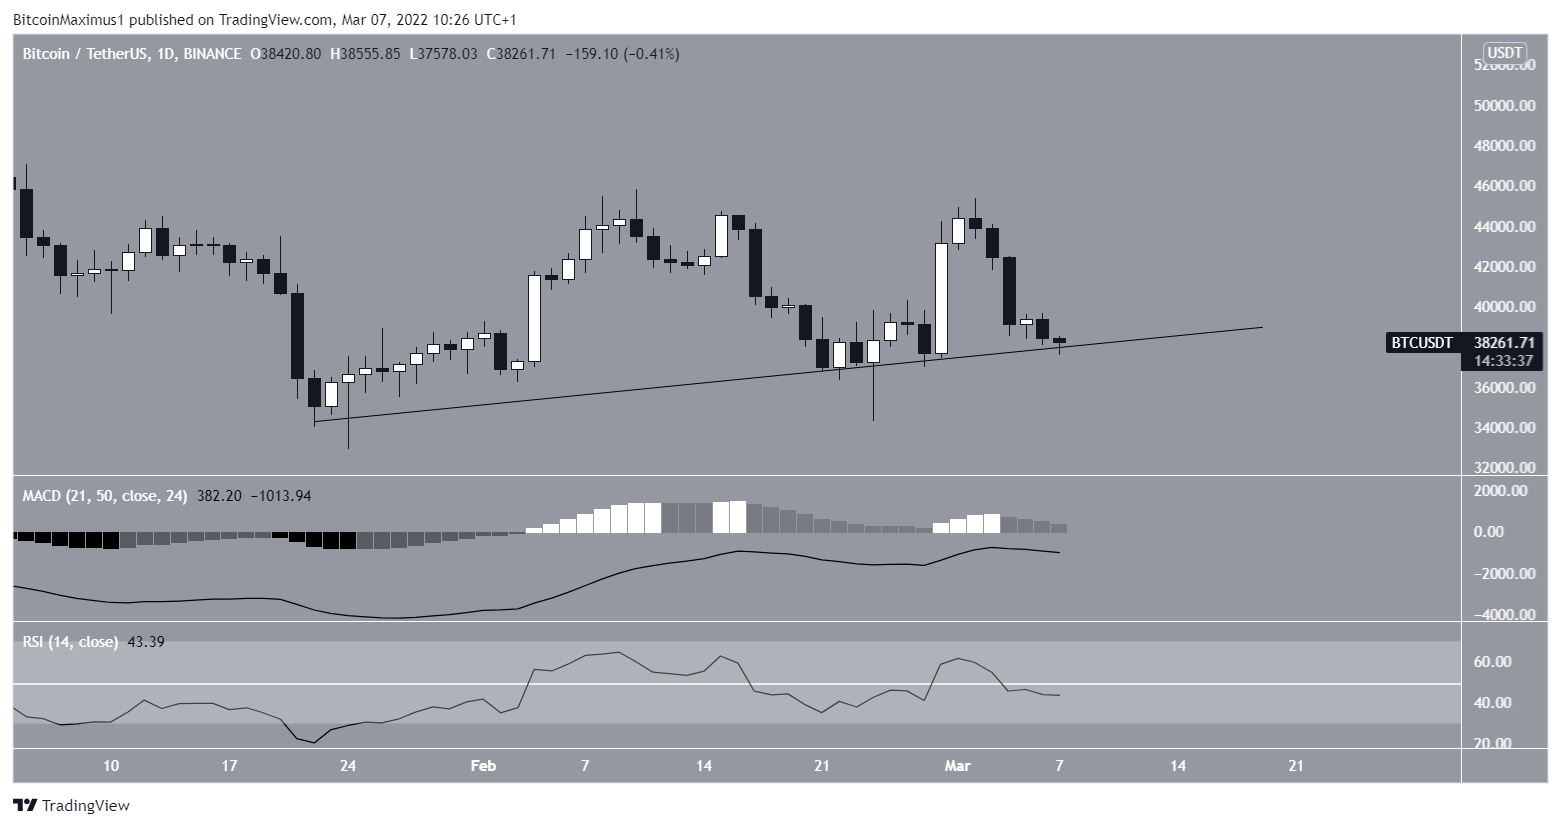
The daily chart shows that BTC has been following an ascending support line since Jan. 24. It recently rebounded at the line on Feb. 24 before returning to it on March 7.
Technical indicators in the daily time frame are bearish as both the MACD and RSI are decreasing. The former is currently negative while the latter is below 50. Both of these readings are associated with bearish trends.
Therefore, a breakdown below the support line seems to be the most likely scenario.
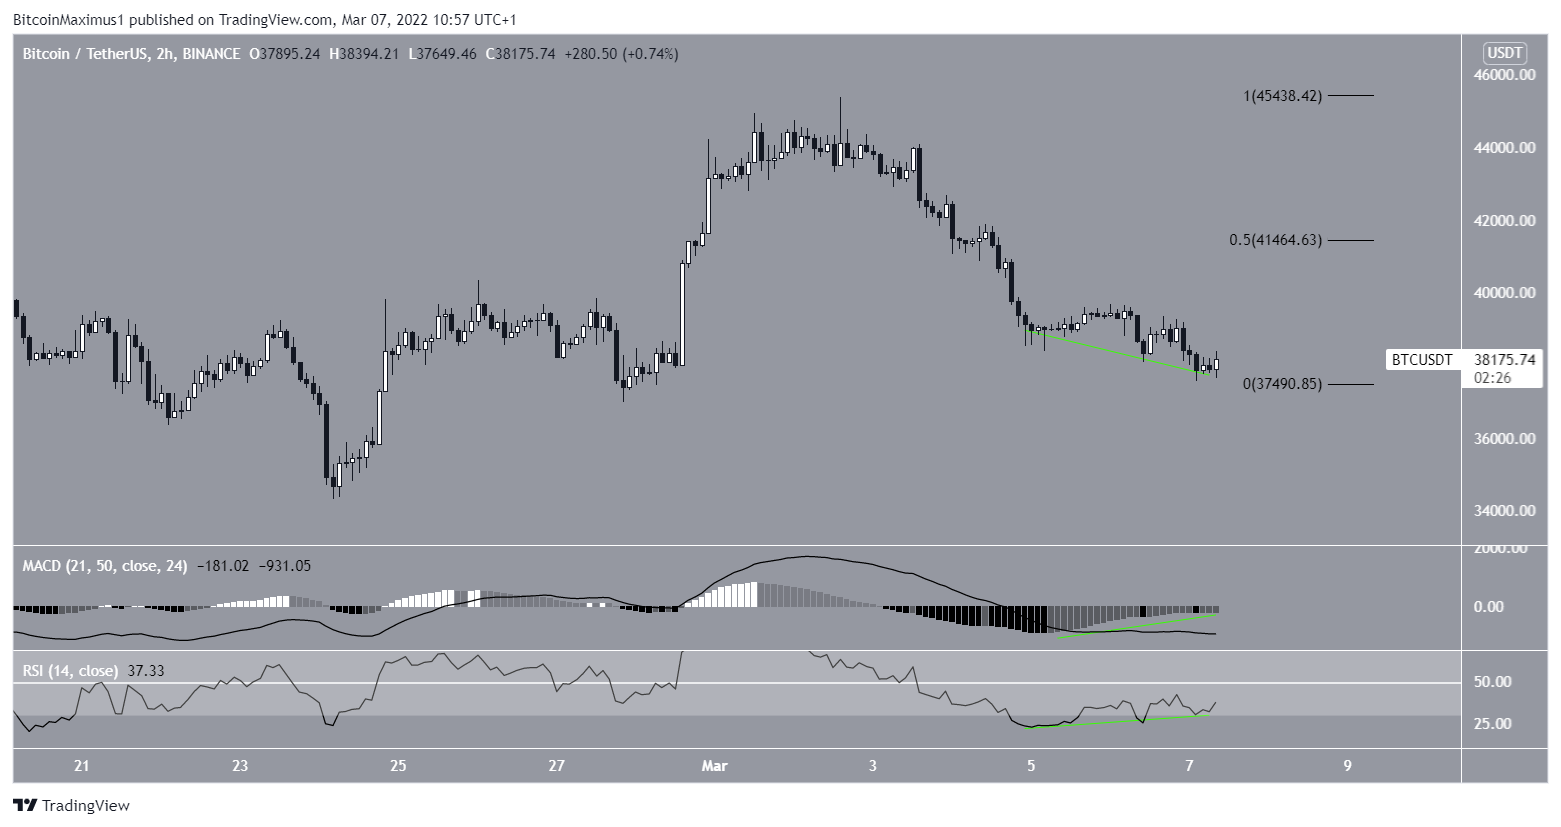
However, the two-hour chart suggests that a short-term bounce could transpire prior to a breakdown. The reason for this is the considerable bullish divergences that have developed in both the RSI and MACD (green lines). Such divergences often precede upward moves.
If a rebound transpires, the closest resistance area would be found at $41,450. This is the 0.5 Fib retracement resistance level and a horizontal resistance area.
Wave count analysis
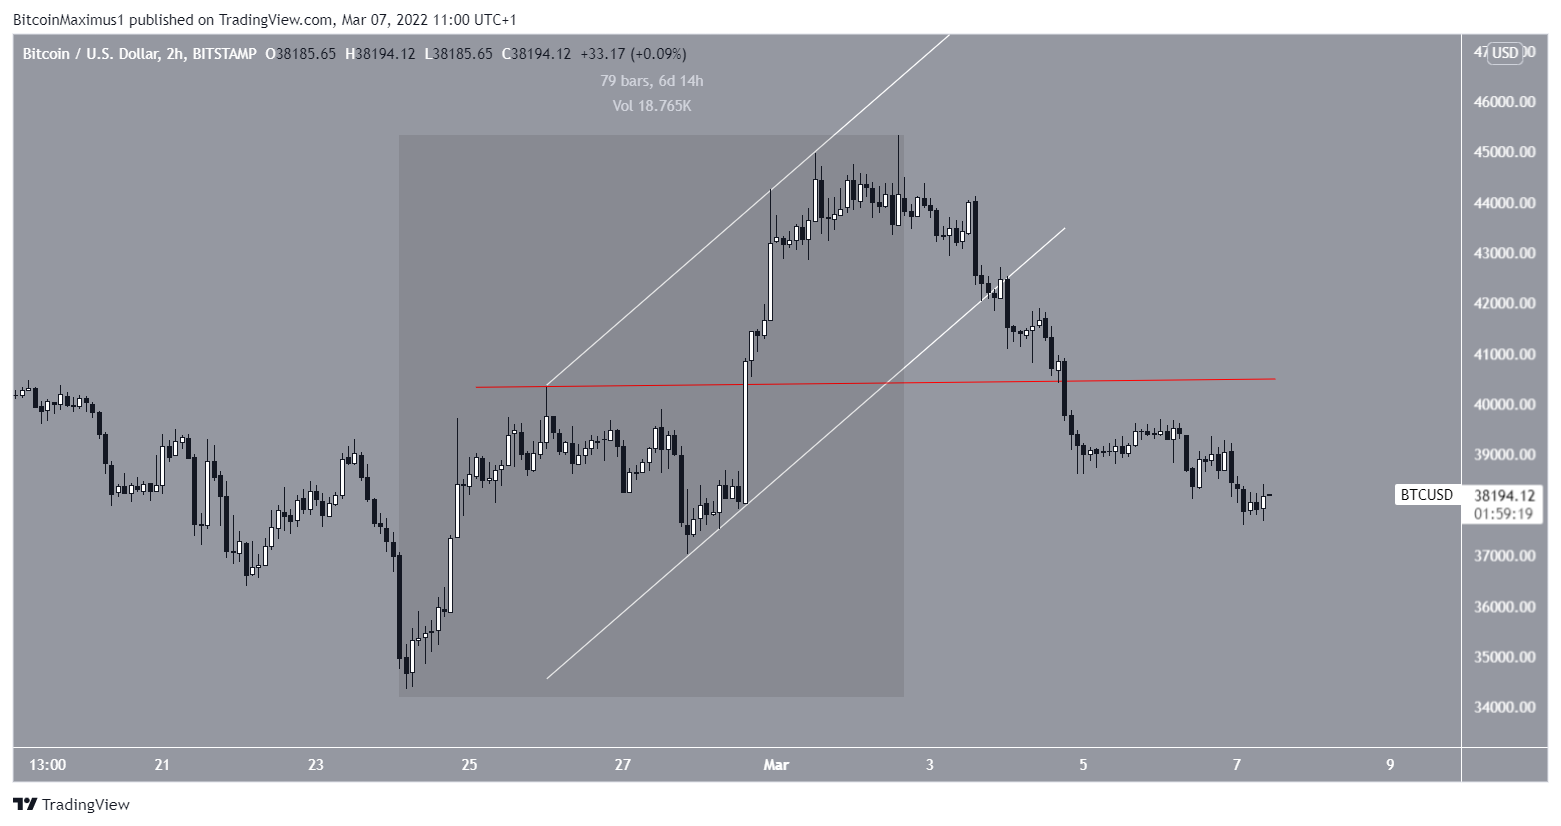
Initially, it seemed that BTC had begun a five-wave upward move on Jan 24.
However, on March 3, it broke down from an ascending parallel channel and decreased below its Feb 26 highs (red line) at $40,330.
This suggests that the upward move could be a three-wave structure instead (highlighted). This pattern is normally corrective and indicates that BTC will likely break down below its February lows.
For BeInCrypto’s previous Bitcoin (BTC) analysis, click here
Trusted
Disclaimer
In line with the Trust Project guidelines, this price analysis article is for informational purposes only and should not be considered financial or investment advice. BeInCrypto is committed to accurate, unbiased reporting, but market conditions are subject to change without notice. Always conduct your own research and consult with a professional before making any financial decisions. Please note that our Terms and Conditions, Privacy Policy, and Disclaimers have been updated.
