

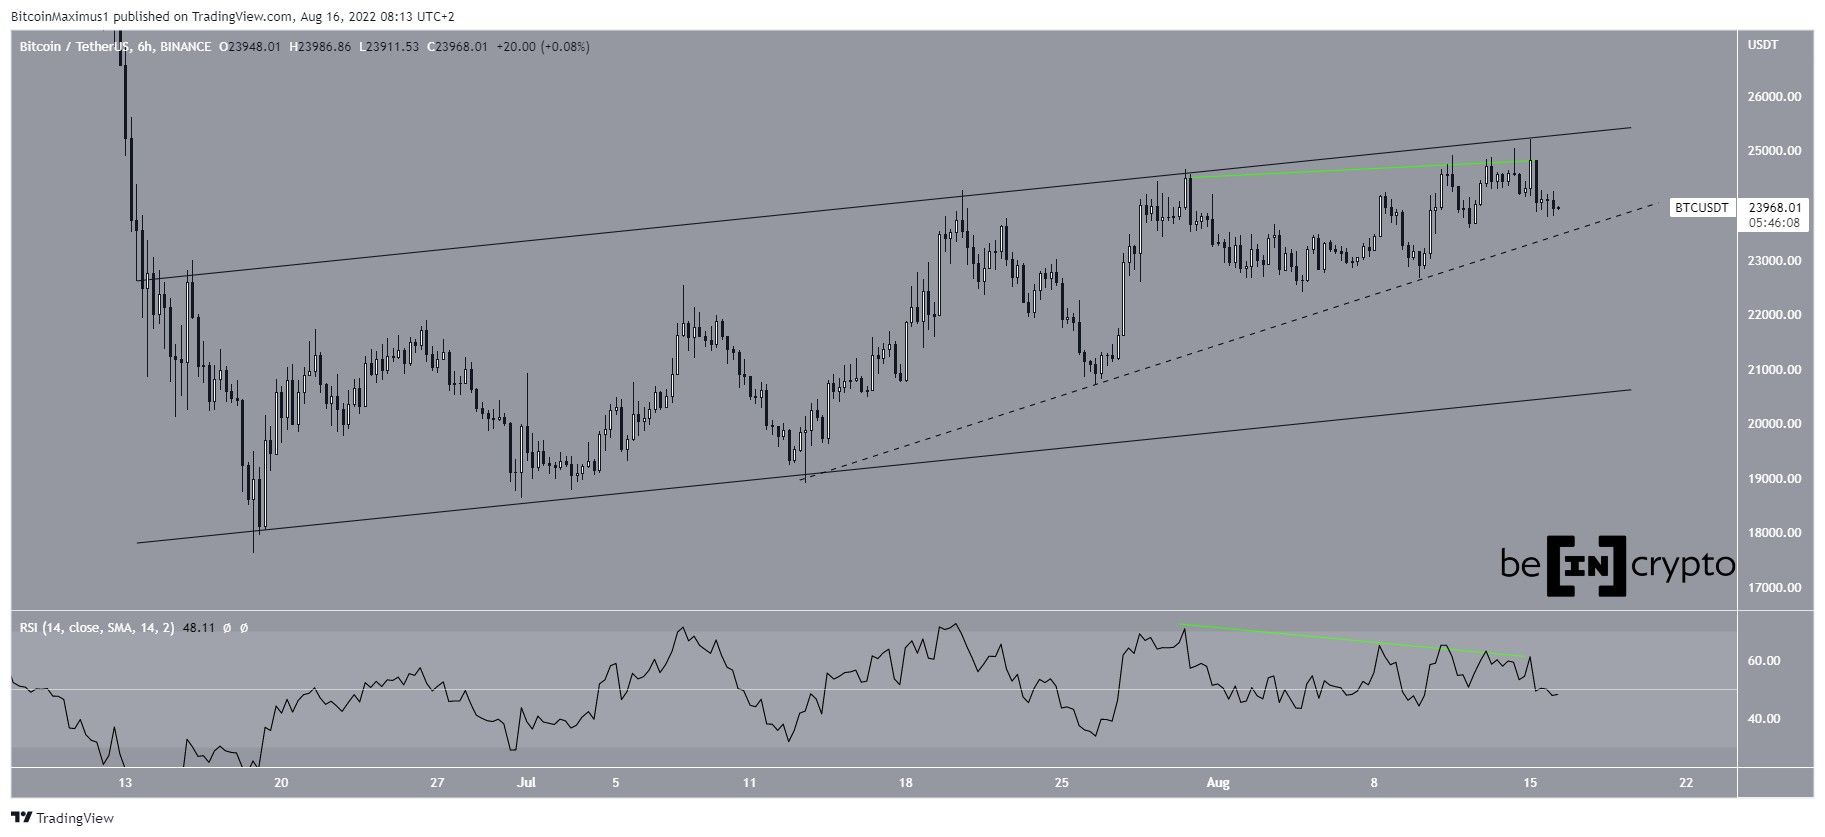
Bitcoin (BTC) has been rejected by the resistance line of a corrective pattern and is currently attempting to find support.
Bitcoin has been increasing inside an ascending parallel channel since June 18. Such channels usually contain corrective movements, meaning that an eventual breakdown from it would be likely. The extreme overlap inside the pattern also supports this possibility.
Bitcoin made two unsuccessful breakout attempts on July 30 and Aug. 15. These attempts were also combined with a bearish divergence in the six-hour RSI.
Bitcoin has been falling since the last attempt and is now approaching an ascending support line (dashed) which has been in place since July 13.
A potential breakdown from this support line could take BTC down to the support line of the channel near $21,000 or lower.
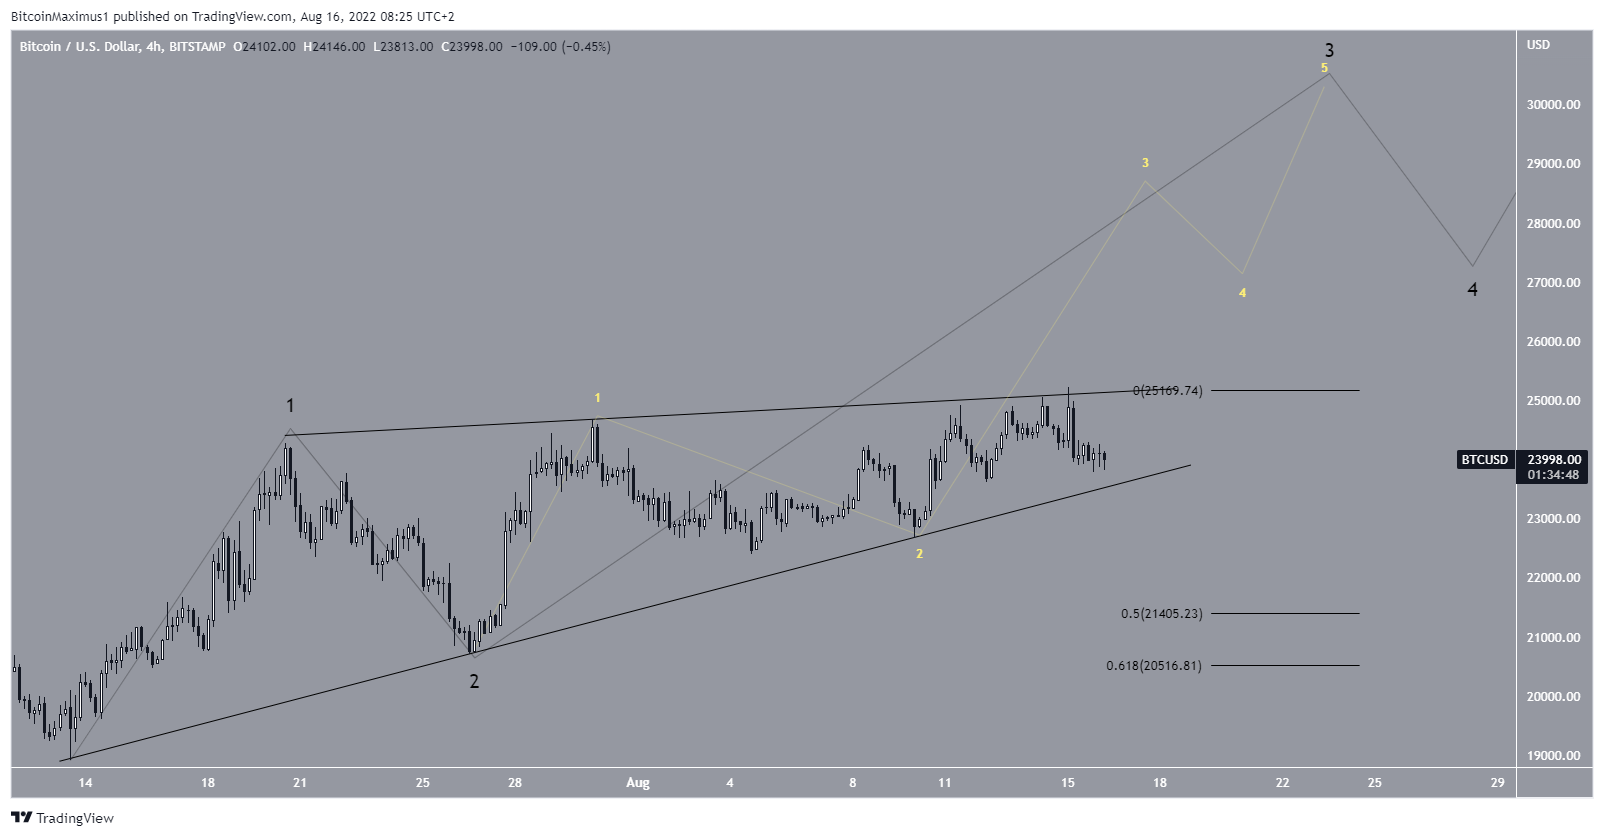
BTC wave count analysis
The first potential wave count suggests that BTC is in wave three of a five-wave upward move (black). The sub-wave count is shown in yellow and indicates that the price is in wave three.
If true, this would create a 1-2/1-2 wave formation. This could help to accelerate an upward push in the near future.
In order for the count to remain correct, Bitcoin has to hold on above the slope of the original 1-2 and break out above its ascending resistance line (black).
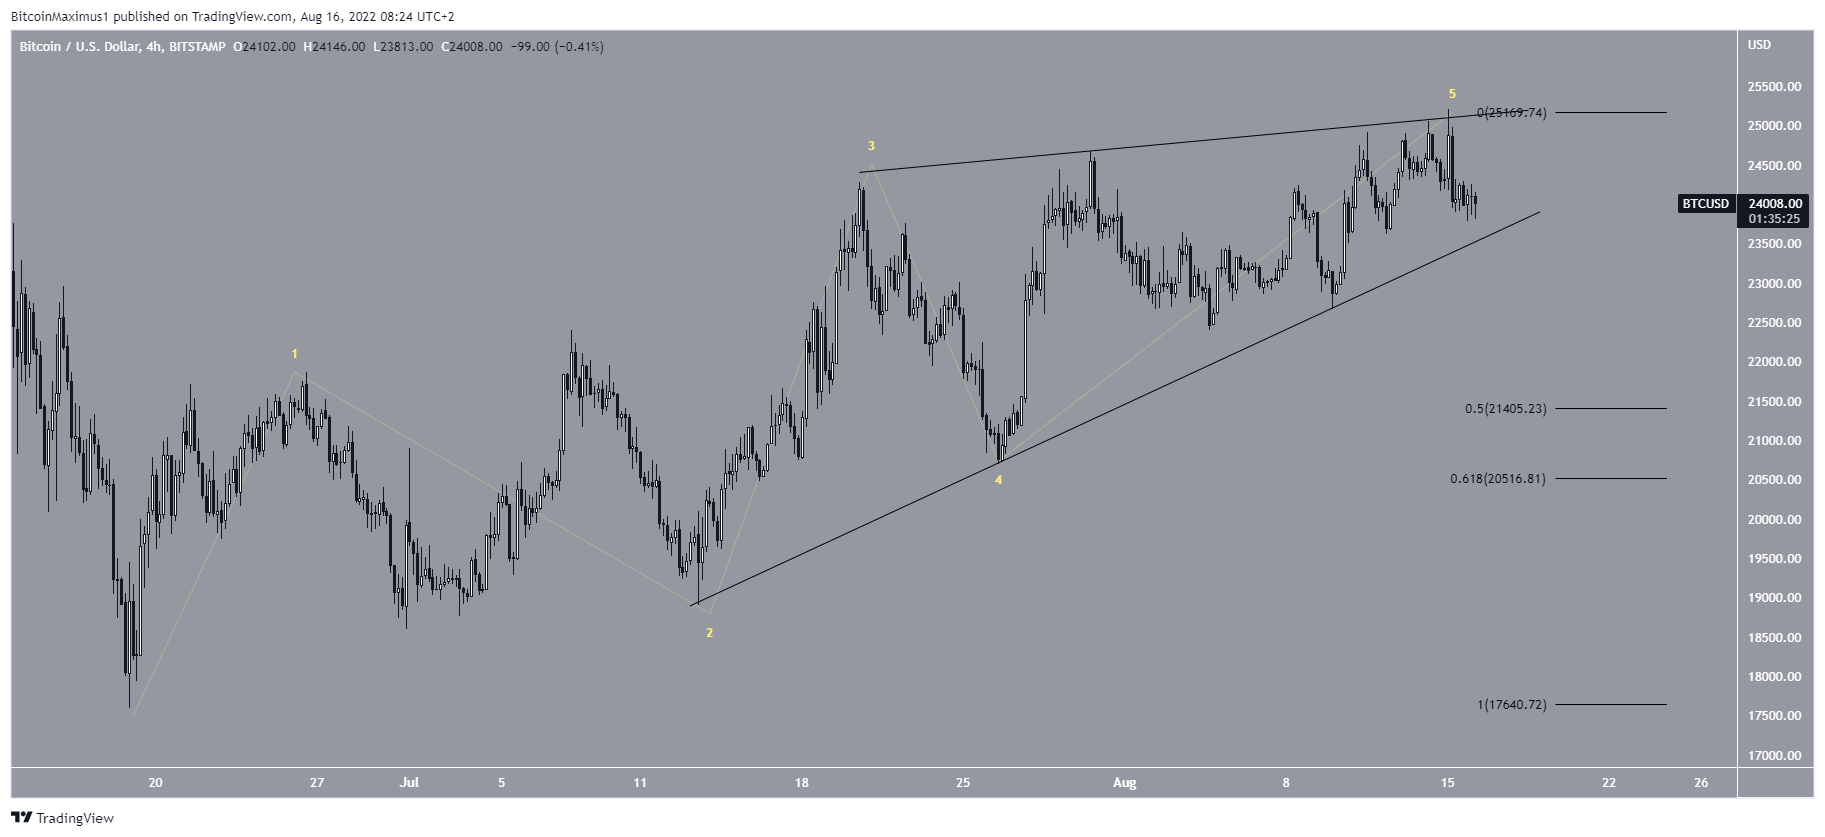
Alternative count
The alternative short-term count suggests that the entire upward move since June 18 is part of a leading diagonal, hence the shape of the ascending wedge. In this case, a breakdown from the wedge and subsequent decrease towards the 0.5-0.618 Fib retracement support levels at $20,500 to $21,400 would be expected prior to the continuation of the upward movement.
To conclude, both the short-term counts and the most likely long-term wave count suggest that a bottom has already been reached.
For Be[in]Crypto’s previous Bitcoin (BTC) analysis, click here
Trusted
Disclaimer
In line with the Trust Project guidelines, this price analysis article is for informational purposes only and should not be considered financial or investment advice. BeInCrypto is committed to accurate, unbiased reporting, but market conditions are subject to change without notice. Always conduct your own research and consult with a professional before making any financial decisions. Please note that our Terms and Conditions, Privacy Policy, and Disclaimers have been updated.
