

Bitcoin (BTC) increased significantly on Friday and has potentially begun a bullish trend reversal. While Ethereum (ETH) and XRP (XRP) are still lagging behind, both have posted increases.
BTC
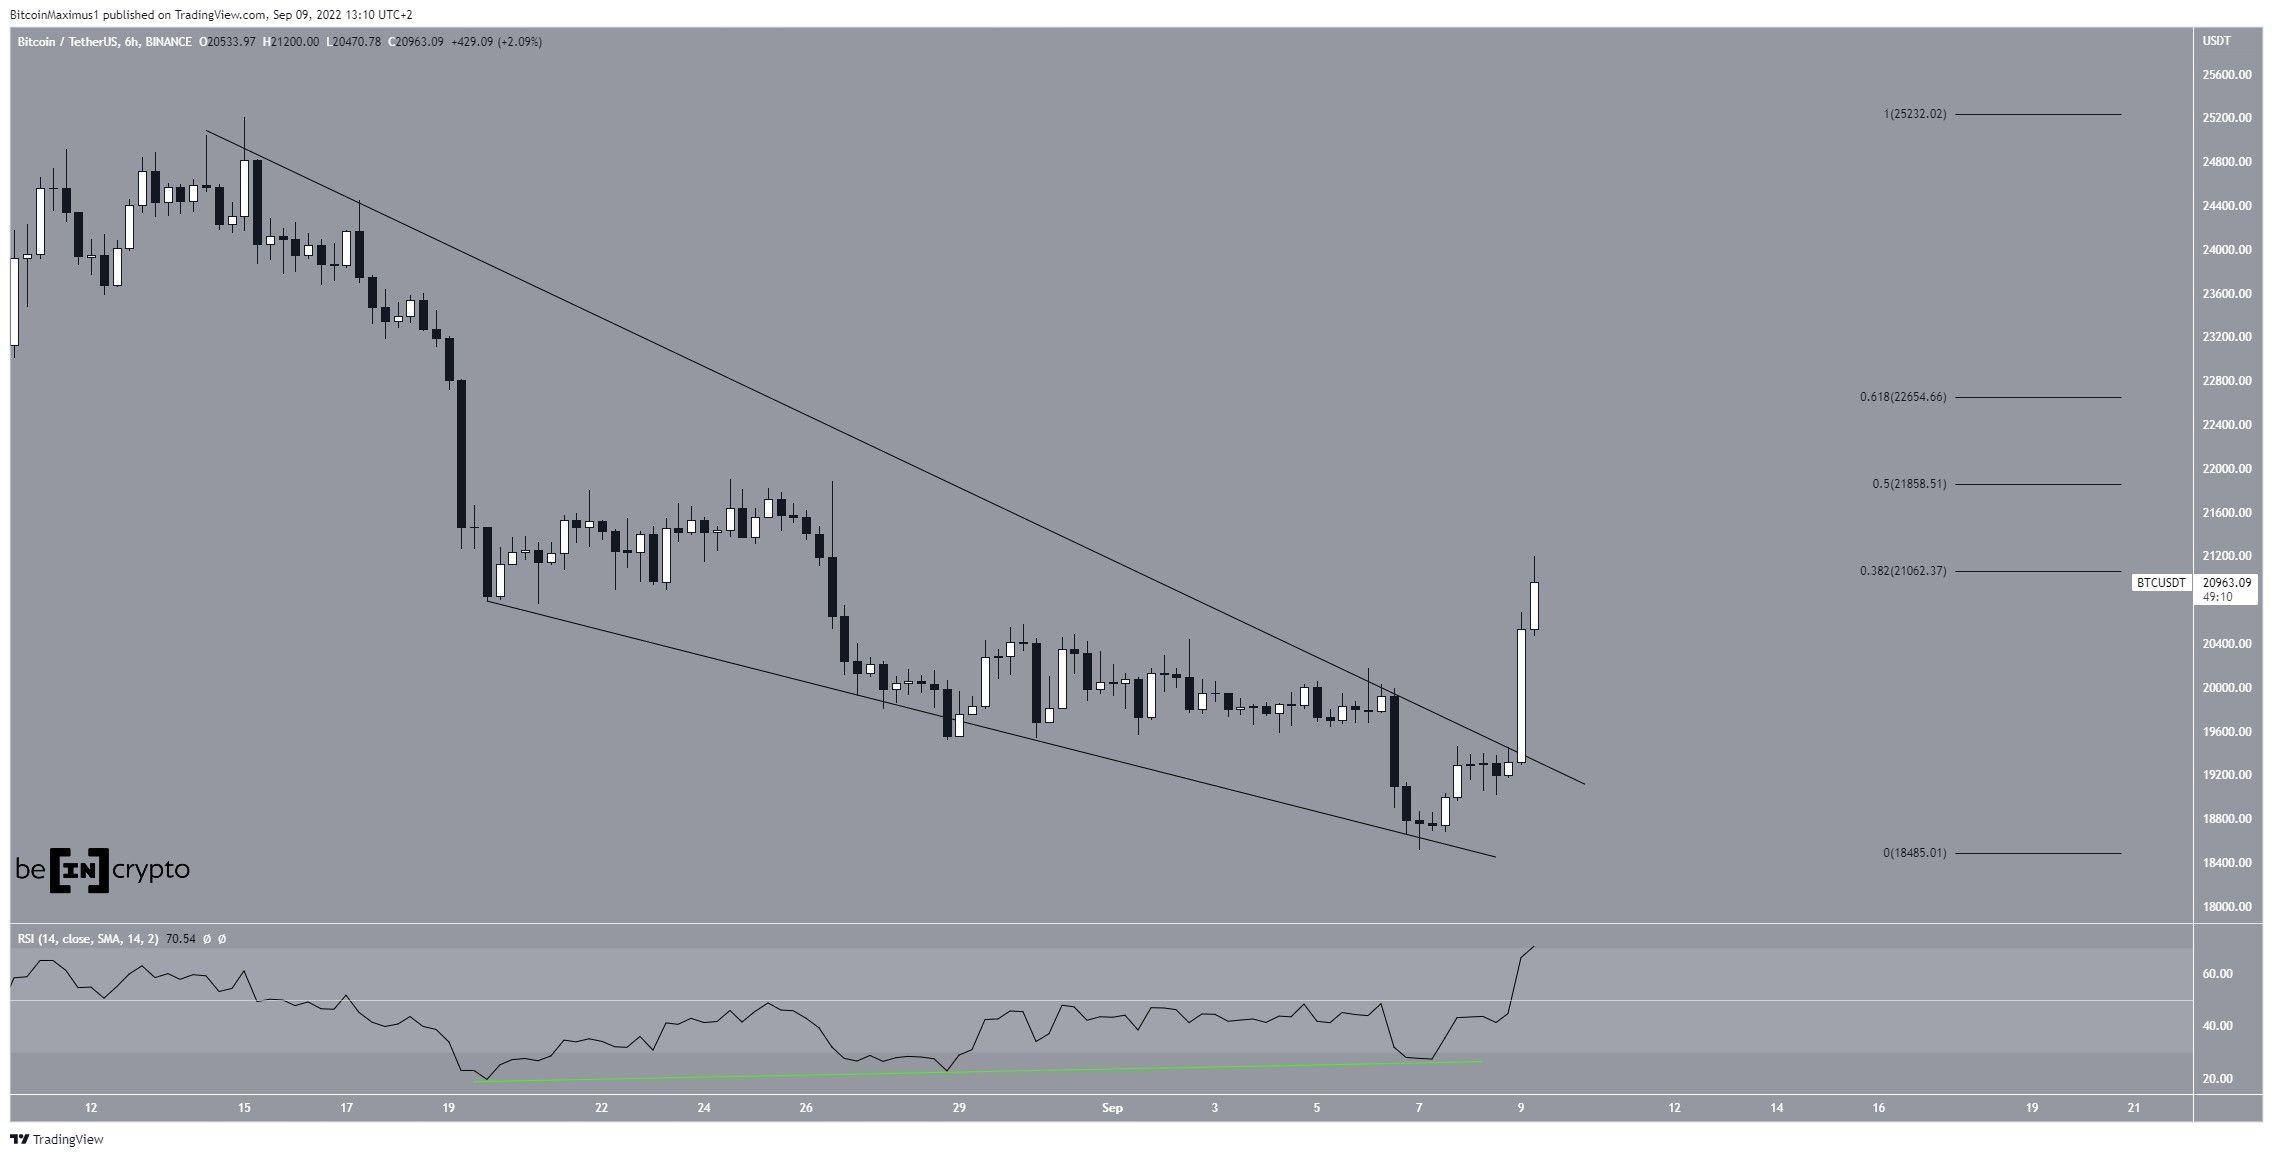
BTC had been decreasing underneath a descending resistance line since Aug 15. The movement took the shape of a descending wedge on Aug 19. The descending wedge is considered a bullish pattern, meaning that it leads to breakouts the majority of the time.
Furthermore, the six-hour RSI had been generating bullish divergence since Aug 15. As expected, BTC broke out on Sept 9 and has already reached the 0.382 Fib retracement resistance level at $21,000. The next resistance levels are at $21,800 and $22,650, created by the 0.5 and 0.618 Fib retracement resistance levels, respectively.
The wave count suggests that an increase towards at least $22,000 is expected.
ETH
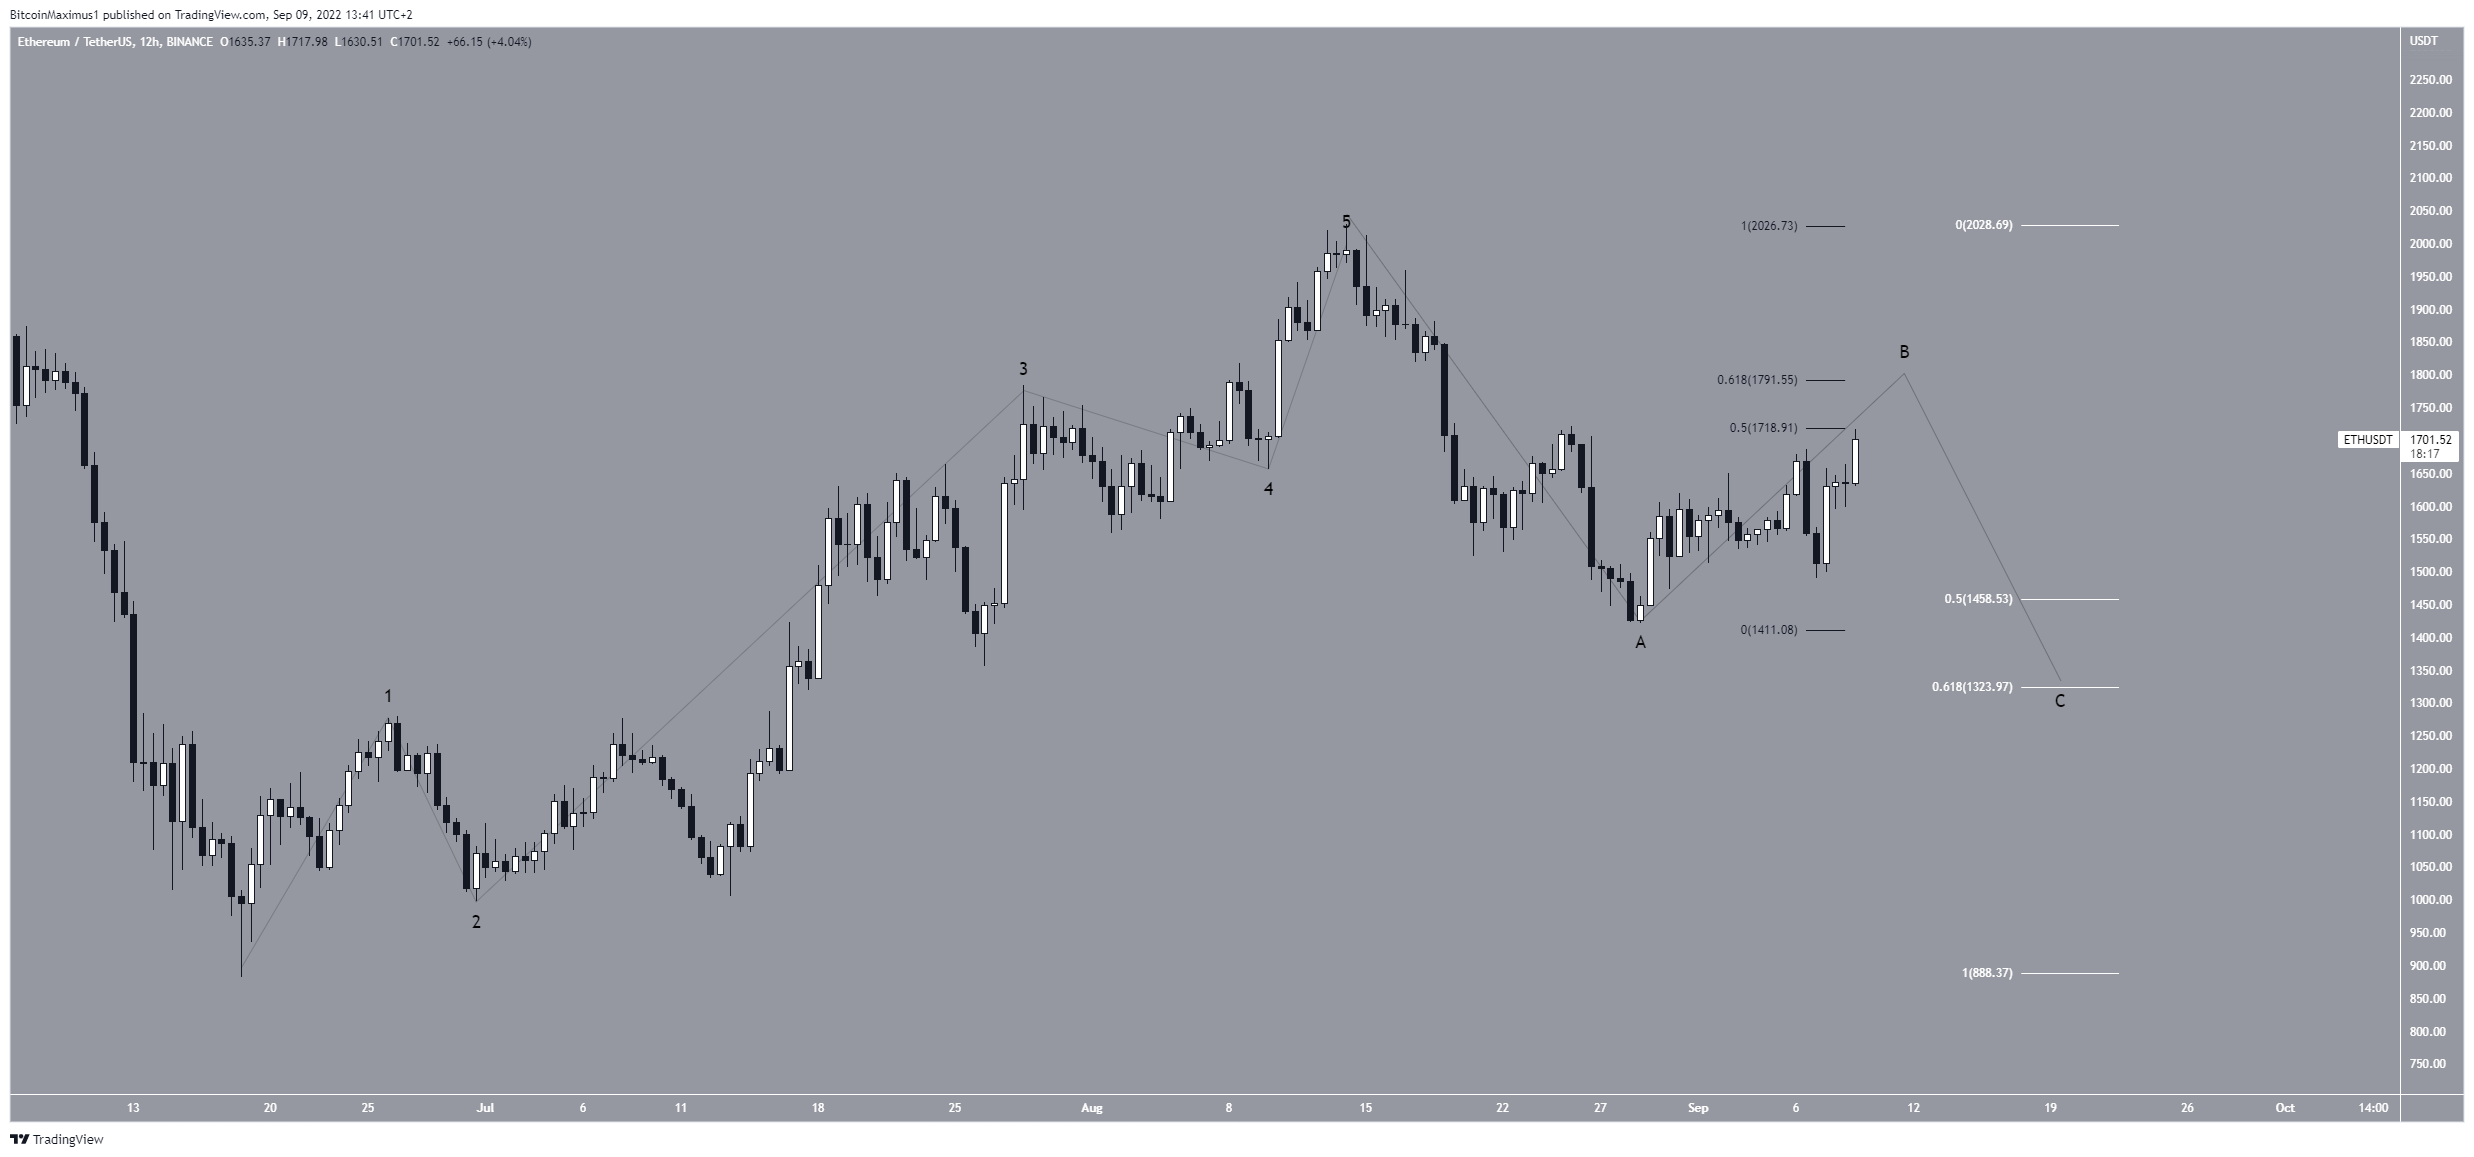
Beginning on June 18, ETH initiated a five-wave upward movement that led to a high of $2,030 on Aug 14. The price has been decreasing since in what seems to be an A-B-C corrective structure.
If so, ETH is currently in the B wave of this structure, which could take it towards the 0.618 Fib retracement resistance level at $1,790 (black). Afterward, a final drop could take ETH back to the 0.618 Fib support (white) at $1,323 before the upward movement resumes.
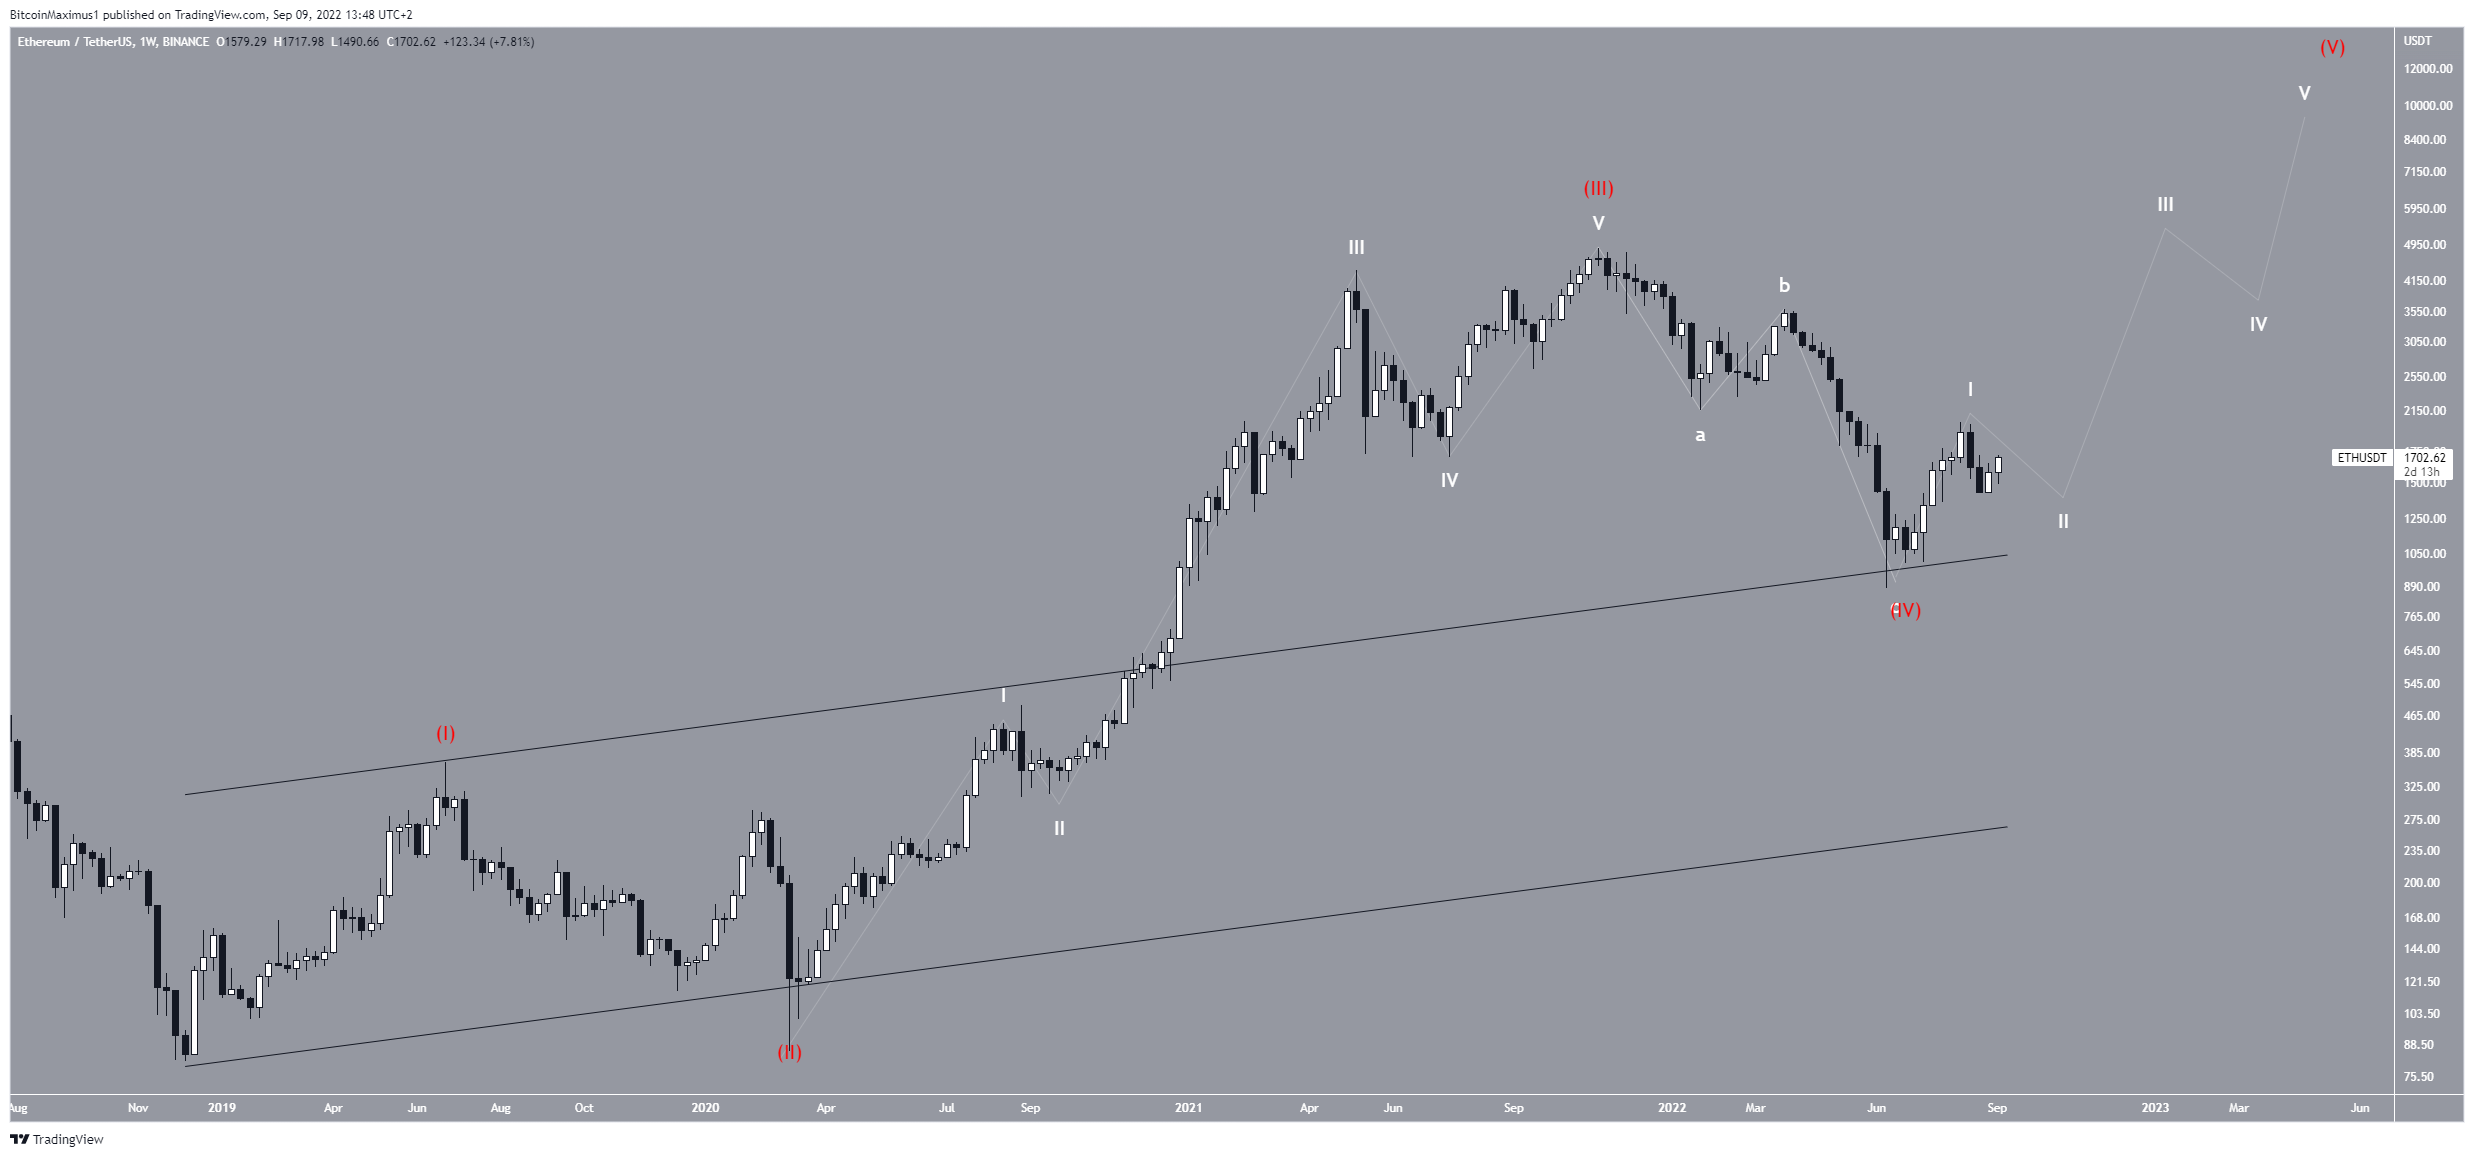
As for the long-term count, it is possible that ETH has begun the fifth and final wave of a bullish impulse that began in 2019. In this case, the sub-wave count is given in white. A decrease below the sub-wave one low of $881 would invalidate this particular count.
XRP
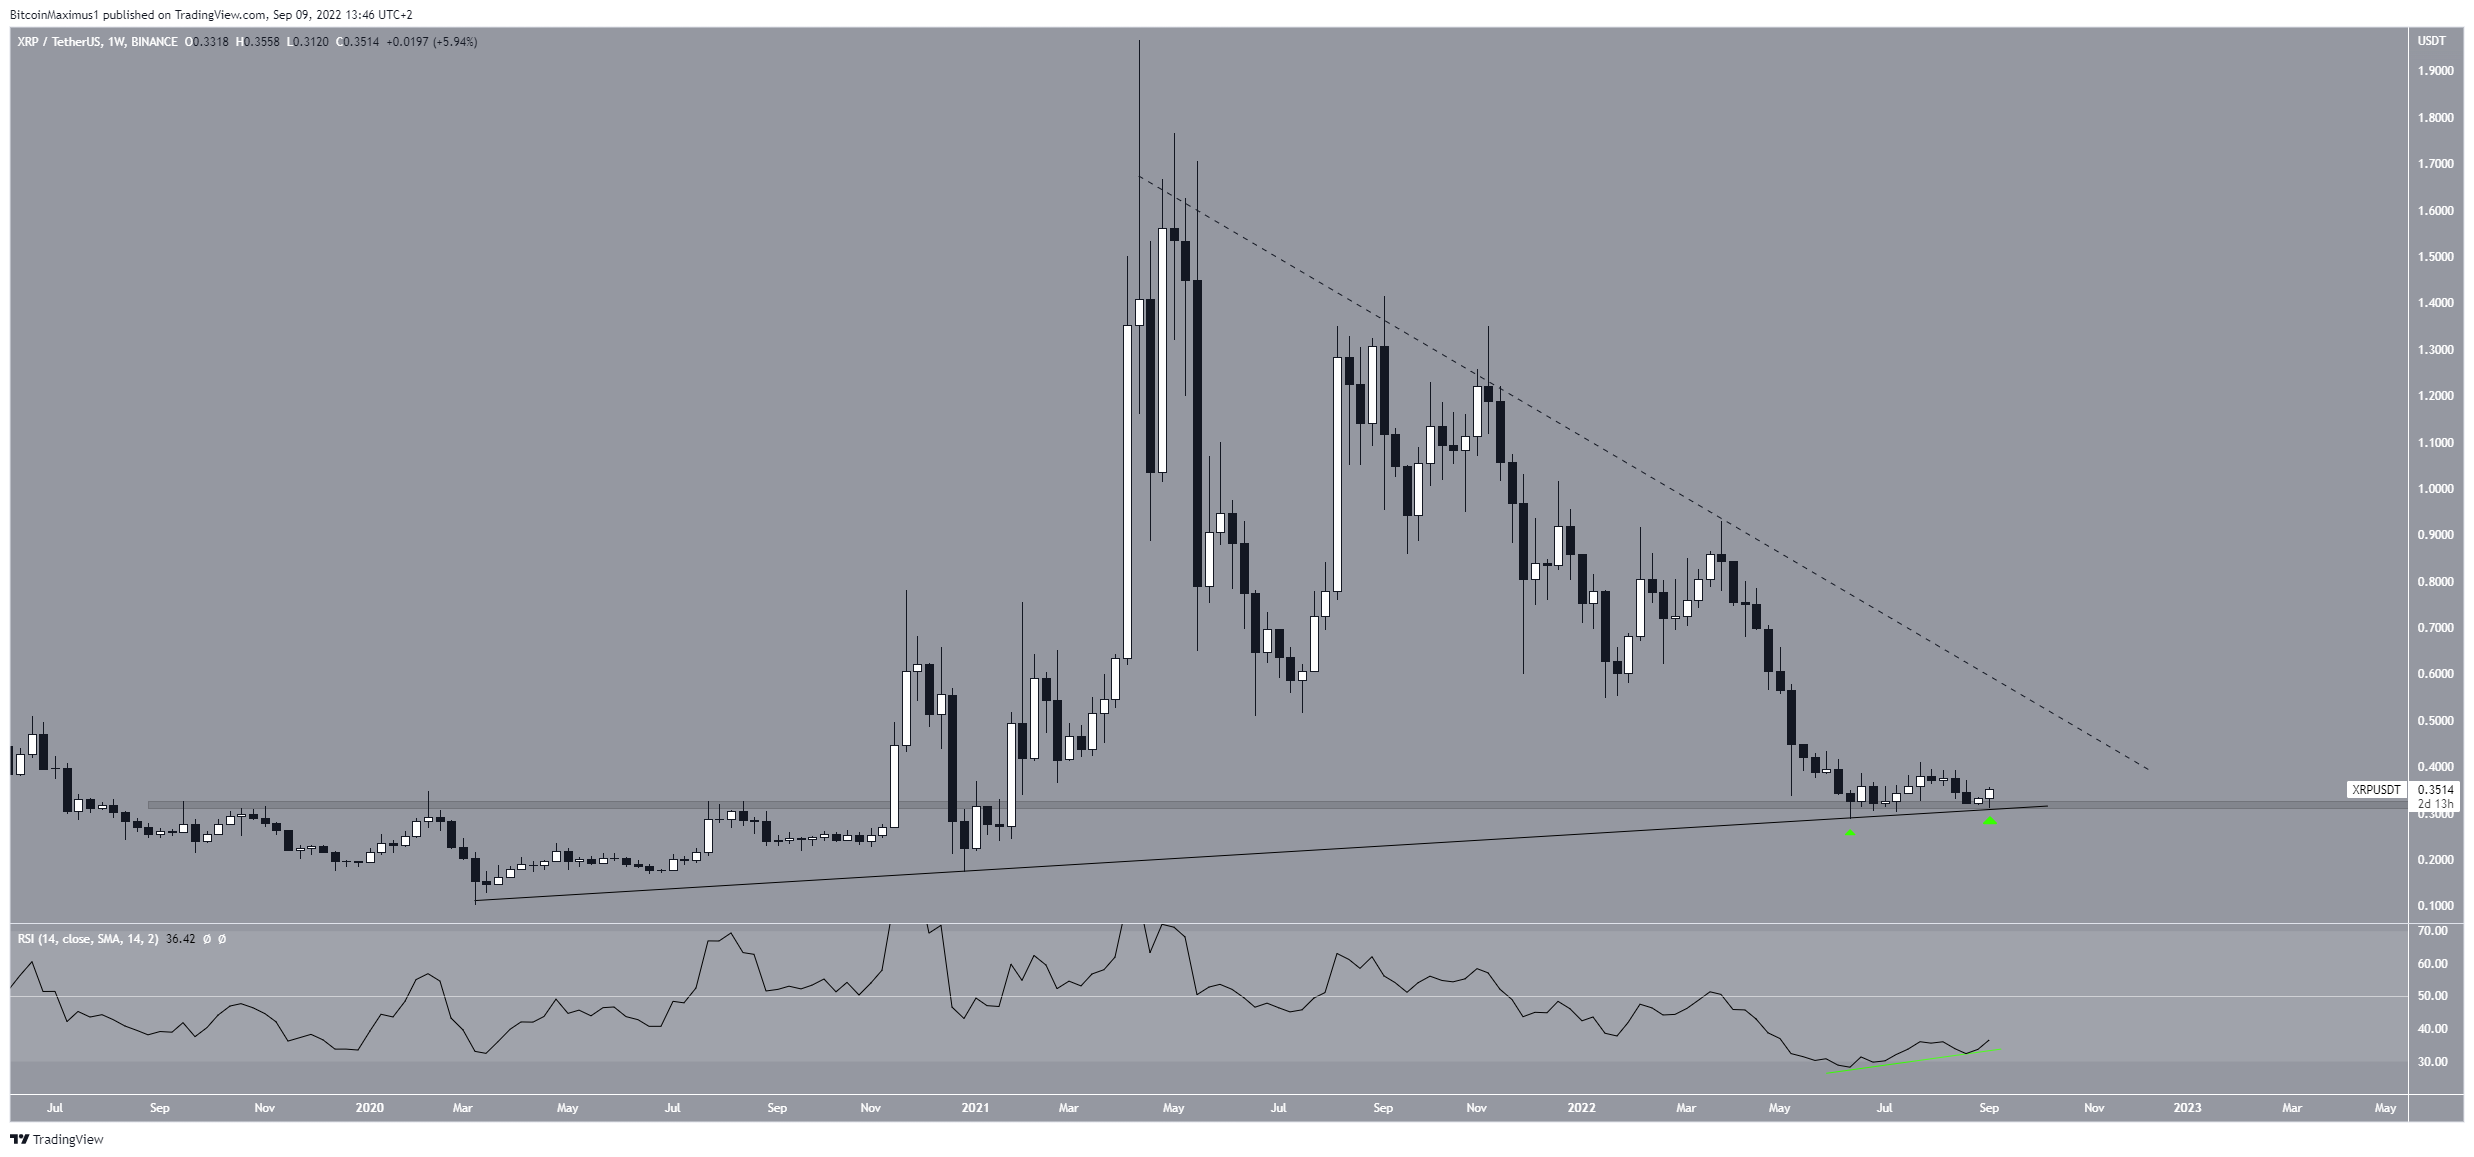
XRP has been following a long-term ascending support line since its March 2020 bottom. More recently, it bounced above this line twice, in June and Sep respectively (green icons). At this time, the line also coincided with the $0.32 horizontal support area, increasing the legitimacy of the bounce.
Additionally, the weekly RSI has begun to generate bullish divergence. If this divergence is confirmed, it could lead to a significant upward movement that takes XRP at least to the long-term descending resistance line (dashed) at $0.55.
For Be[in]Crypto’s latest Bitcoin (BTC) analysis, click here
Disclaimer
In line with the Trust Project guidelines, this price analysis article is for informational purposes only and should not be considered financial or investment advice. BeInCrypto is committed to accurate, unbiased reporting, but market conditions are subject to change without notice. Always conduct your own research and consult with a professional before making any financial decisions. Please note that our Terms and Conditions, Privacy Policy, and Disclaimers have been updated.
