

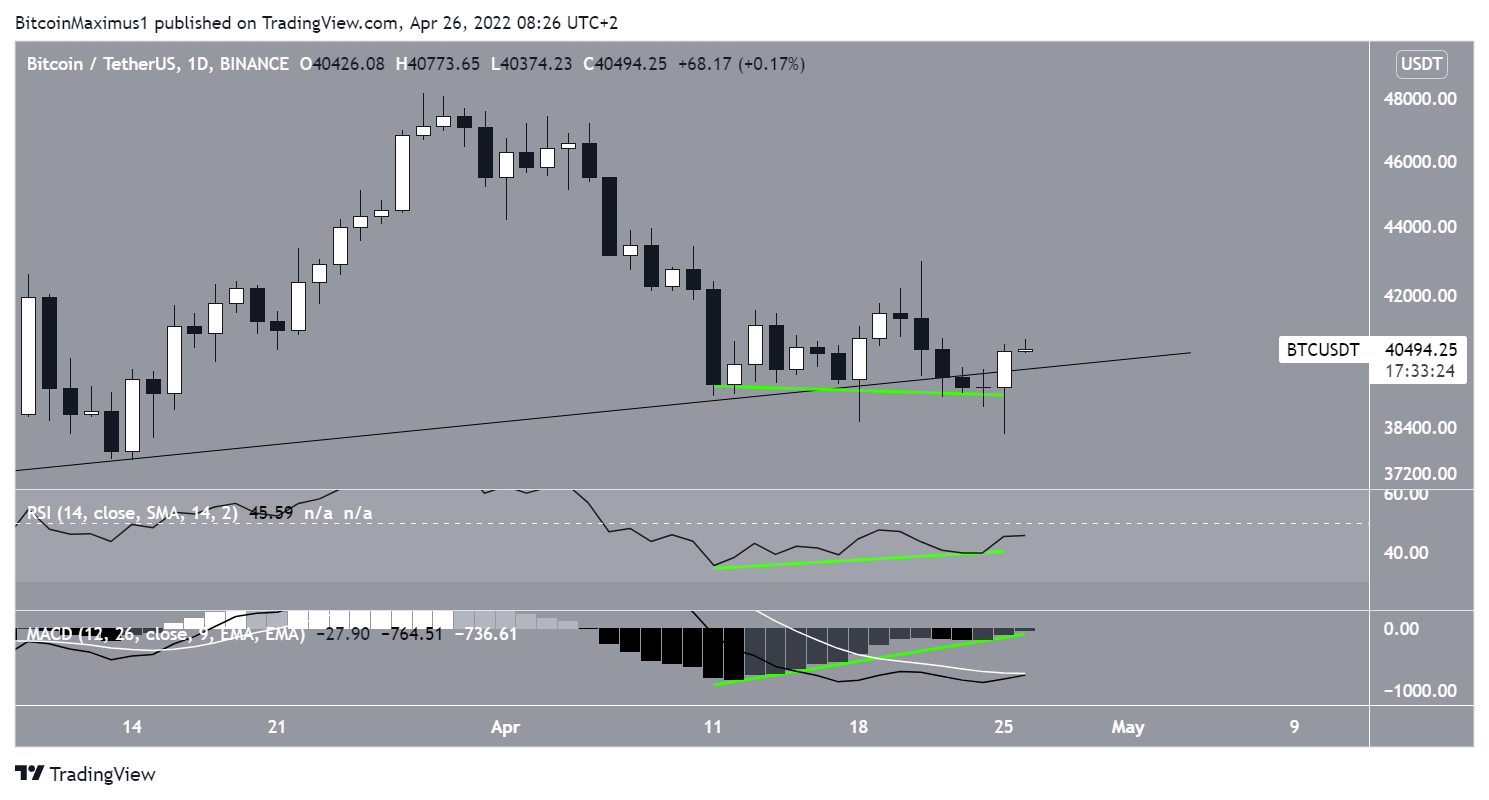
Bitcoin (BTC) created a bullish hammer candlestick on April 25. Similar candlesticks have previously led to sustained upward moves.
Bitcoin has been increasing above an ascending support line since Jan. 22. So far, it has validated the line at least seven times.
Several of the touches created bullish candlesticks. Most notably, bullish hammers were created on Jan. 24 and Feb. 24, preceding significant upward movements.
Another bullish candlestick was created on April 18, but the upward move that followed was short lived and BTC fell back to the support line. Despite this decrease, it created another hammer candlestick on April 25 (green icons).
It remains to be seen if this one will manage to initiate any significant upward price action.

Bullish divergences
Technical indicators in the daily time frame suggest that this bullish hammer could be the catalyst for a significant boost in price.
The main reason for this is the pronounced bullish divergences in both the RSI and MACD. Such divergences often precede bullish trend reversals.
The development is especially interesting in the MACD since the indicator is very close to making a bullish cross.
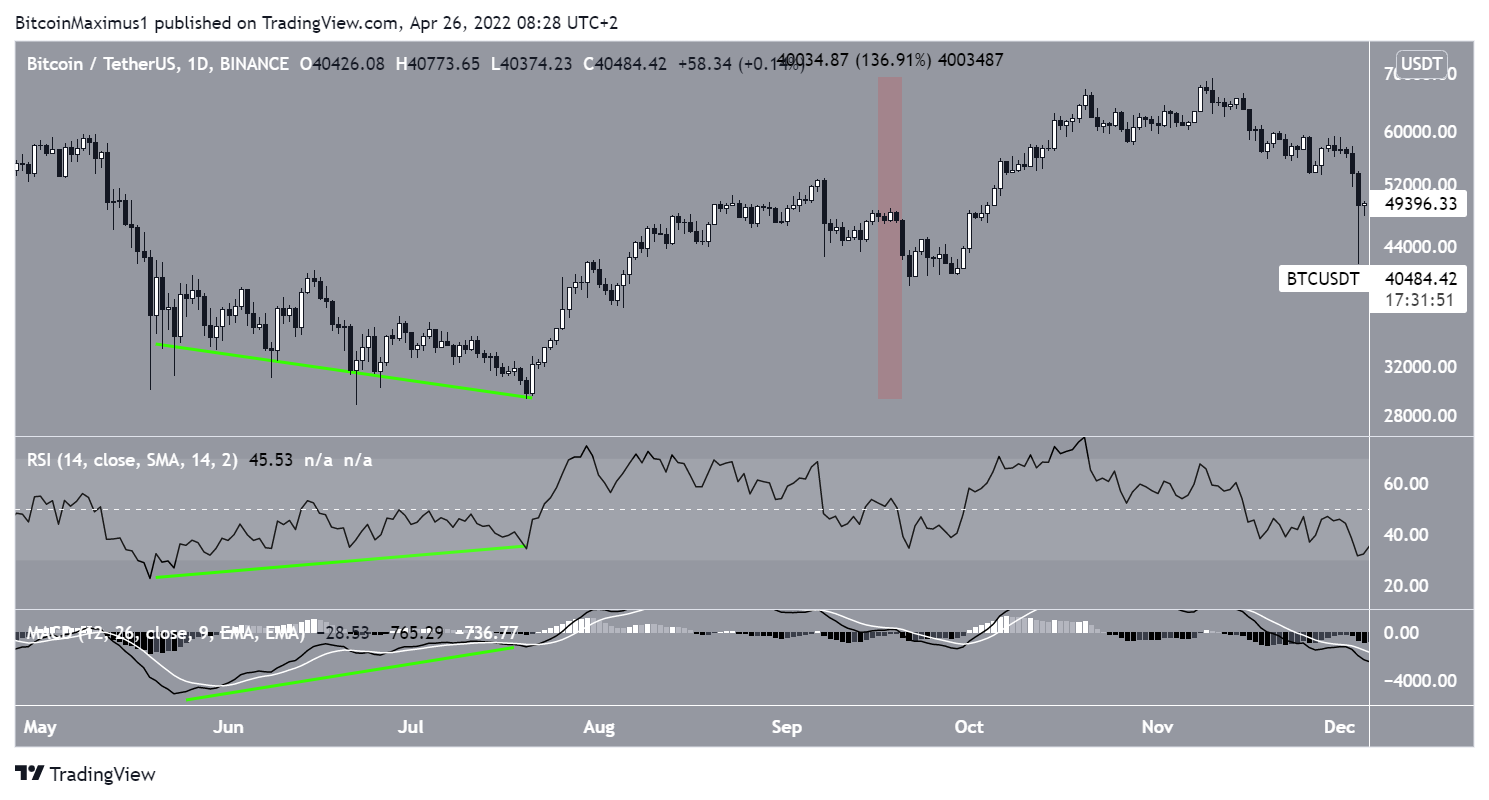
The previous time such a bullish divergence transpired in the RSI and MACD was in June/July 2021. It preceded an upward move of more than 130%.
Having said that, the June/July 2021 bullish divergence was much more pronounced than the current one.
Short-term movement
The six-hour BTC chart is also in alignment with the daily time frame. Both the RSI and MACD show pronounced bullish divergences. More importantly, their trend lines are still intact, suggesting that the divergence is expected to play out.
If it does, the closest resistance would likely be found between $42,050 and $43,200. This resistance range is created by the 0.382-0.5 Fib retracement resistance levels when measuring the entire downward movement.

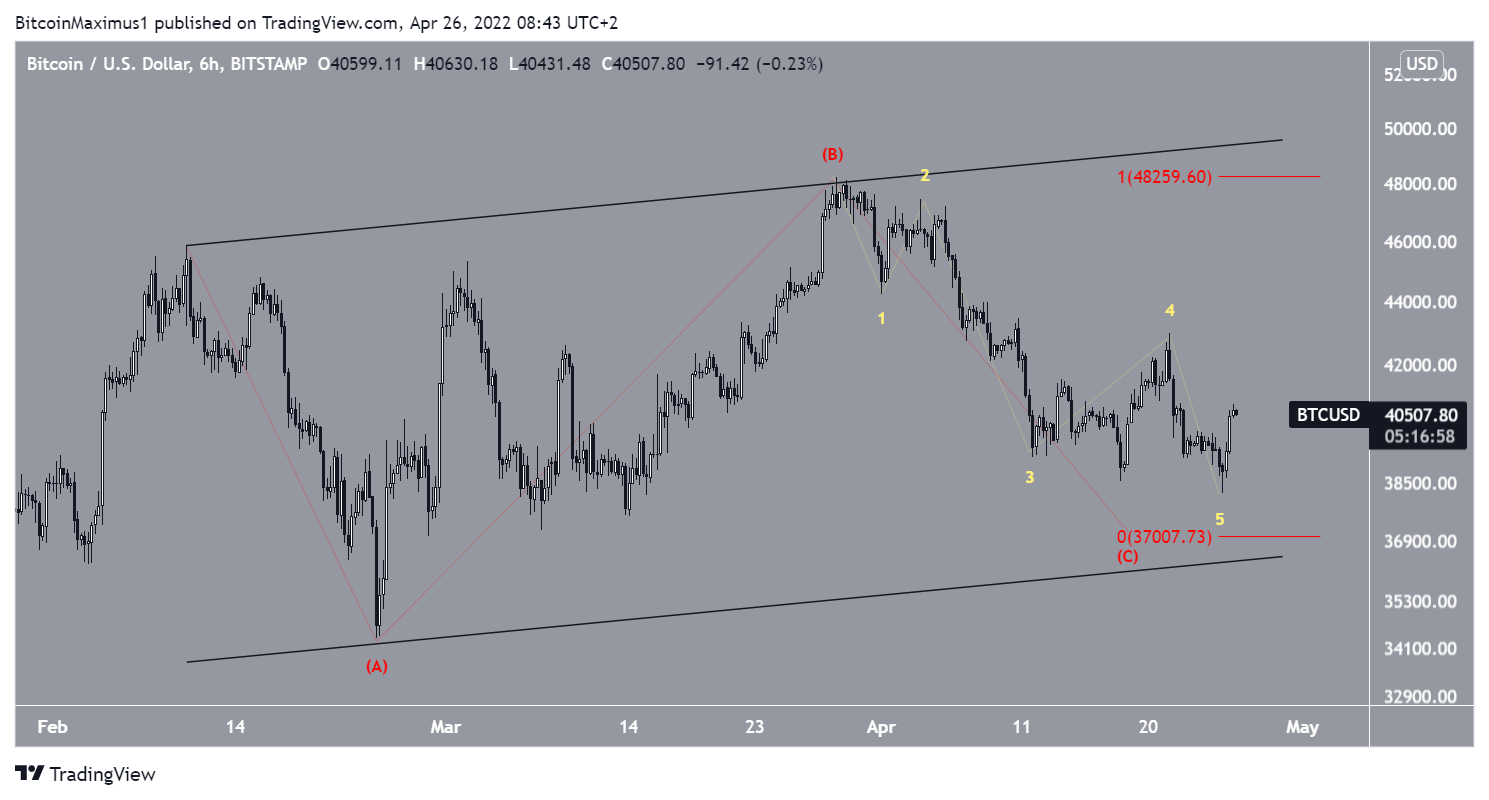
BTC wave count analysis
The wave count suggests that BTC has been decreasing in what is likely an A-B-C corrective structure (red) since Feb. 10. The sub-wave count is shown in yellow in the chart below.
While waves A and C failed to maintain a 1:1 ratio, it’s possible that the correction is now complete. The reason for this is what looks like a completed sub-wave count.
If so, the long-term wave count suggests that a significant upward move would now be likely to follow.
For BeInCrypto’s previous Bitcoin (BTC) analysis, click here
Disclaimer
In line with the Trust Project guidelines, this price analysis article is for informational purposes only and should not be considered financial or investment advice. BeInCrypto is committed to accurate, unbiased reporting, but market conditions are subject to change without notice. Always conduct your own research and consult with a professional before making any financial decisions. Please note that our Terms and Conditions, Privacy Policy, and Disclaimers have been updated.
