


The Bitcoin (BTC) price has resumed the upward movement initiated on April 26. So far it’s managed to recover back to just under $55,000.
Despite the ongoing bounce, technical indicators for bitcoin do not yet confirm a bullish trend reversal.
BTC bounces at support
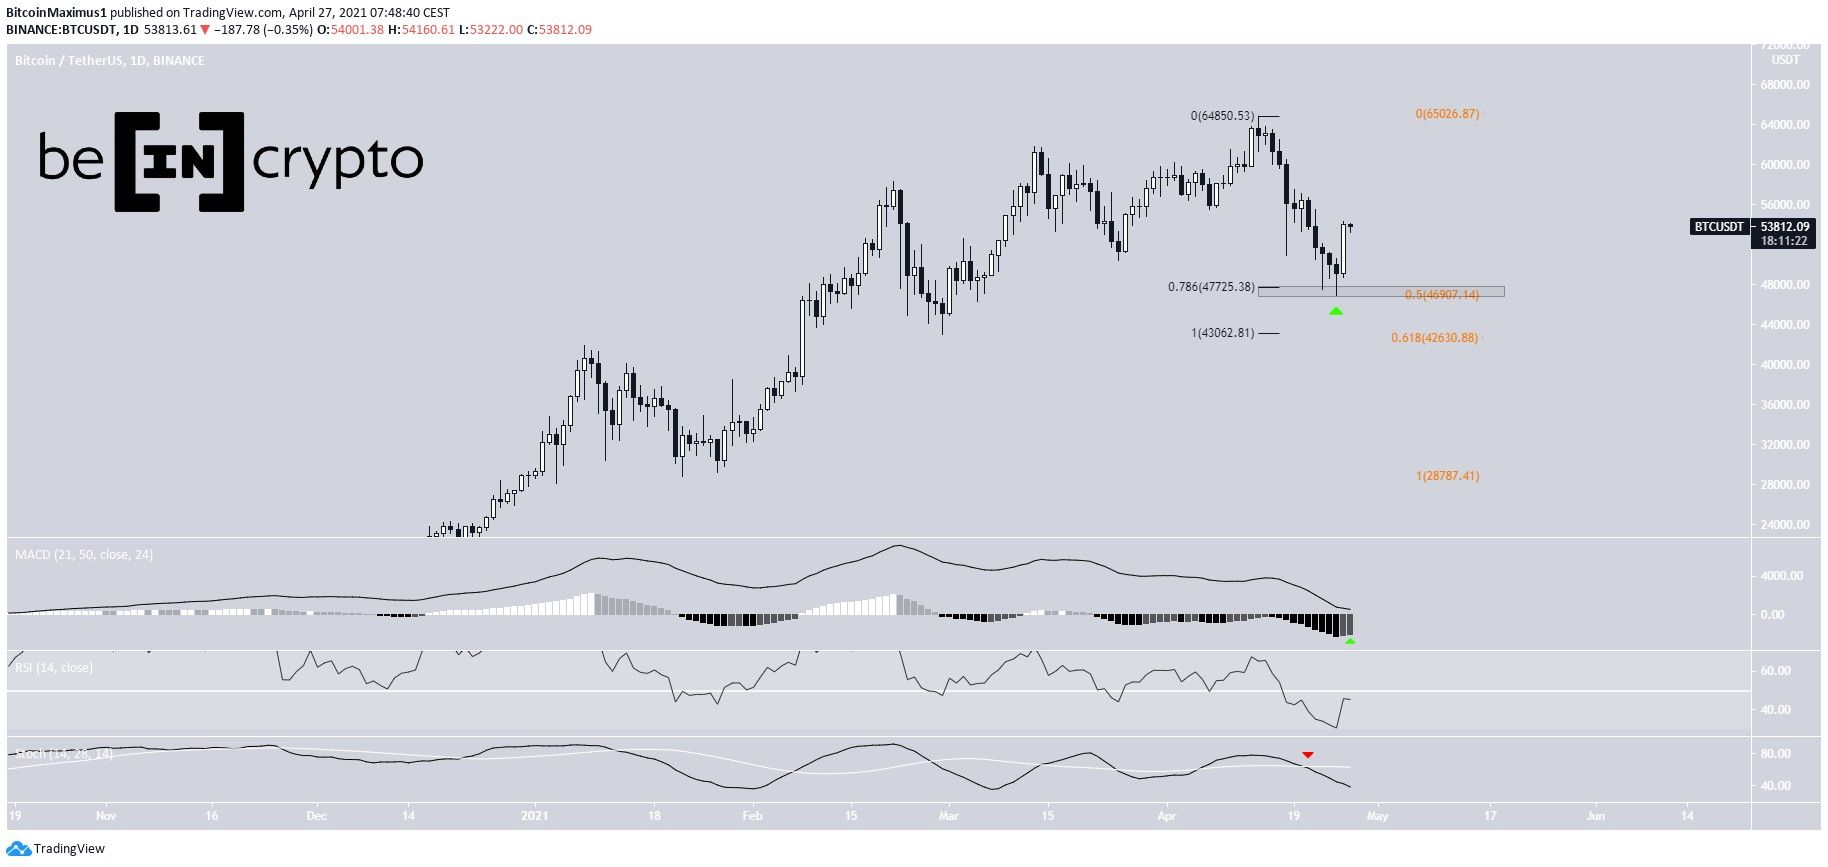
BTC has been moving downwards since April 14, when it reached a high of $64,854. The downward movement accelerated on April 18. On April 25, it reached a local low of $46,930 before bouncing.
Currently, BTC is trading near $54,700.
Technical indicators are still bearish. Despite increasing, the RSI is still below 50. Furthermore, the Stochastic oscillator has just made a bearish cross.
While the MACD is close to giving a bullish reversal signal, it has not done so yet. Even if it were to cross bullish, it would be the only bullish reading from the three indicators.
Despite the bearishness from indicators, the bounce occurred at a significant confluence of Fib support levels. The area is found between $46,900-$47,725, created by the 0.786 (black) and 0.5 (orange) Fib retracement levels. The former encompasses the most recent portion of the move while the latter is made up of the longer-term portion.
Ongoing BTC retracement
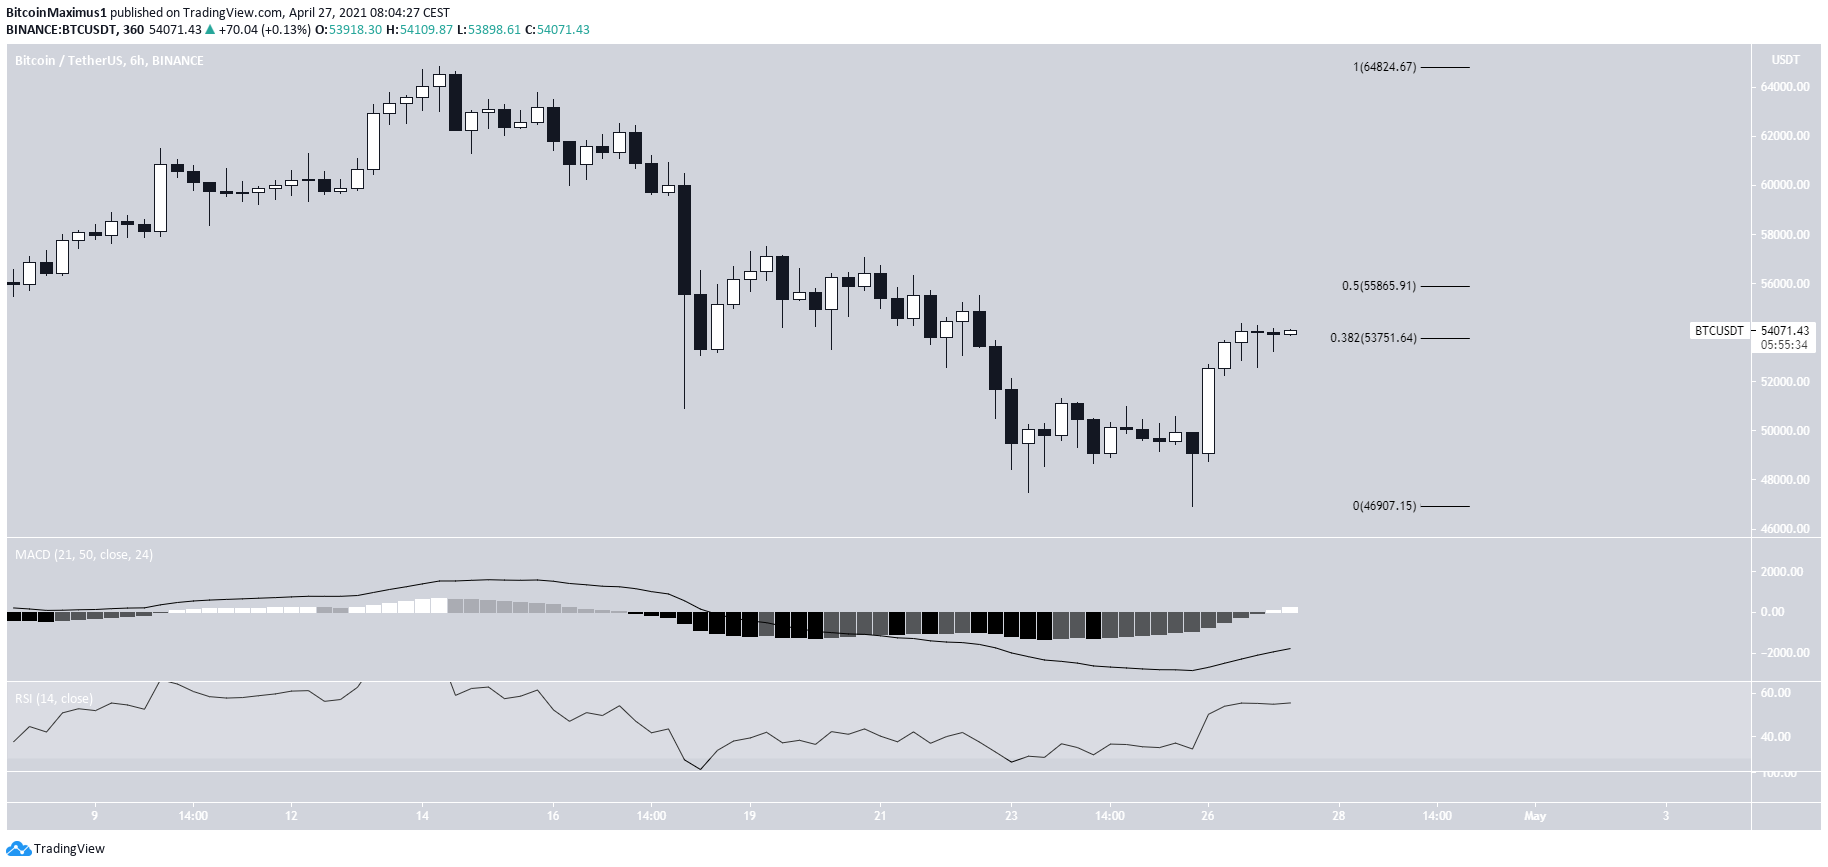
The six-hour chart shows resistance between $53,571-$55,865. These are the 0.382 and 0.5 Fib retracements of the most recent downward movement. Both are also horizontal resistance areas.
Short-term indicators are bullish. Despite this, some type of rejection would be expected once BTC reaches the latter resistance area.
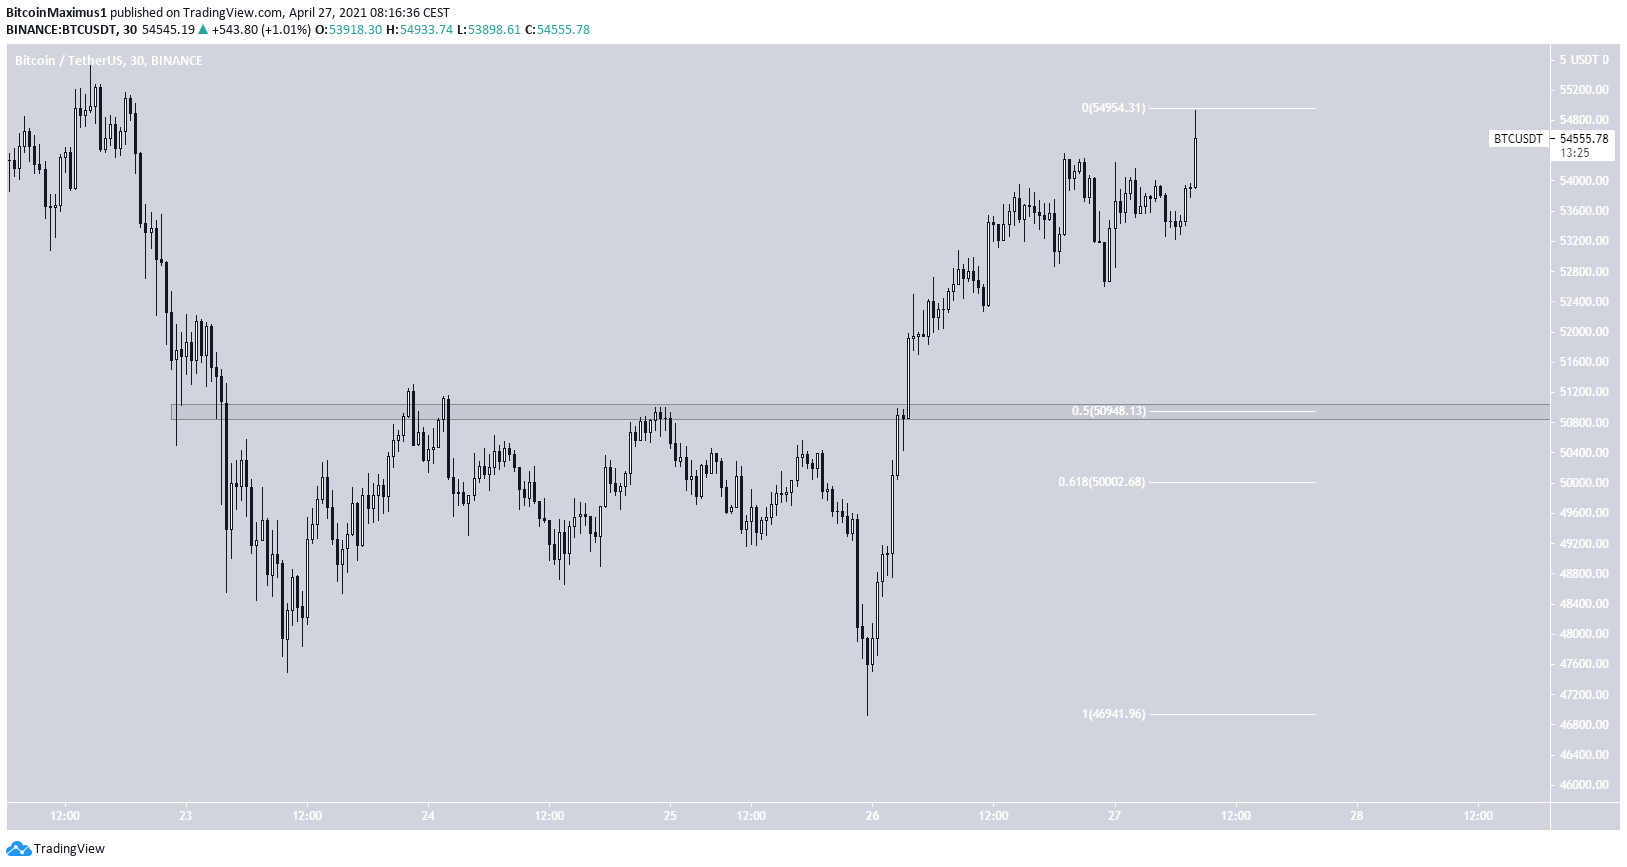
If the price retraces, there should be strong support at $51,000. This is a horizontal area which previously acted as resistance and has now likely turned to support. In addition, it’s the 0.5 Fib retracement level.
Conclusion
It’s not yet clear if the BTC low is in or if another downward movement awaits. However, the short-term chart appears to be bullish.
For BeInCrypto’s latest bitcoin (BTC) analysis, click here.


