


Bitcoin (BTC) has broken out from a short-term resistance level but is still trading inside a longer-term corrective pattern.
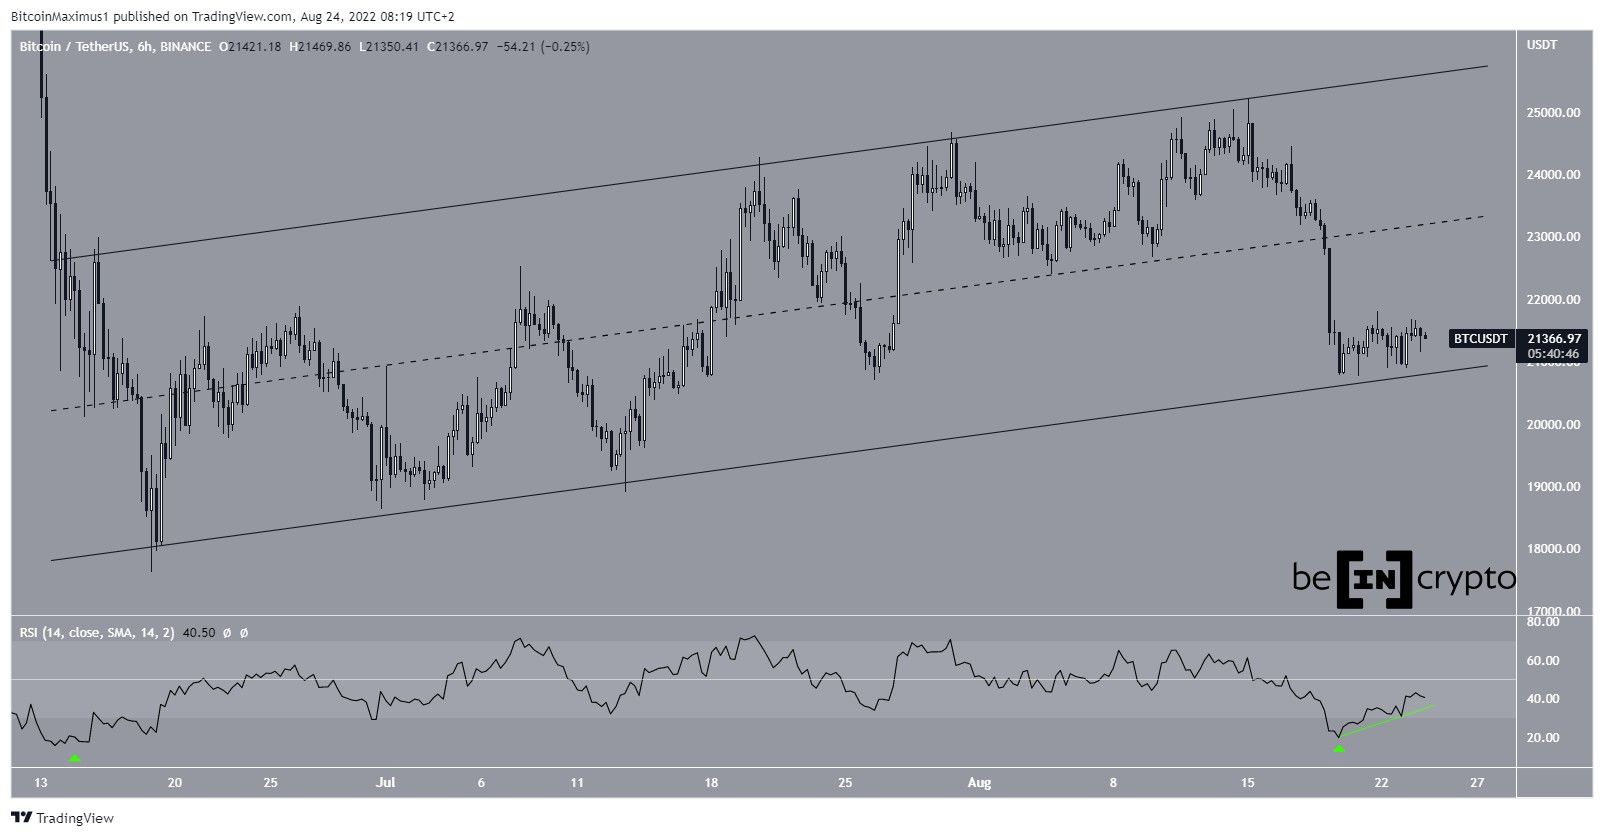
Bitcoin has been trading inside an ascending parallel channel since June 18, when it reached a low of $17,622. Ascending parallel channels usually contain corrective movements. So, an eventual breakdown from it would seem to be the most likely scenario.
Additionally, Bitcoin is trading in the lower portion of this channel, very close to its support line. This increases the chance that the movement is corrective and a breakdown will occur.
Corresponding RSI
The six-hour RSI is giving a bullish reading, since it has moved outside of its oversold territory. The previous time this occurred (green icon), it led to a significant upward movement in the price.
While the RSI has created a higher low, the price has done the same, thus there is no bullish divergence present. So, whether BTC manages to move above the midline of the channel or breaks down below its support line will likely determine the direction of the trend.
Short-term BTC movement
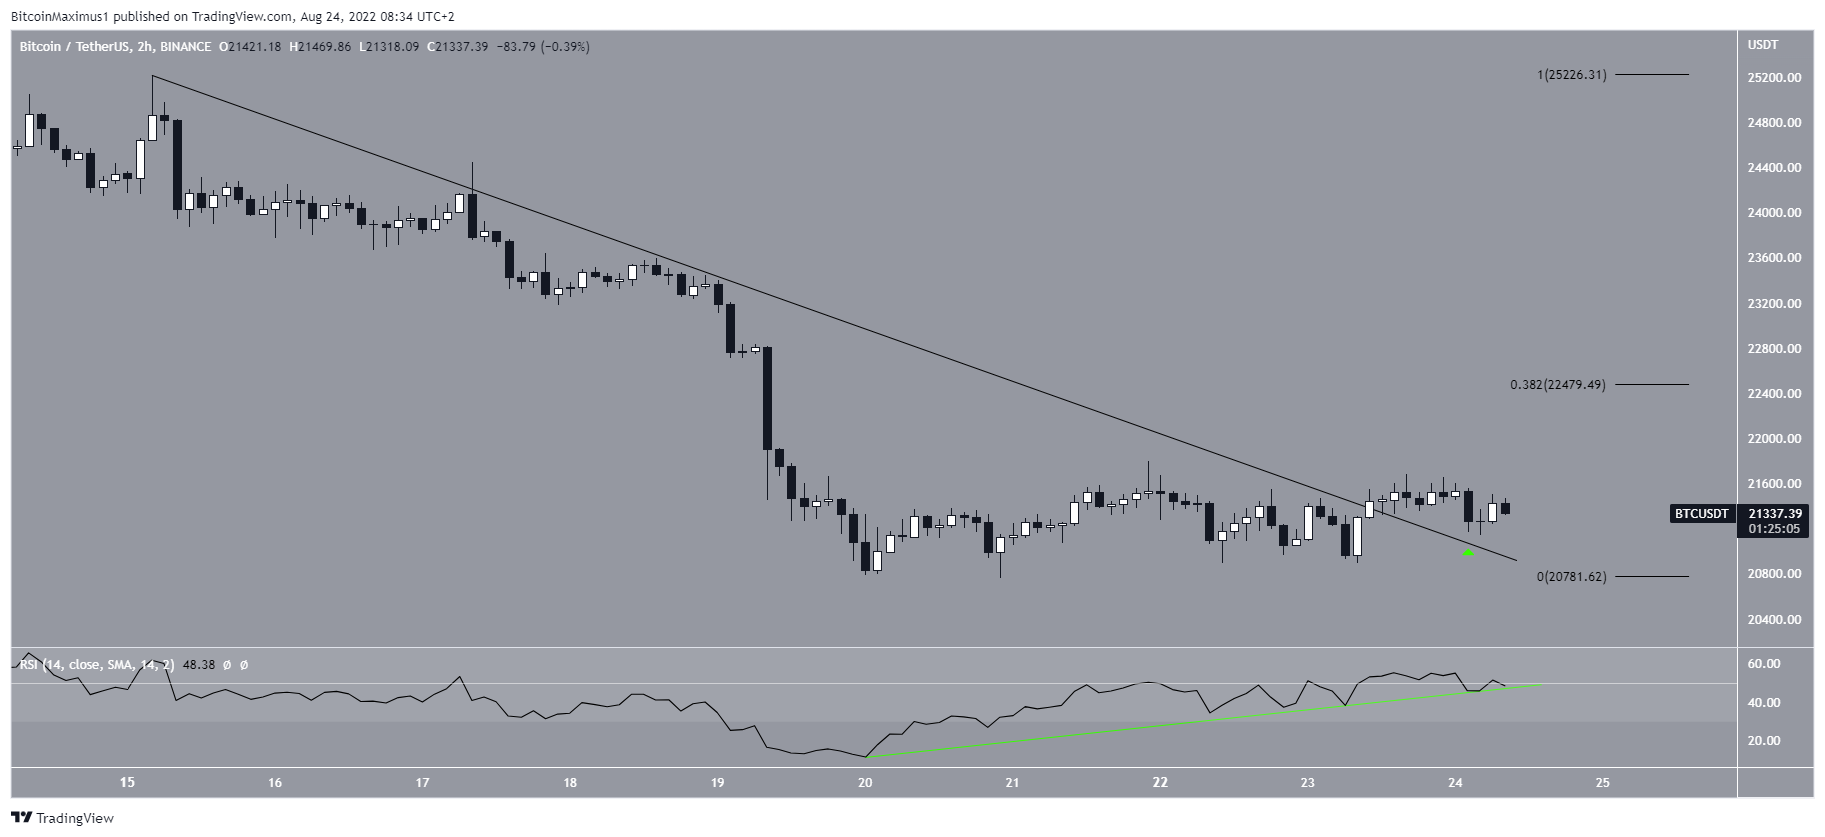
The two-hour chart shows that BTC has broken out from a descending resistance line that had been in place since Aug. 15. Currently, it is in the process of validating it as support, after which the upward movement may continue.
The two-hour RSI supports the continuation of the upward movement since the indicator is attempting to break out above 50. Moreover, it is following an ascending support line to create an ascending triangle pattern.
If a rebound in price follows, the closest resistance area would be found at $22,470. This target is the 0.382 Fib retracement resistance level. Even if Bitcoin gets there, however, it still would not be enough to reclaim the midline of the previously outlined channel.
For Be[in]Crypto’s previous Bitcoin (BTC) analysis, click here


