Bitcoin (BTC) is holding on above the $20,000 minor support area and is showing bullish signs in the short-term. The long-term trend remains undetermined.
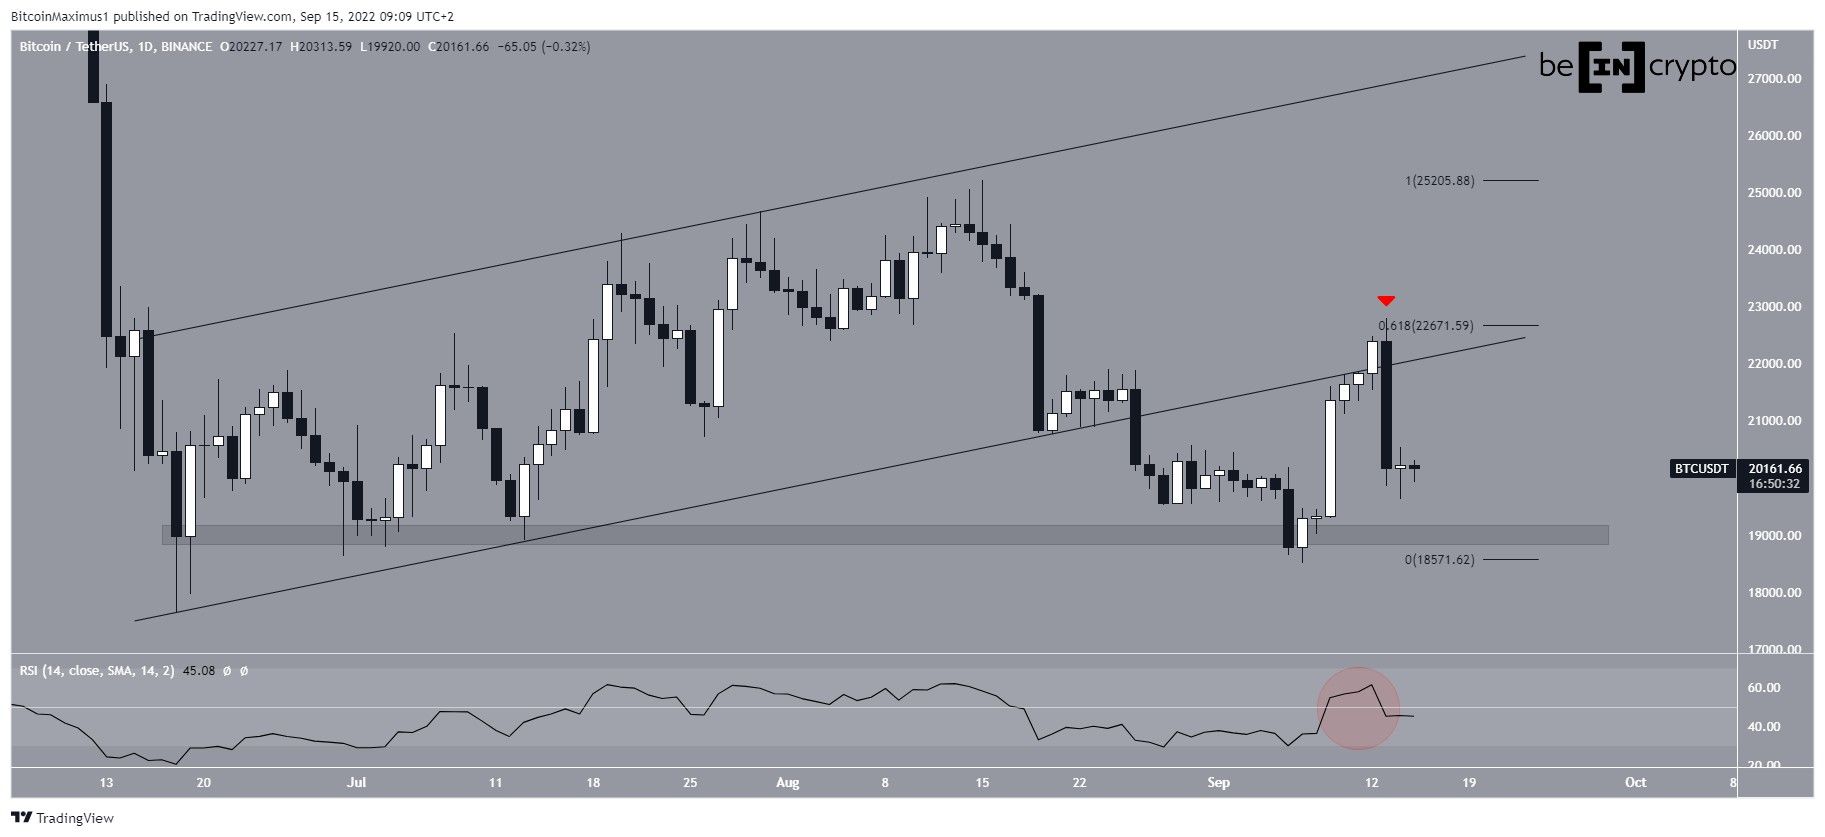
BTC has been decreasing since reaching a high of $22,799 on Sept. 13. The same day, it created a large bearish engulfing candlestick.
The decrease served to validate the $22,670 area as resistance and also tested the previous support line of the channel (red icon).
Additionally, the decrease caused an RSI movement below 50 (red circle). Now, the RSI movement above and below 50 is a sign of an undetermined trend.
If Bitcoin continues to fall, the closest support area would be at $19,000.
Future BTC movement
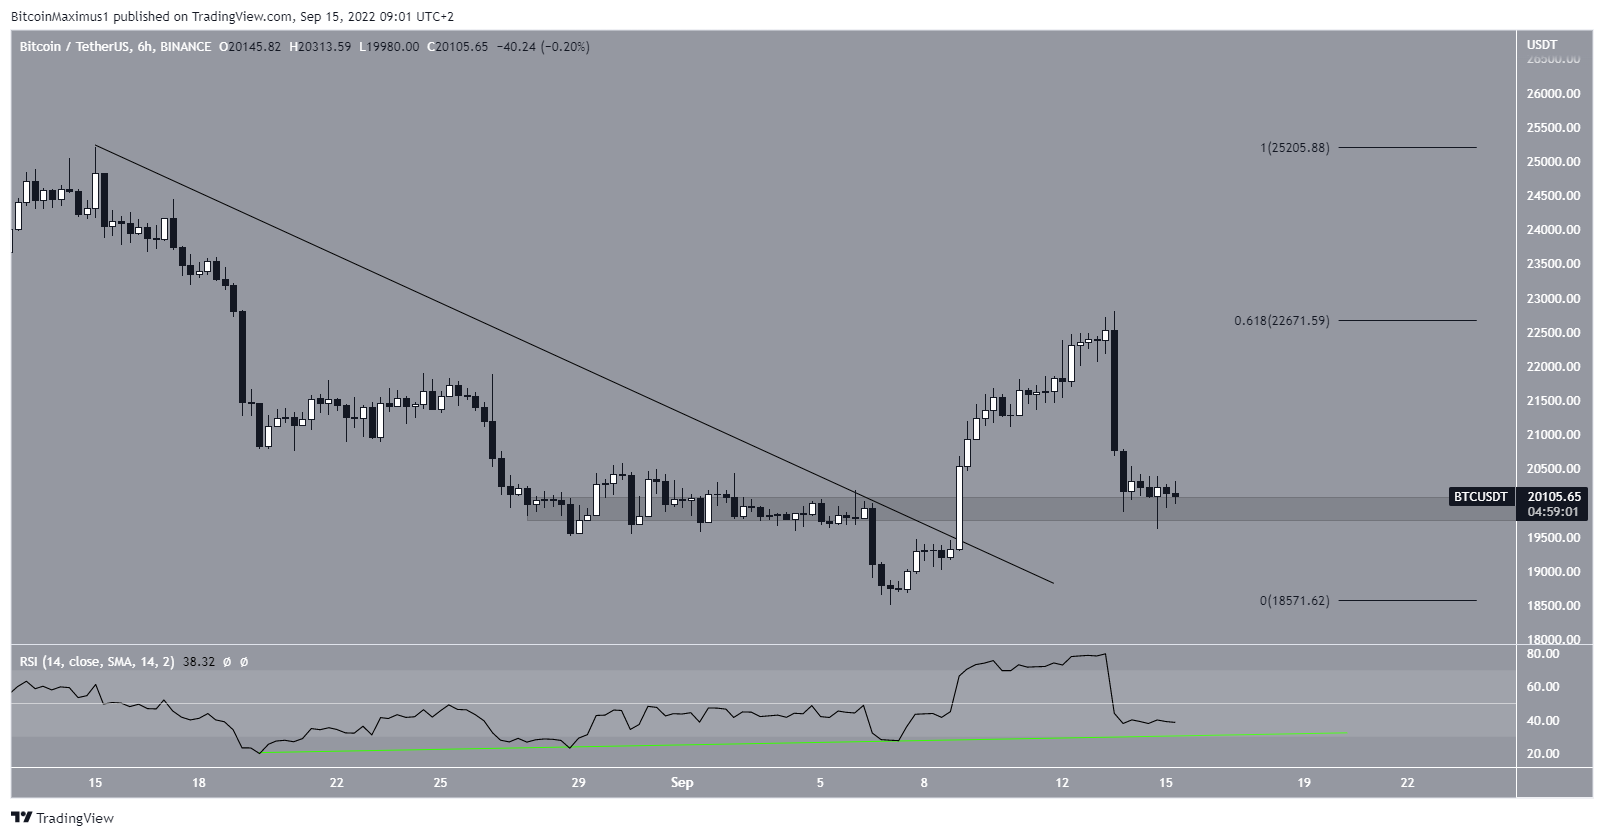
The six-hour chart provides a slightly more bullish outlook, however it fails to decisively confirm a direction for the trend.
While Bitcoin has broken out from a descending resistance line, it failed to sustain its upward movement and has fallen to the minor $20,000 support area.
The slight bullishness comes from the fact that the bullish divergence trend line (green line) in the RSI is still intact.
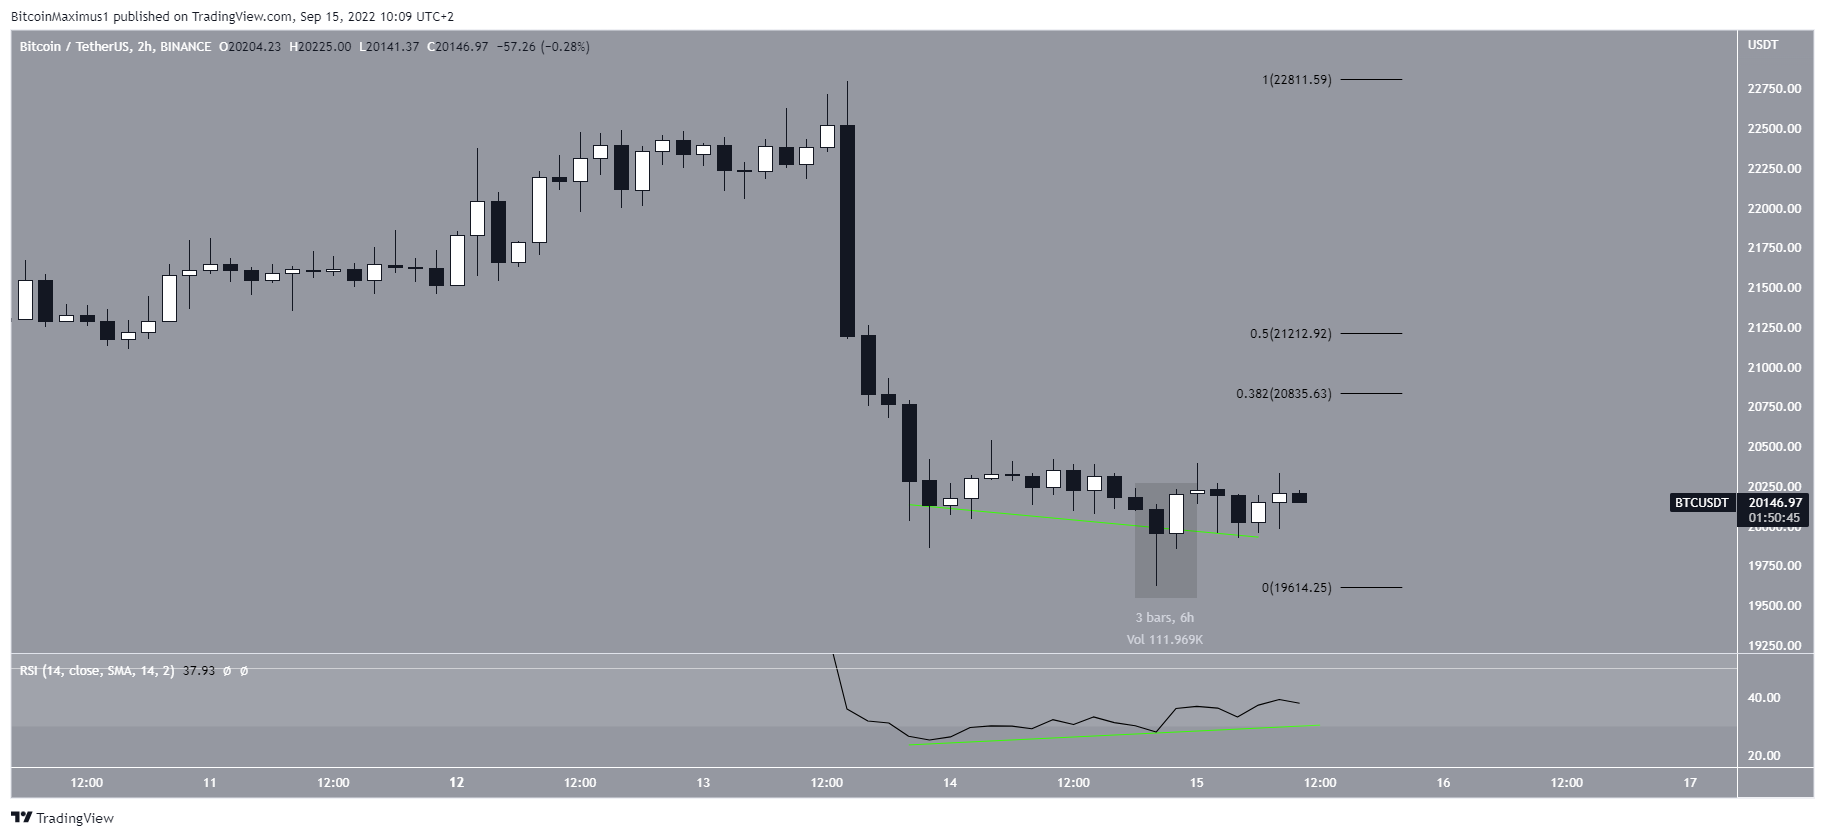
The two-hour chart supports the possibility of a bounce. The two main reasons for this are the bullish divergence in the RSI and the creation of a bullish hammer and then bullish engulfing candlestick (highlighted).
So, it is possible that an increase towards the 0.382-0.5 Fib retracement resistance levels at $20,840 to $21,200 will occur prior to another drop.
Relative unrealized loss
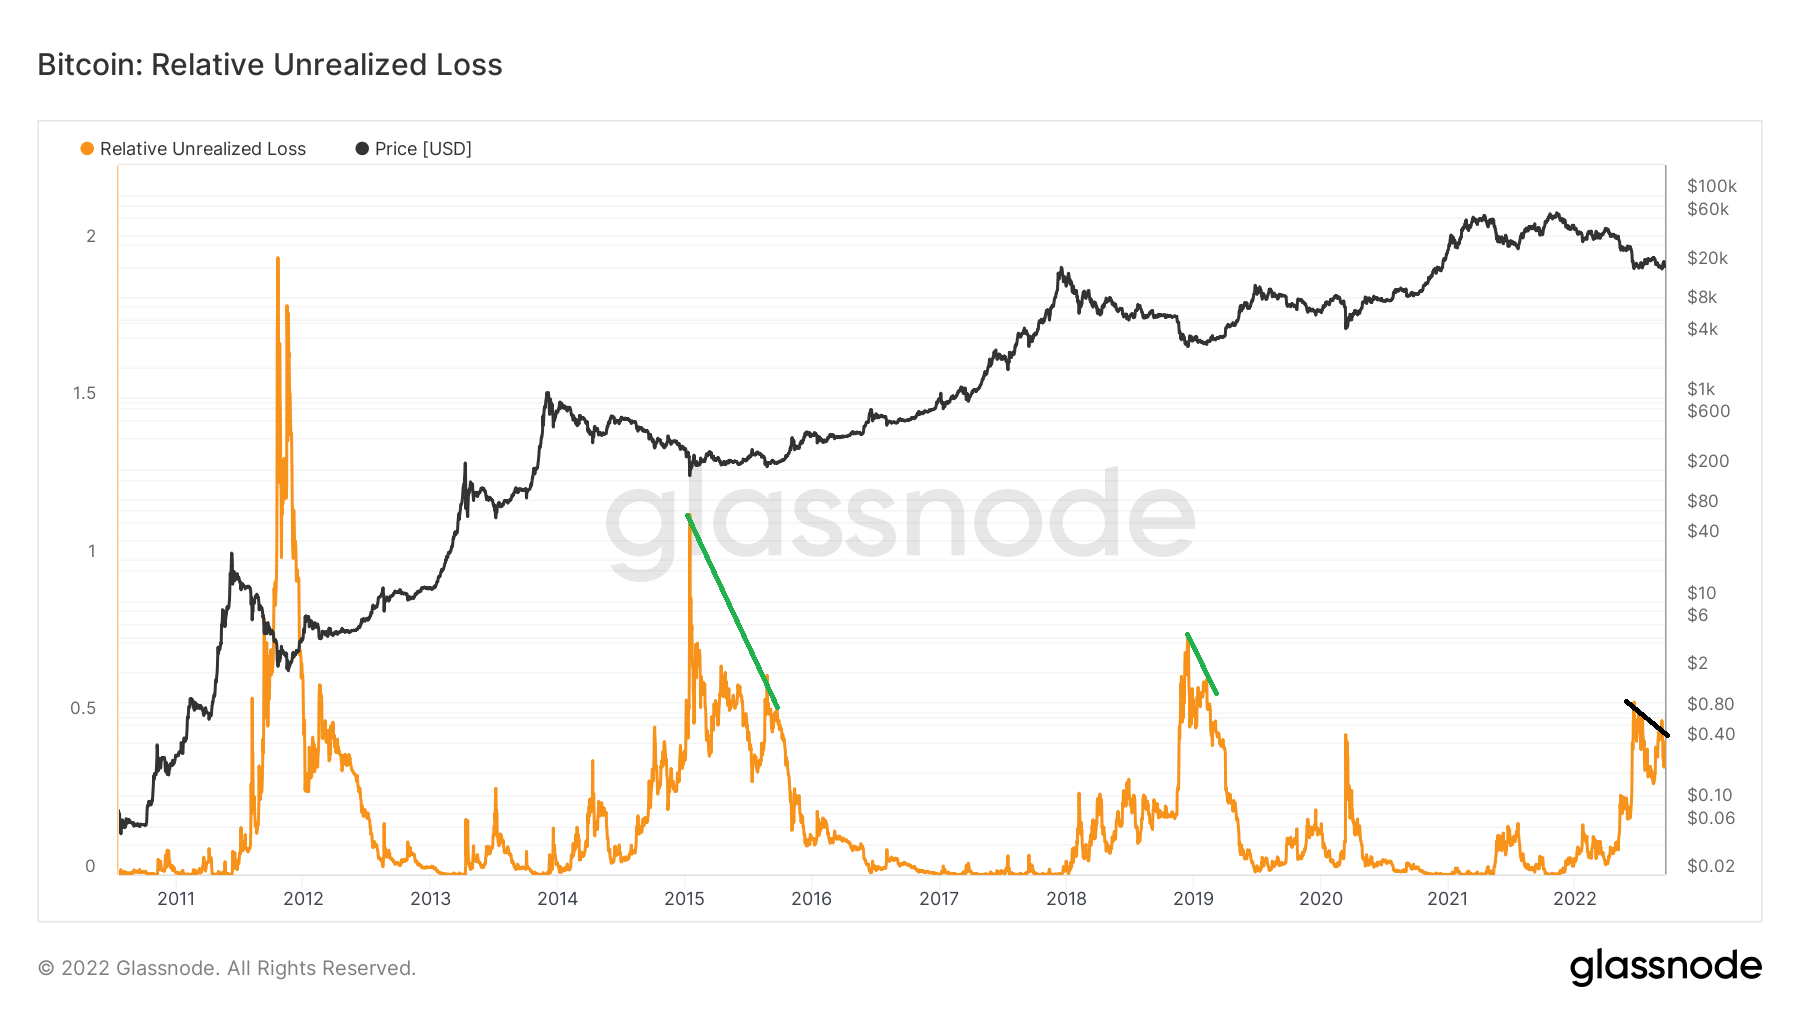
An interesting indicator that could provide insight to the direction of the future movement is the Relative Unrealized Loss indicator. The indicator measures the total loss of all coins in existence whose price at the time they last moved was higher than the current price. Afterward, the indicator is normalized by the market capitalization.
Relative Unrealized Loss usually spikes sharply during market bottoms. This was visible in 2015 at a value of 1.14, in 2018 at a value of 0.75 and in 2020 at a value of 0.44. Such high values are considered signs of capitulation.
In 2022, the indicator has so far reached a high of 0.54.
The interesting development is the presence of a slightly lower high. Historically, RUL has made a slightly lower high (green lines) while BTC has made a slightly higher high each time prior to a new market cycle beginning. The time it took for this high to form has varied, ranging from three to seven months.
In 2022, the lower high was made between June and Sept. (black line).
So, if previous history is followed, it would mean that the price has already reached a bottom or is instead very close to doing so.
For Be[in]Crypto’s previous Bitcoin (BTC) analysis, click here
Disclaimer
In line with the Trust Project guidelines, this price analysis article is for informational purposes only and should not be considered financial or investment advice. BeInCrypto is committed to accurate, unbiased reporting, but market conditions are subject to change without notice. Always conduct your own research and consult with a professional before making any financial decisions. Please note that our Terms and Conditions, Privacy Policy, and Disclaimers have been updated.


