


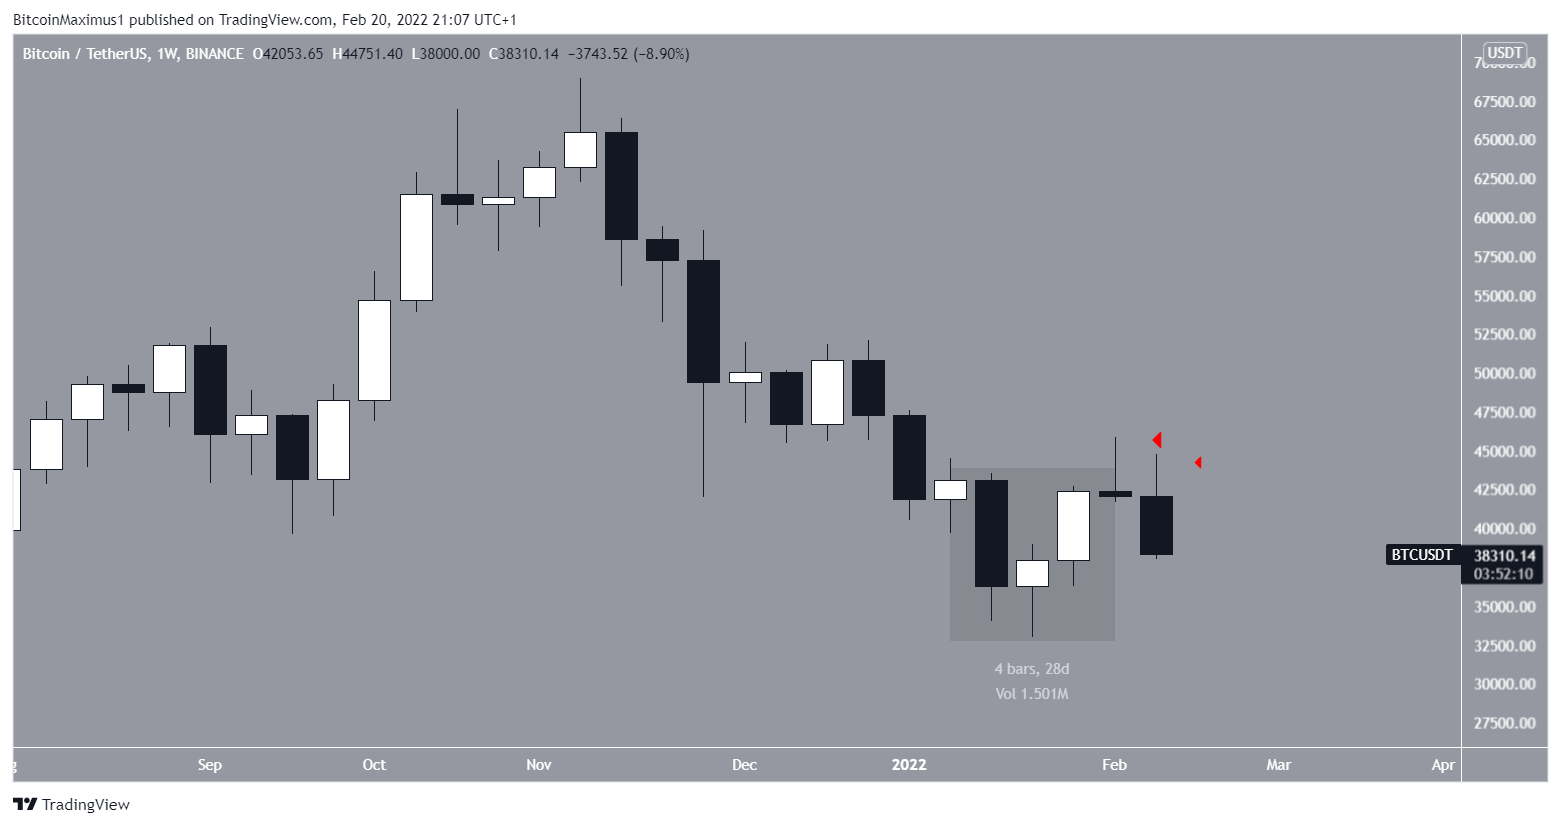
Bitcoin (BTC) decreased considerably during the week of Feb 13-20 and broke down from both short and long-term support levels.
BTC had been increasing since the week of Jan 24-31. The upward movement initially looked like it would create a morning star candlestick, which is normally considered a bullish reversal pattern.
However, the trend reversed the following weeks and BTC created two bearish candlesticks with long upper wicks (red icons). These effectively invalidated the possibility of a morning star pattern.
The price is now approaching its Jan 24 lows of $32,917.
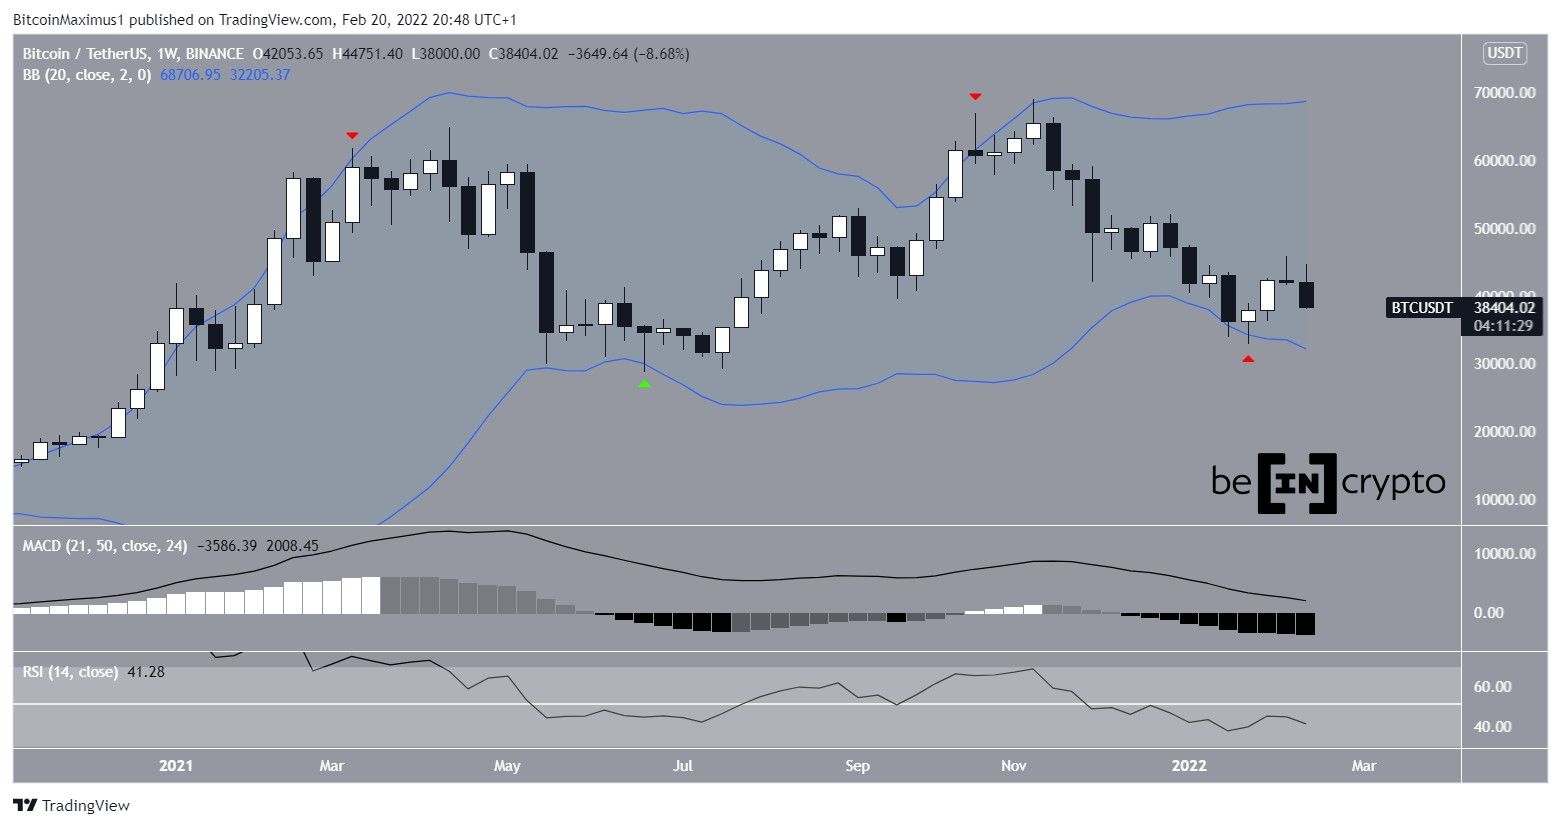
Technical indicators in the weekly time frame are mixed, but leaning bearish.
The MACD and RSI are both bearish and decreasing. The bearishness is especially visible in the RSI, which has fallen below 50. The RSI is a momentum indicator and readings below 50 are considered signs of a weakening trend.
On the bullish side, BTC fell below the lower Bollinger band on Jan 24. Deviations below the band (green icon) have previously led to significant bullish trend reversals and vice versa.
BTC struggles for support
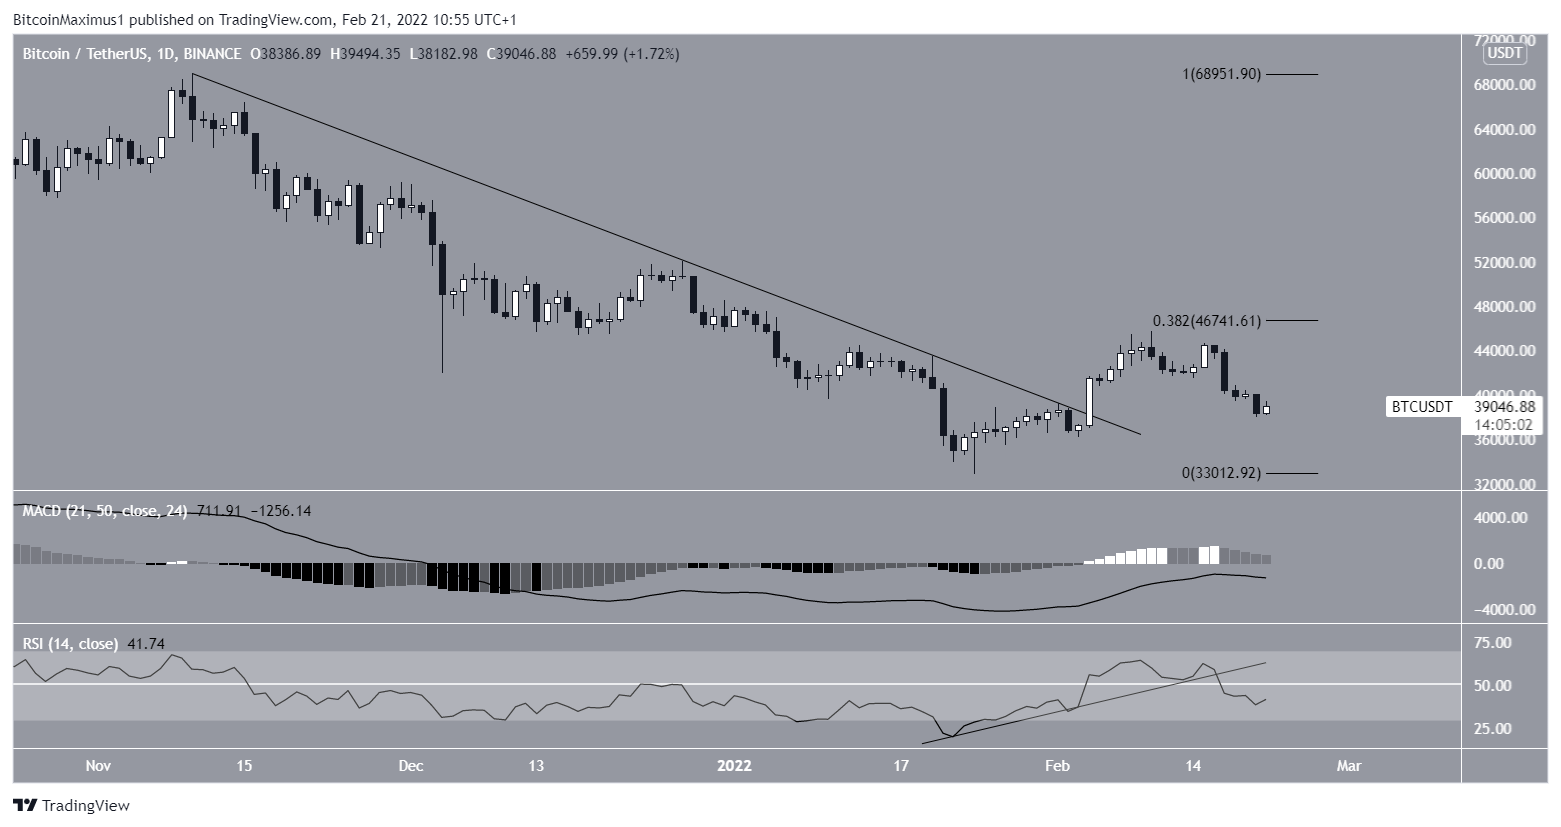
The daily chart also provides mixed readings but is still leaning bearish.
The MACD and RSI are both decreasing. This dip is more notable in the latter since it has both broken down from an ascending support line and fallen below the 50-line. As outlined above, this is a development that is associated with bearish trends.
On the bullish side, BTC did break out from a descending resistance line on Feb 4. This could mean that the current decrease could just be a retracement in response to the breakout.
However, the ensuing upward movement after the breakout was minuscule, failing to even reach the 0.382 Fib retracement resistance level.
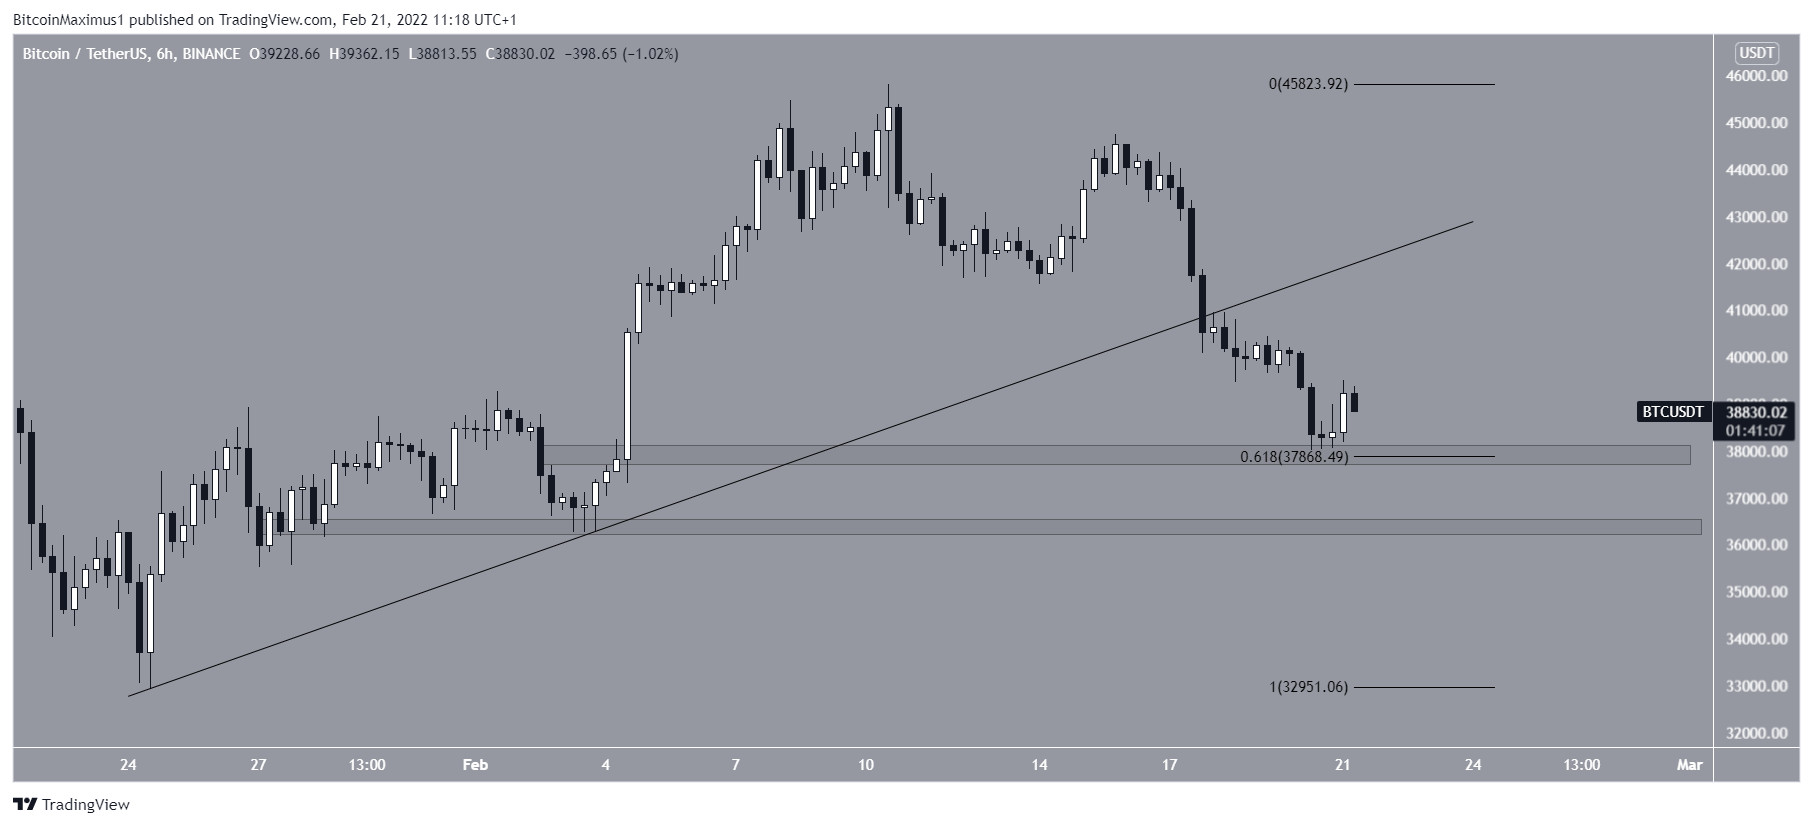
Moving on to the six-hour time frame, BTC has broken down from an ascending support line and is now attempting to find support.
It has rebounded slightly at the 0.618 Fib retracement support level at $37,860. This is both a horizontal and Fib support level.
The next support level is found at $36,200, created by a horizontal support area.
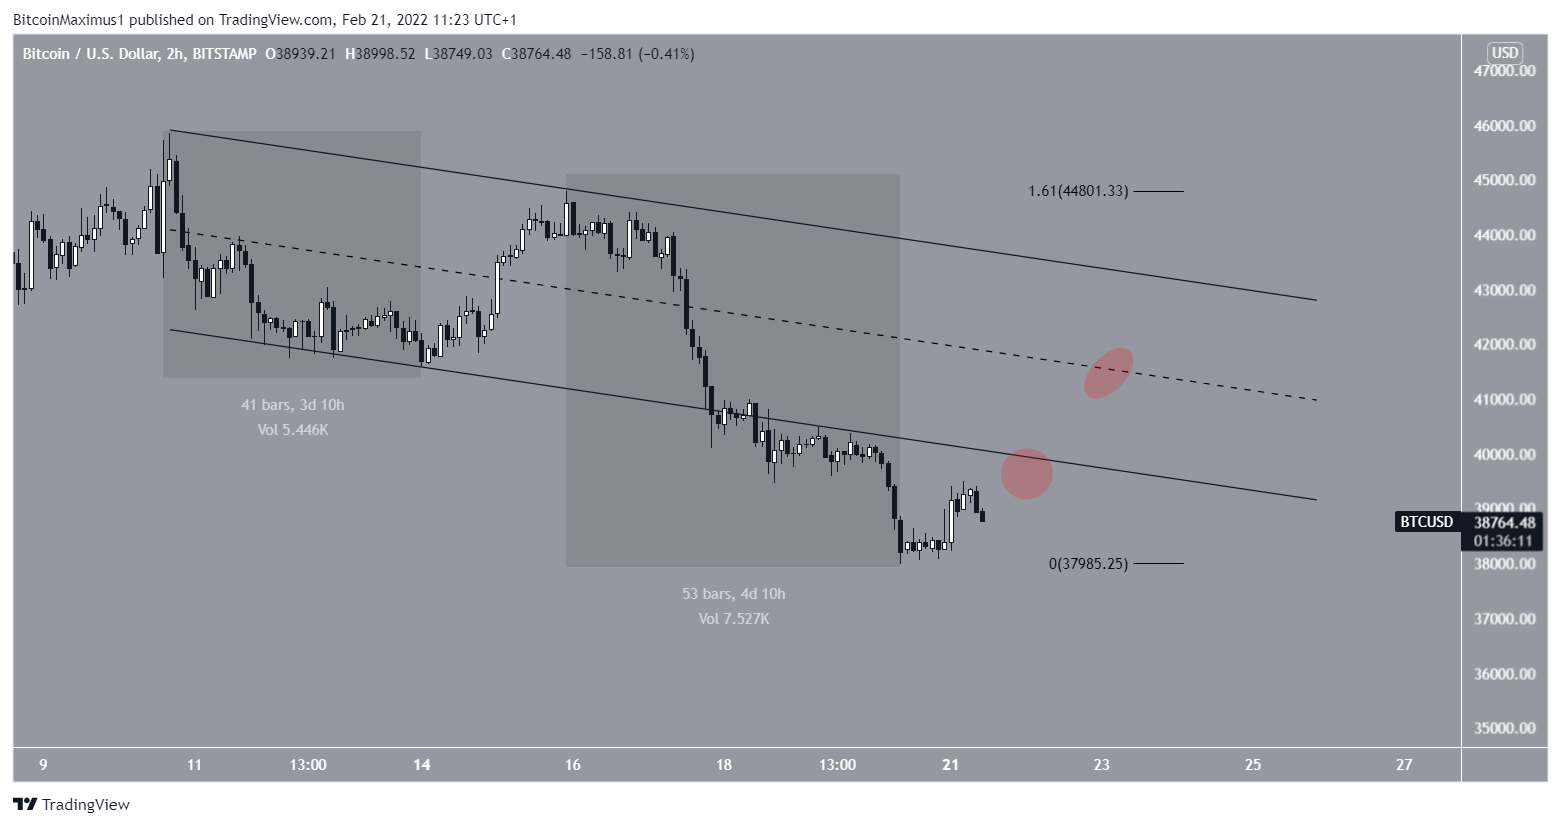
Short-term movement
Finally, the two-hour chart shows that the two downward movements have so far had a 1:1.61 ratio. Therefore, it’s possible that the pattern is complete and a reversal will follow.
If a reversal occurs, the $39,600 and $40,600 levels would be expected to act as resistance.
However, as it stands, there are no signs of a longer-term bullish reversal. Therefore, it seems likely that BTC will get rejected at these levels once more.
For BeInCrypto’s previous Bitcoin (BTC) analysis, click here


