


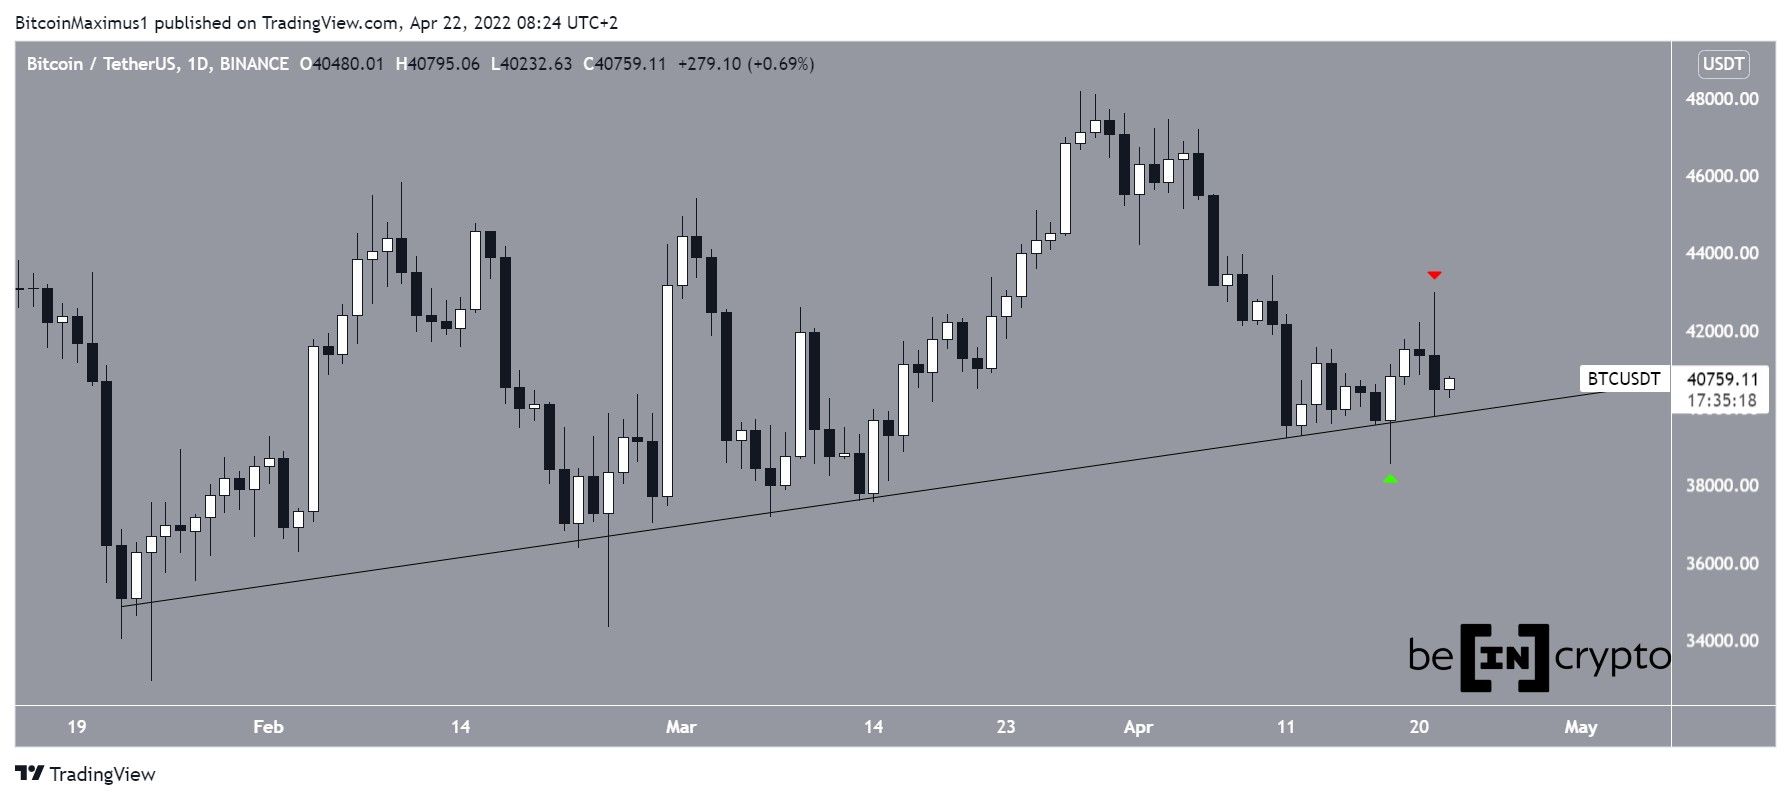
Bitcoin (BTC) decreased significantly on April 21, creating a long upper wick and briefly falling below $40,000.
Bitcoin has been trading above an ascending support line since Jan. 24. The line has been validated numerous times so far, most recently on April 18 (green icon).
While this led to a high of $42,976 on April 21, BTC fell considerably the same day and created a bearish candlestick with a long upper wick (red icon). The price is now back at the ascending support line, negating the majority of the gains that were made on April 18.
Indicator readings
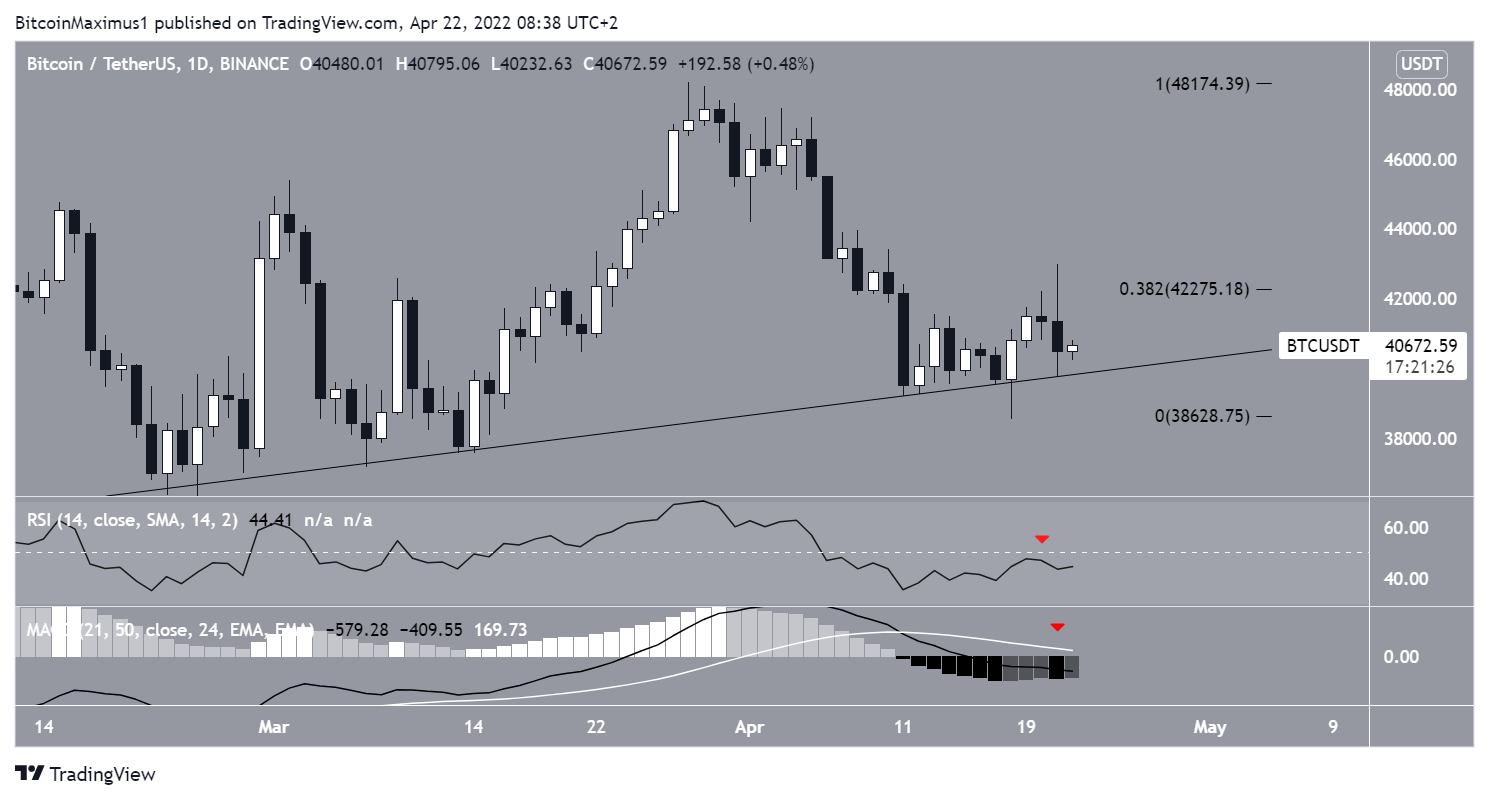
Technical indicators in the daily time frame are mostly bearish. The reason for this is that the RSI is below 50 and the MACD is negative (red icons). These are both considered signs of a bearish trend.
Furthermore, BTC seems to have been rejected by the 0.382 Fib retracement resistance level at $42,300. This was the catalyst for creating the long upper wick.
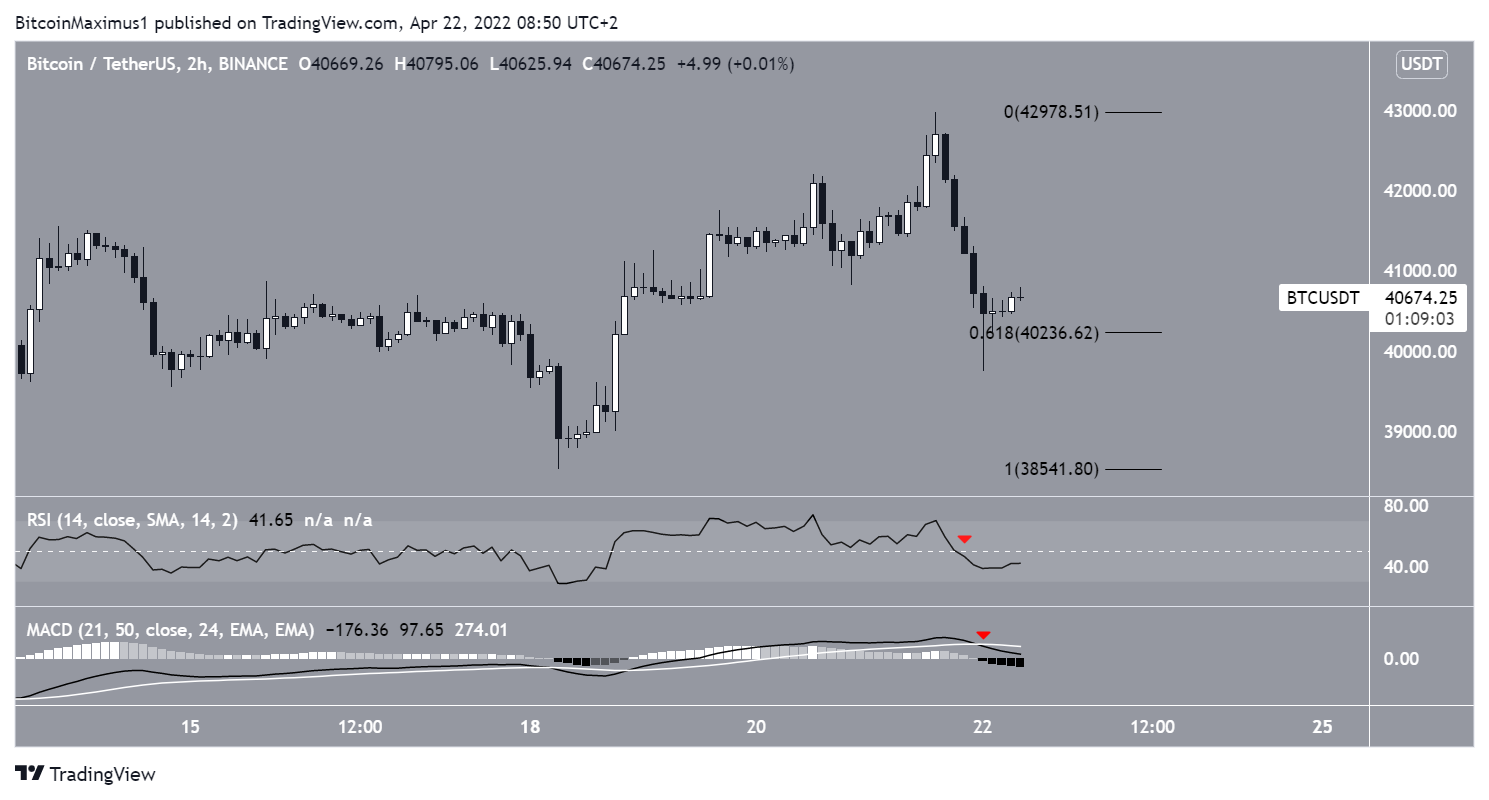
The two-hour chart shows that BTC has bounced at the 0.618 Fib retracement support level at $40,250. However, the RSI and MACD are both decreasing.
Similar to the daily time frame, the RSI is below 50 and the MACD is negative (red icons).
Therefore, technical indicators are bearish in both the daily and two-hour time frames.
BTC wave count analysis
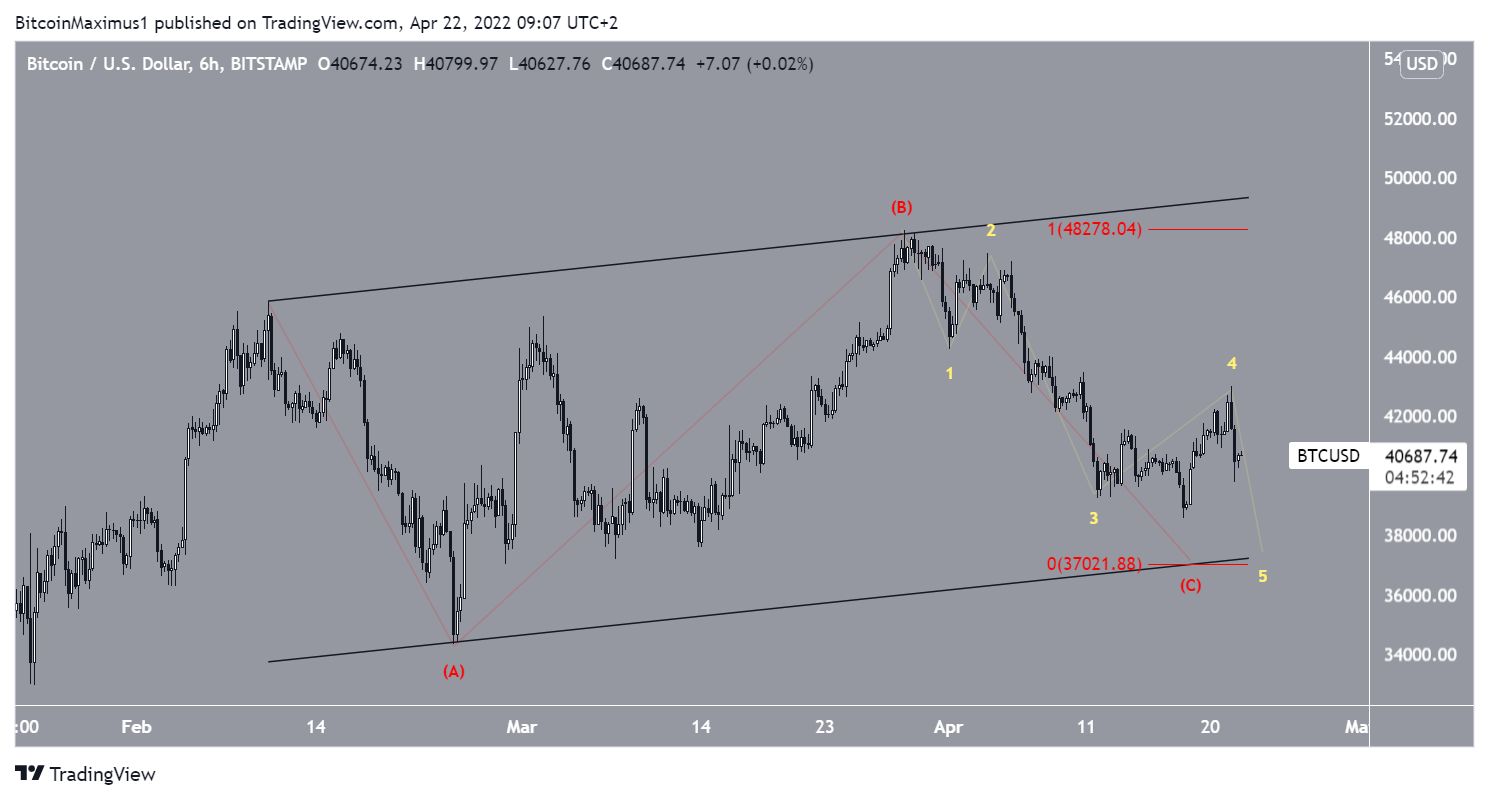
The wave count suggests that BTC has been moving in an A-B-C corrective pattern (red) since Feb. 10. If true, it looks to currently be in the C wave. Giving waves A and C a 1:1 ratio would lead to a low of $37,000.
The sub-wave count is shown in yellow. It suggests that BTC has just completed sub-wave four and has now begun sub-wave five, which is expected to end at the $37,000 level. This would also validate the support line of the current ascending parallel channel.
After the pattern is complete, a significant upward move would be likely.
For BeInCrypto’s previous Bitcoin (BTC) analysis, click here


