
The bitcoin (BTC) price bounced on April 7 and created a bullish engulfing candlestick the next day.
Bitcoin is expected to break out from the current short-term pattern and the $59,500 area after.
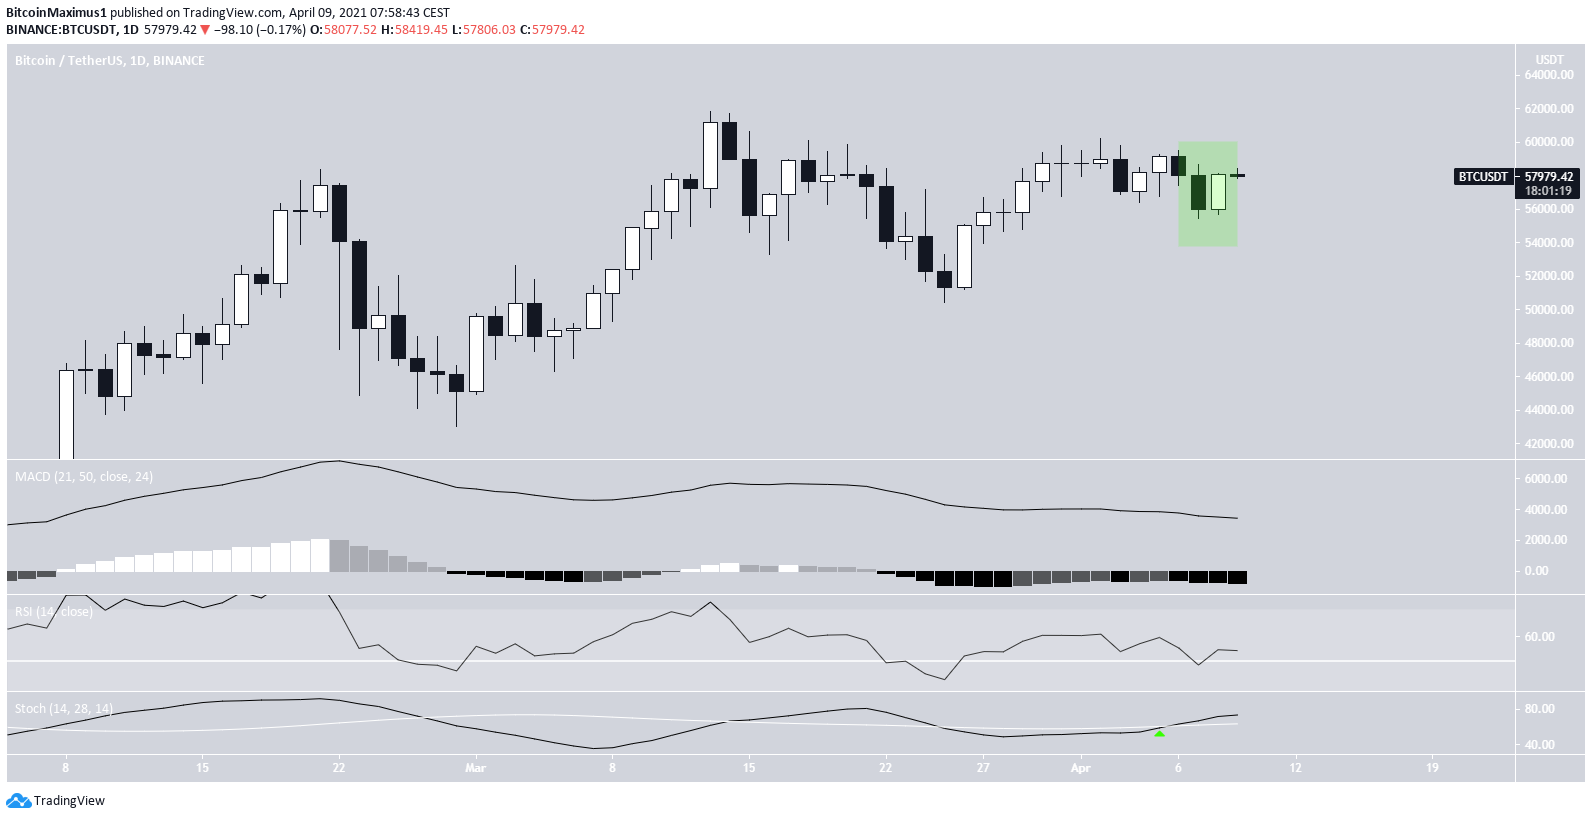
Bullish engulfing candlestick
Despite BTC decreasing on April 7, it created a bullish engulfing candlestick the next day. This is a sign that buying strength is increasing. The April 7 dip has now completely retraced.
The RSI is trending above 50 and the Stochastic oscillator has made a bullish cross.
Therefore, it’s likely that the trend is bullish.
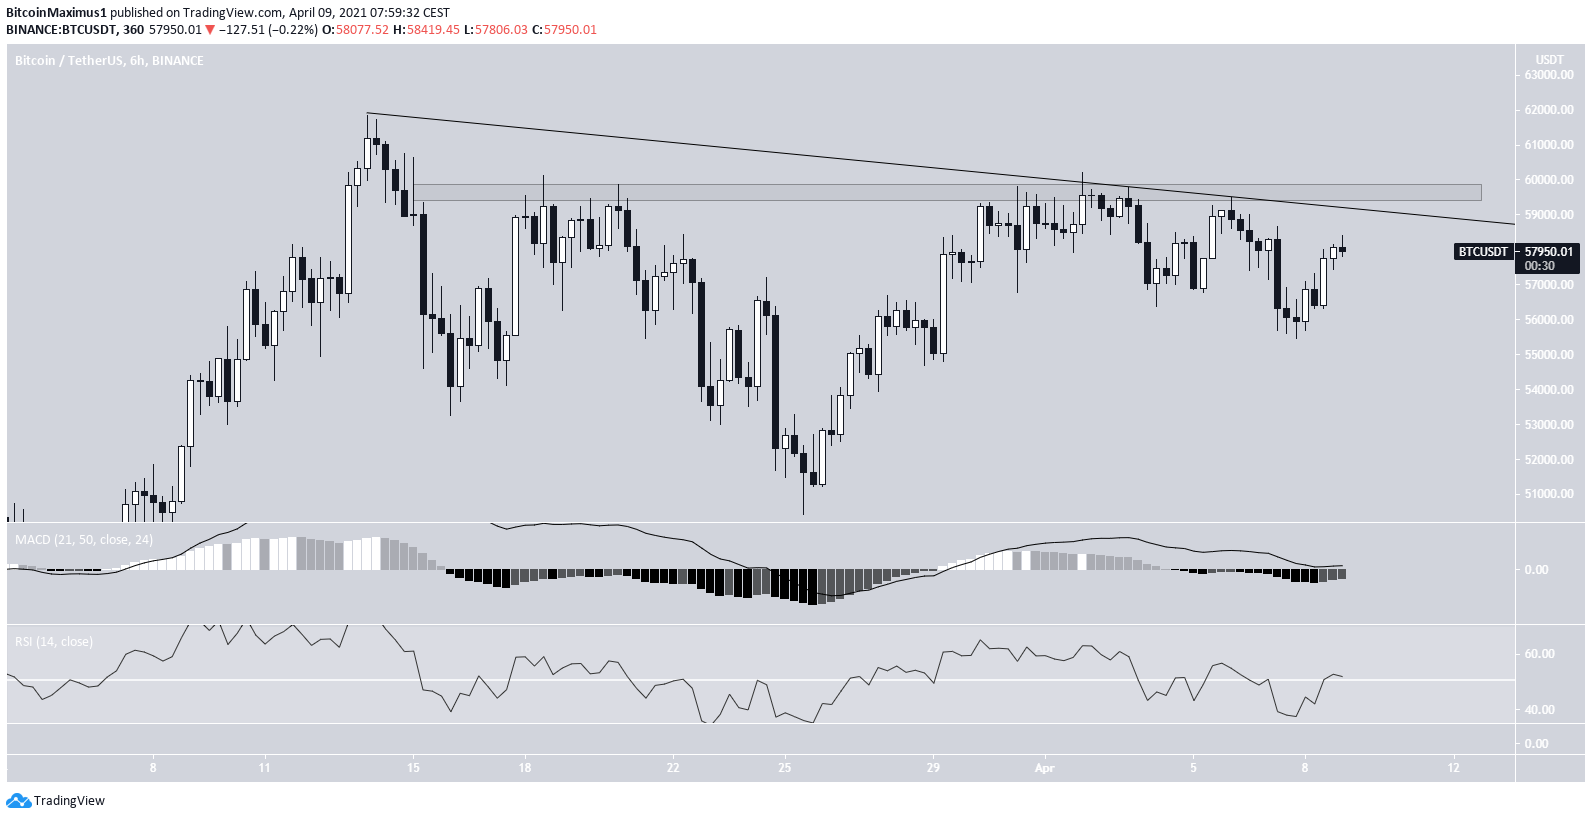
Bitcoin parallel channel
Since reaching an all-time high of $61,844 on March 13, BTC has been following a descending resistance line. So far, the line has rejected BTC multiple times—most recently on April 4.
Currently, BTC is making another attempt at breaking out above the line.
The MACD and RSI are both increasing, therefore a breakout is likely. An increase above this line and the $59,500 area would confirm that the trend is bullish.
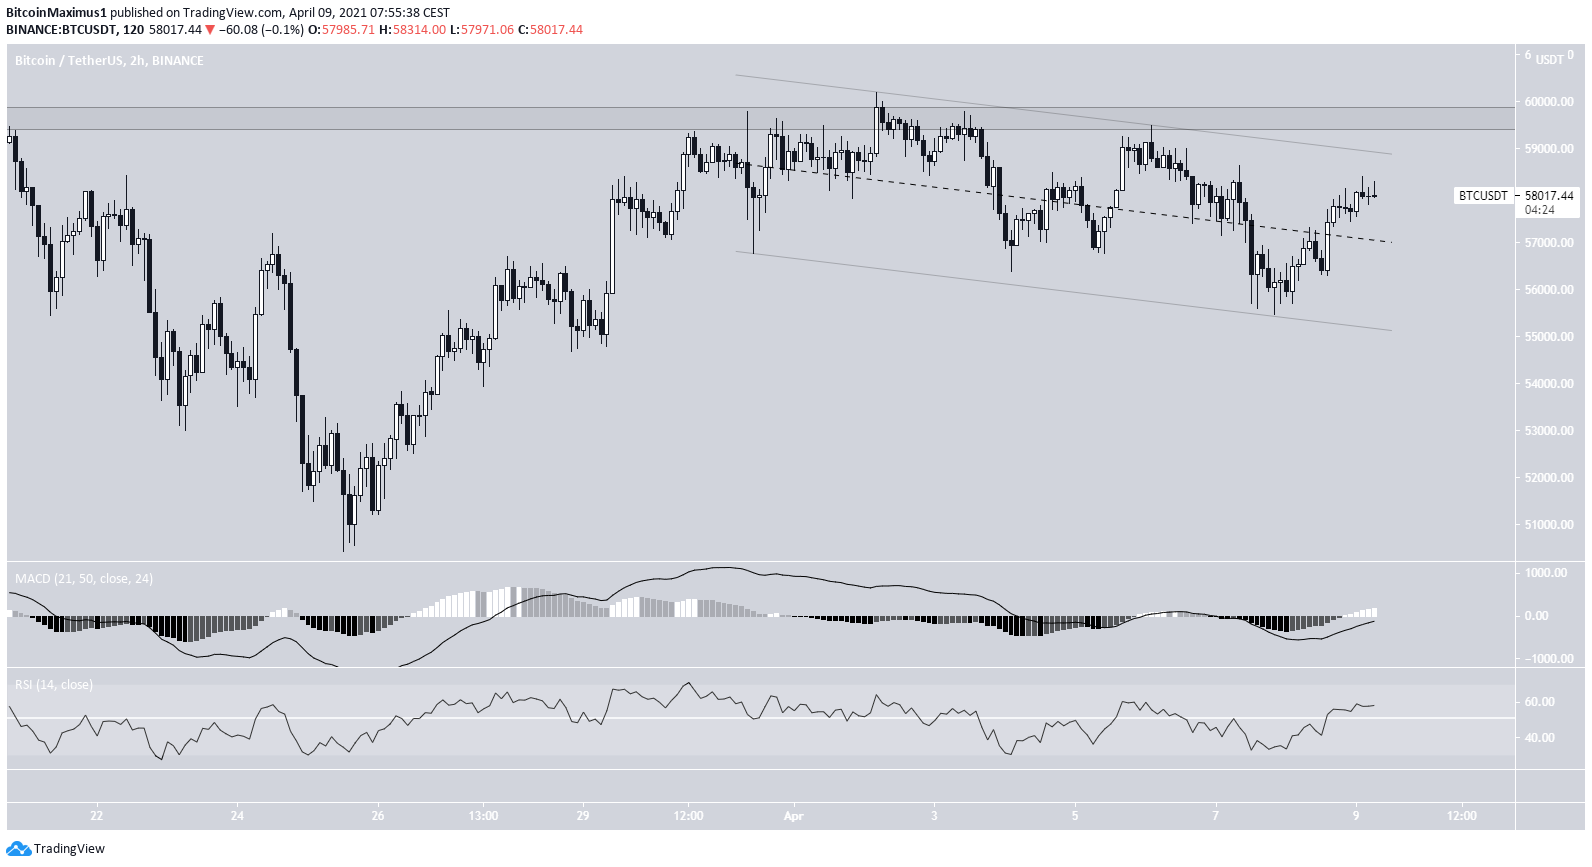
The two-hour chart shows that BTC is trading inside a descending parallel channel. This is often a corrective pattern.
Therefore, the daily, six-hour, and two-hour charts are in alignment.
A breakout from the channel and the $59,500 resistance area afterward is expected.
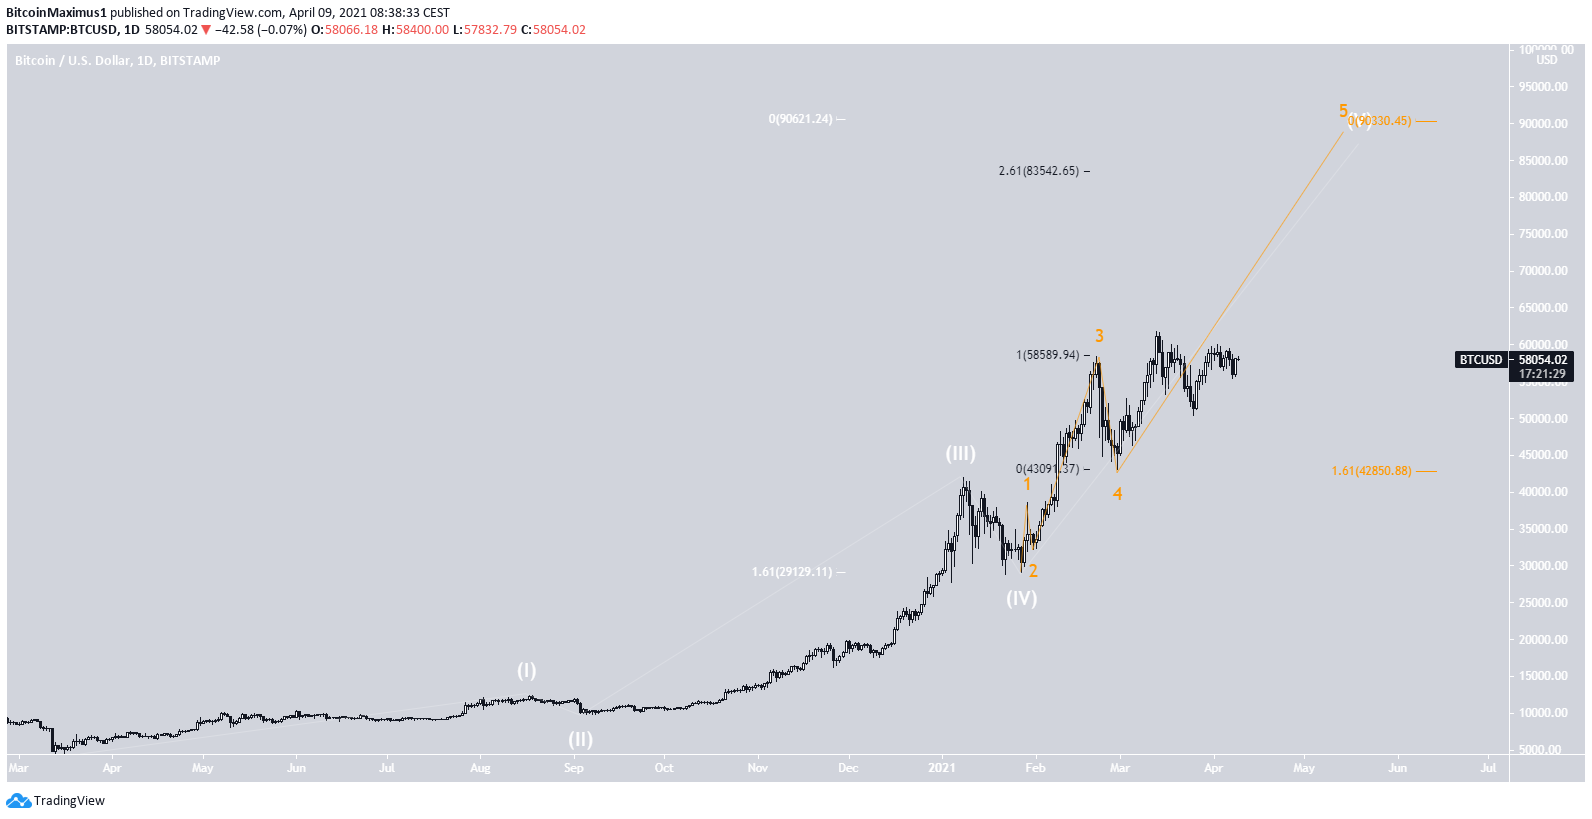
Bitcoin wave count
The wave count suggests that BTC is in an extended sub-wave five (orange) of a long-term wave five (white).
A potential target for the top of this movement is located between $83,500-$90,500.
The target is found using a combination of Fib projections (white and orange) and an external Fib retracement (black).
Conclusion
Both long and short-term indicators suggest that bitcoin will break out from the short-term channel. An upward move that takes the price above $59,500 is expected to follow.
For BeInCrypto’s latest bitcoin (BTC) analysis, click here.
