

On Sept 16, Bitcoin rebounded from a horizontal support level and reached a high of $48,557 before falling slightly.
Today, it bounced at the $47,000 minor support area and broke out from a descending resistance line shortly afterwards.
BTC resumes ascent
On Sept 13, BTC bounced at the $43,950 support area and has been moving upwards since. The upward move culminated with a high of $48,557 on Sept 16. A short-term decrease followed after.
Despite the significant bounce, technical indicators in the daily time-frame are still somewhat bearish.
The MACD attempted to make a bullish reversal (green icon), but failed to do so because of yesterday’s bearish candlestick close. The RSI gives a neutral reading since it is at the 50-line and the Supertrend shows a bearish trend (red line).
Therefore, the rebound appears to be just a relief rally rather than a bullish trend reversal.

Short-term movement
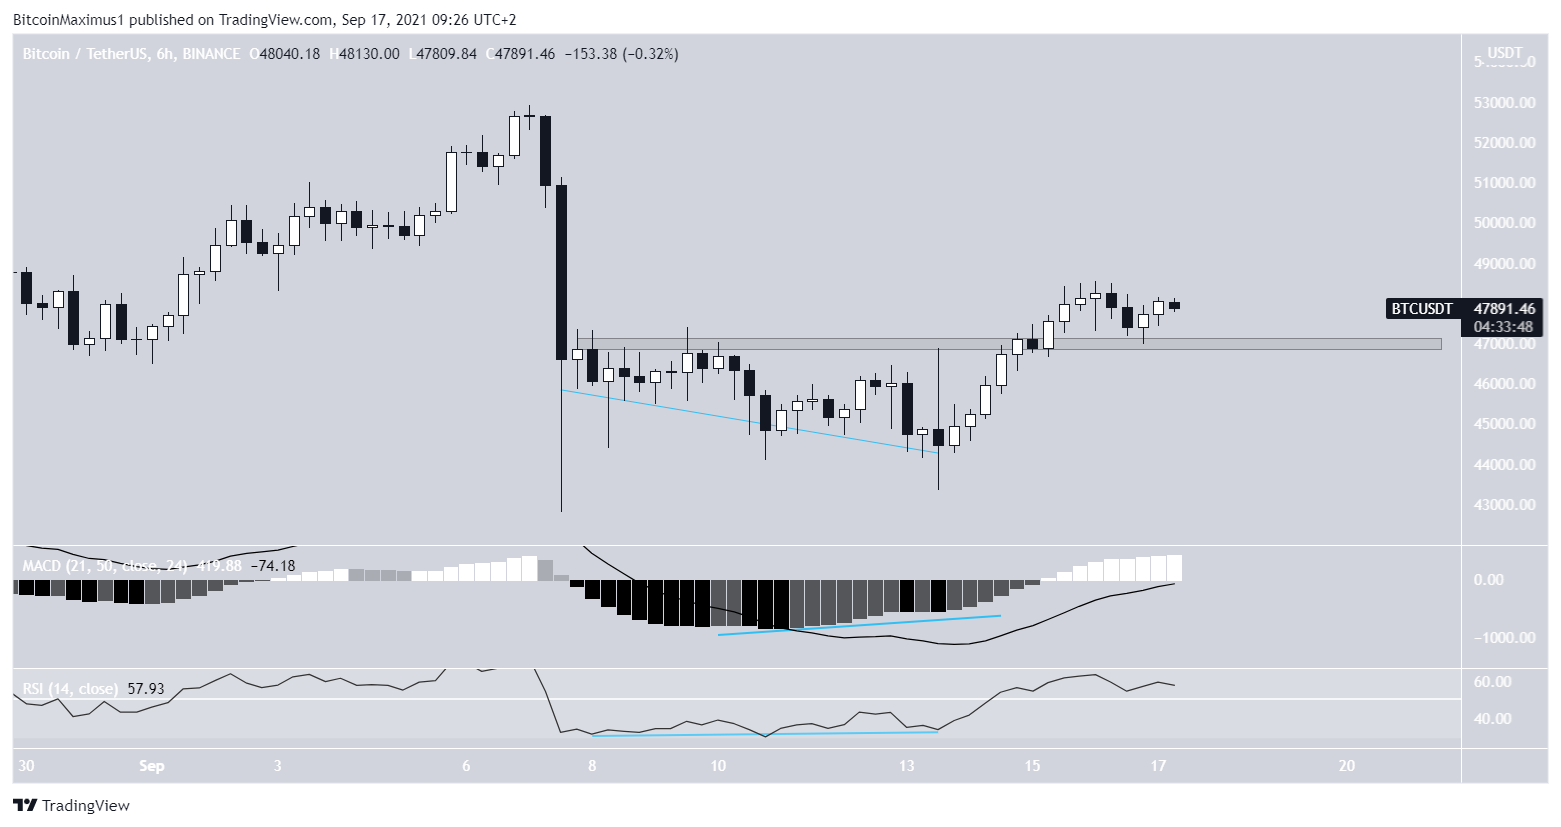
The six-hour chart is more bullish. It shows that the ongoing bounce was preceded by bullish divergences in both the RSI and the MACD.
Following this, BTC managed to reclaim the $47,000 support area and validated as support on Sept 16.
As long as it does not close below this area, BTC is expected to continue moving upwards.
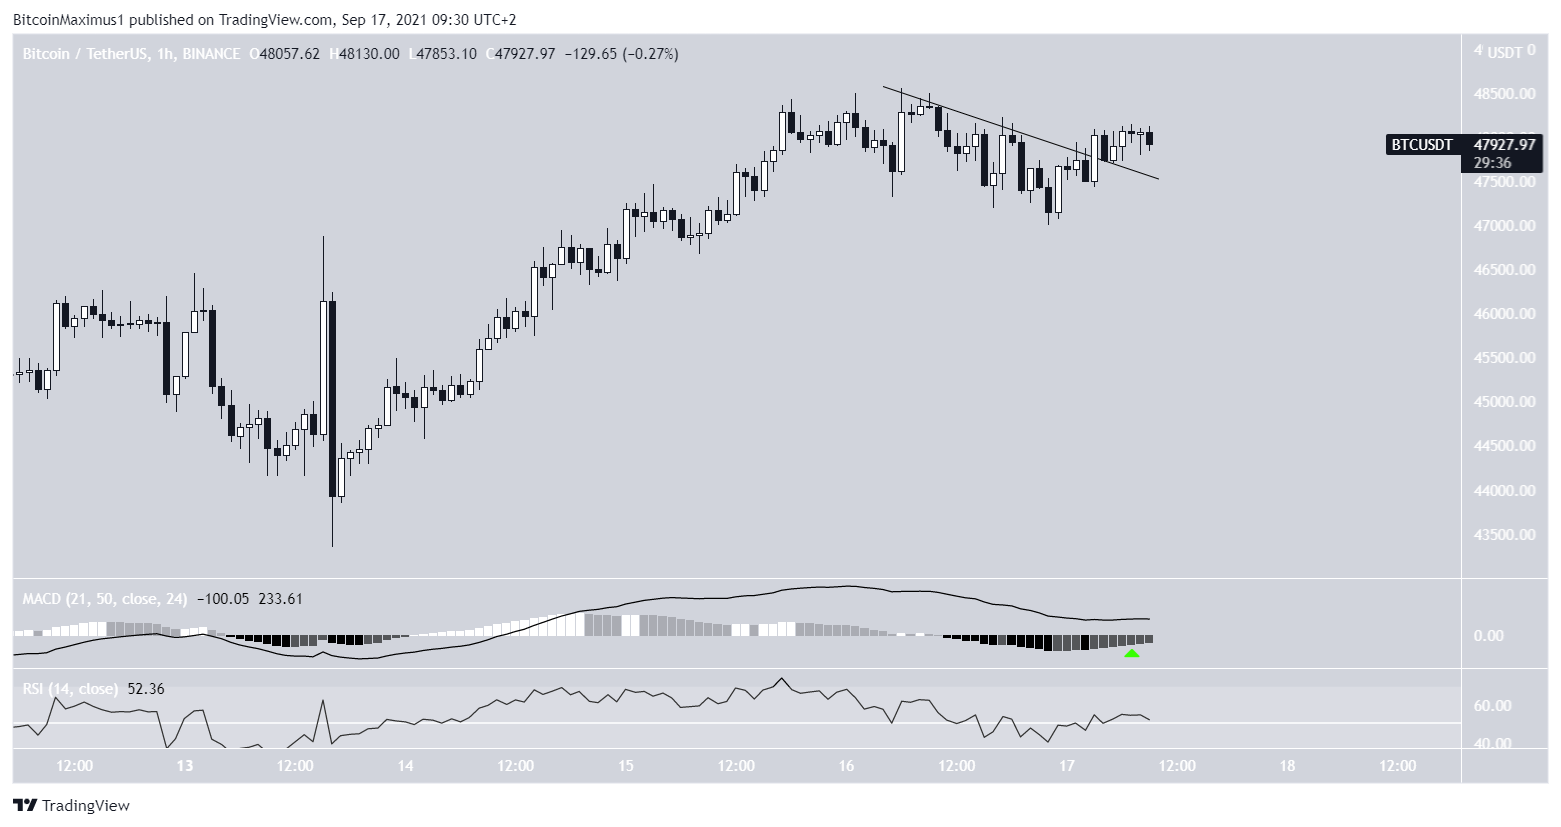
Furthermore, the two-hour chart shows that BTC has already broken out from a descending resistance line.
In addition to this, the MACD has given a bullish reversal signal and the RSI is above 50.
Therefore, it’s likely that BTC will continue to increase in the short-term.
Wave count
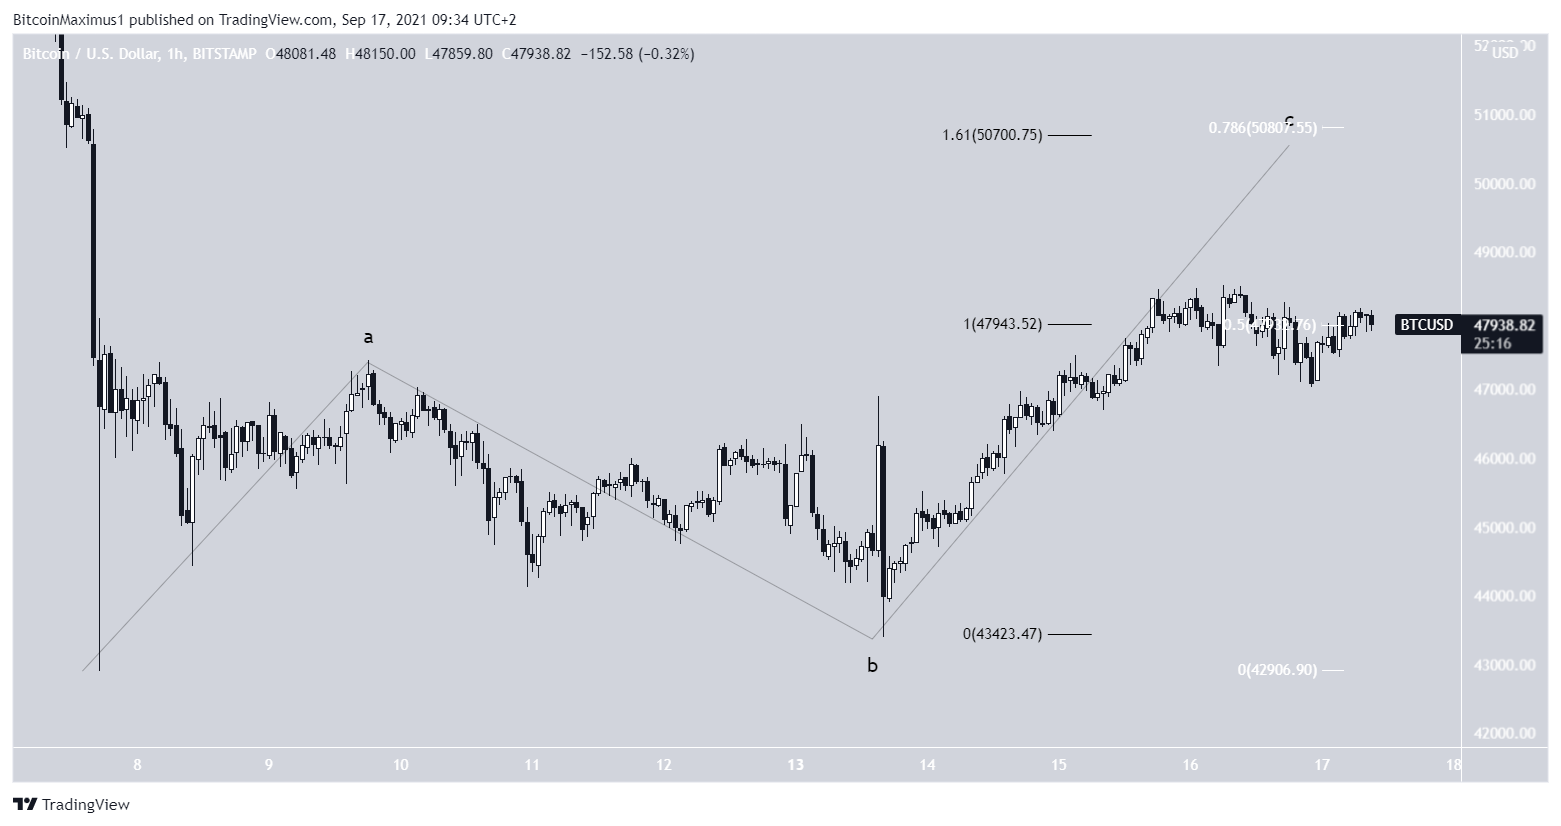
The most likely wave count indicates that BTC is in wave C of an A-B-C corrective structure (black).
The first target for the top of the move was $47,940. This gave waves A:C a 1:1 ratio (black) and was the 0.5 Fib retracement resistance level (white).
Therefore, BTC is now moving towards the next most likely target of $50,750. This would give waves A:C a 1:1.61 ratio and is the 0.786 Fib retracement resistance level.
For BeInCrypto’s previous Bitcoin (BTC) analysis, click here.
Disclaimer
In line with the Trust Project guidelines, this price analysis article is for informational purposes only and should not be considered financial or investment advice. BeInCrypto is committed to accurate, unbiased reporting, but market conditions are subject to change without notice. Always conduct your own research and consult with a professional before making any financial decisions. Please note that our Terms and Conditions, Privacy Policy, and Disclaimers have been updated.
