


Bitcoin (BTC) resumed its ascent on Sept 15, confirming the breakout from a parallel descending channel.
It is rapidly approaching the closest resistance area at $49,070. Due to a confluence of Fib levels, there should be stronger resistance at $50,700.
Ongoing bounce
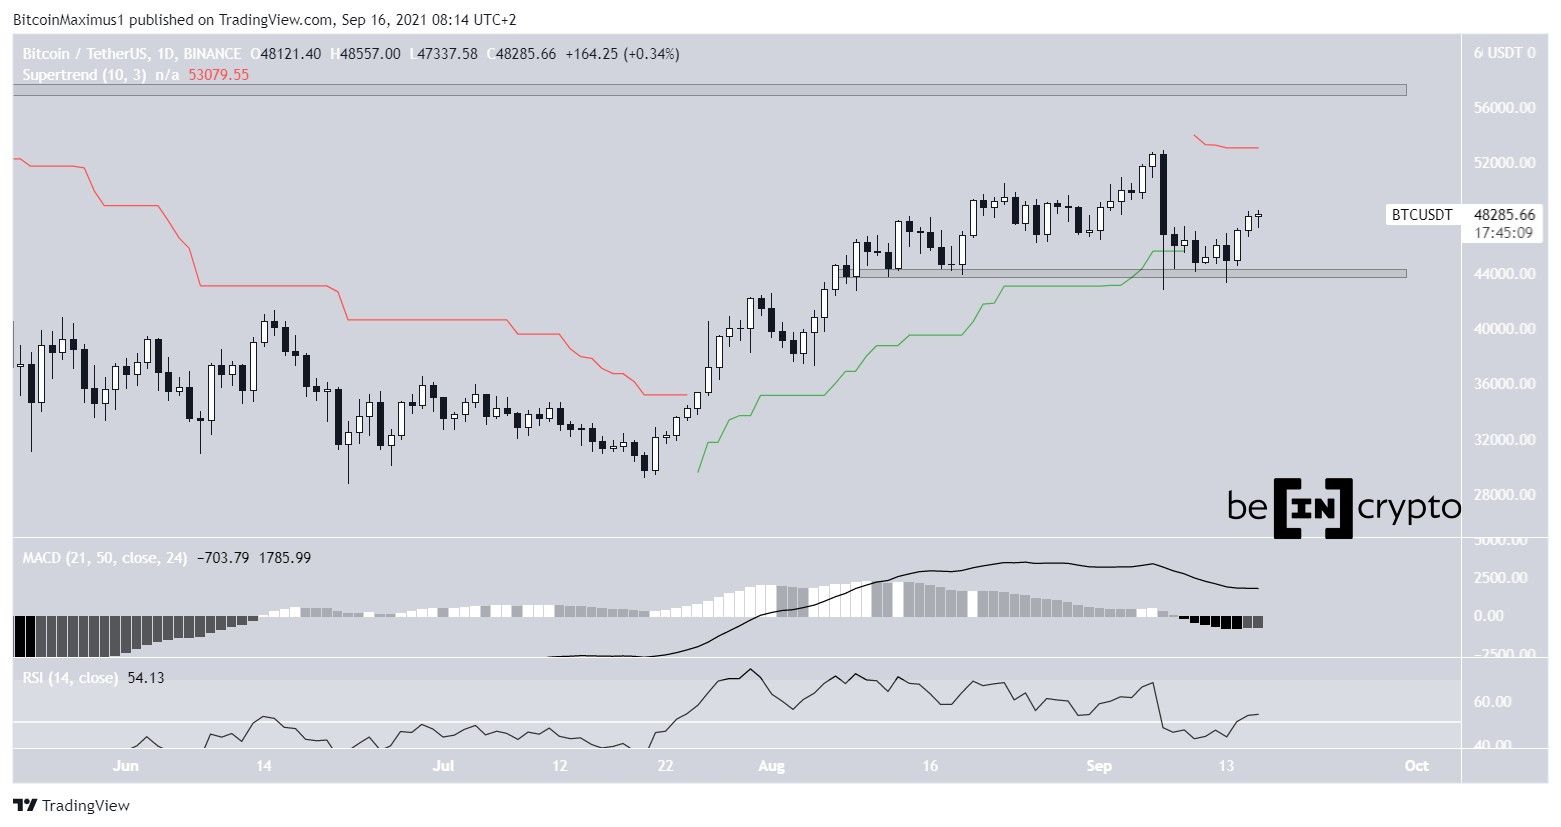
BTC has been increasing since bouncing at the $43,950 support area on Sept 13. During the next two days, it created two successive bullish candlesticks.
Despite the bounce, technical indicators are still bearish. However, they are showing some small bullish reversal signs. The MACD temporarily stopped its decrease by creating one higher momentum bar yesterday, and the RSI is making an attempt at moving above 50.
However, the Supertrend is firmly bearish (red line).
Future movement
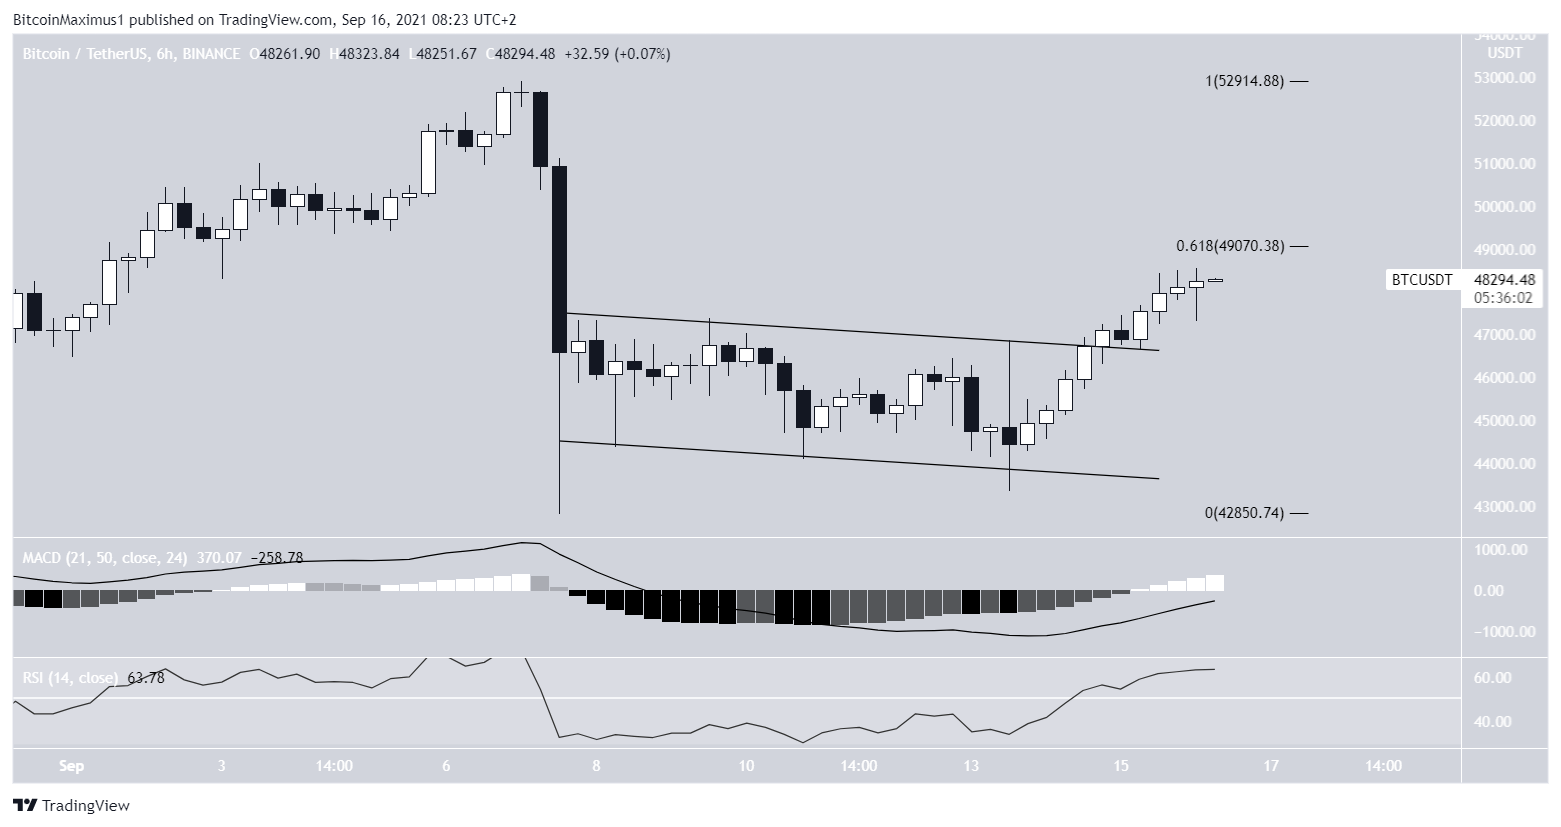
The six-hour chart appears more bullish since it confirms the breakout from the descending parallel channel. After breaking out, BTC validated the channel as support before resuming its upward movement.
In addition to this, the MACD and RSI are both increasing. The MACD is nearly positive while the RSI has already moved above 50.
The closest resistance area is found at $49,070. This target is the 0.618 Fib retracement resistance level.
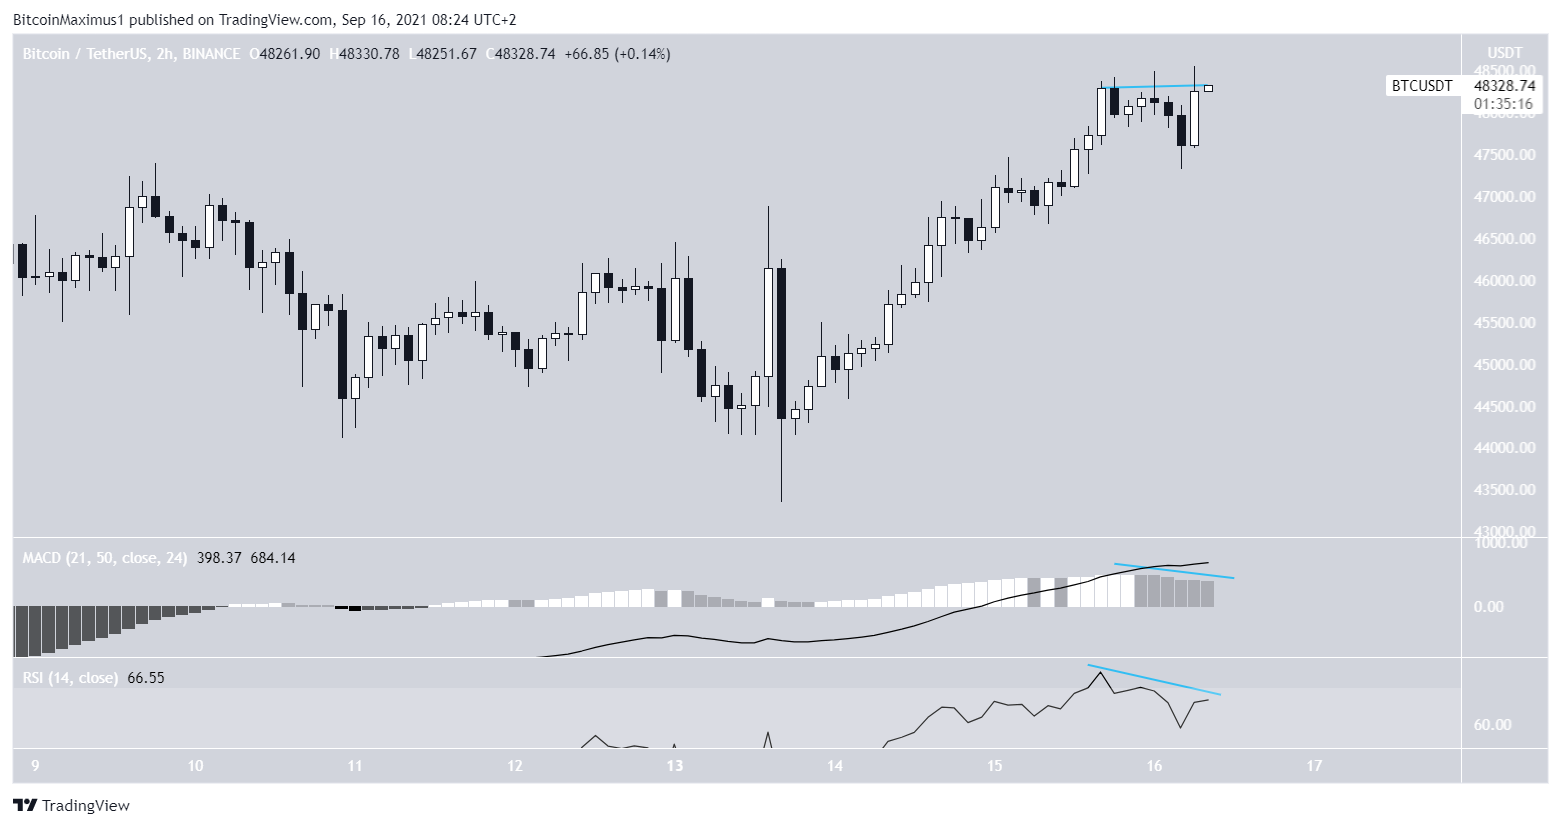
However, the two-hour chart shows the first signs of weakness in the form of bearish divergences in the RSI and MACD.
Therefore, it’s possible that a short-term drop will transpire prior to the continuation of the upward movement.
Wave count
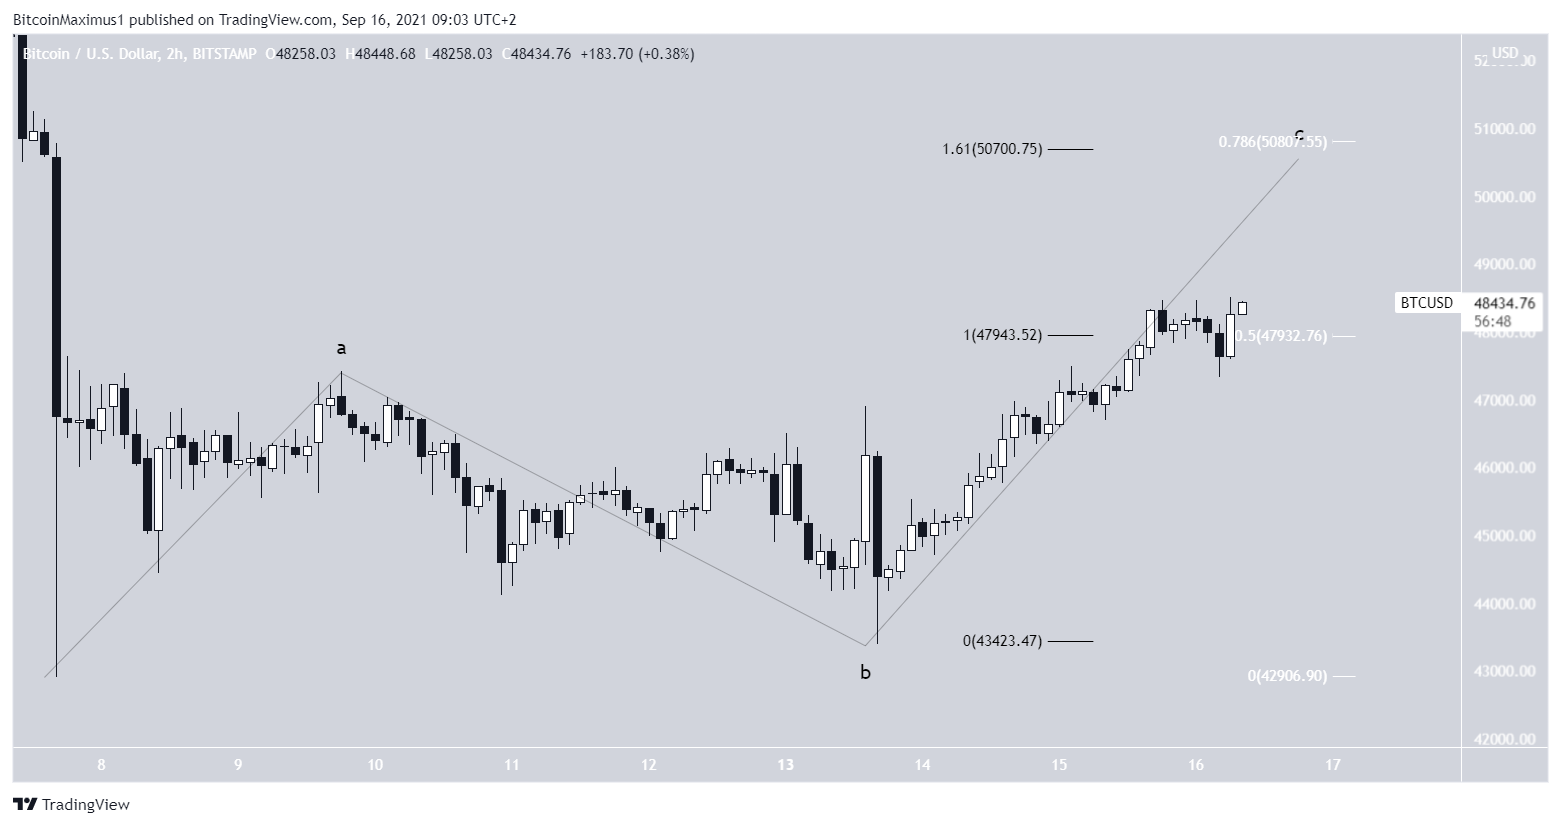
The wave count suggests that BTC is in wave C of an A-B-C corrective structure (black).
It has already moved above the first target for the top of wave C at $47,940. This was the 0.5 Fib retracement resistance level (white) and 1:1 ratio of waves A:C (black).
The next most likely target for the top is found at $50,750. This is the 1.61 length of waves A:C and the 0.786 Fib retracement resistance level (white).
For BeInCrypto’s previous Bitcoin (BTC) analysis, click here.


