
On June 7, Bitcoin (BTC) broke down from a symmetrical triangle that had been in place since May 19.
It’s likely in the process of completing the fifth and final wave of a bearish impulse that could take it below $30,000.
BTC Breaks Down
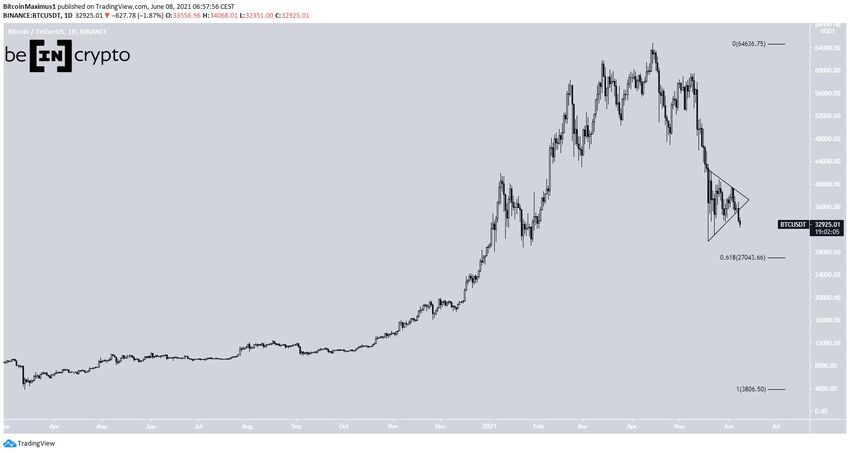
BTC had been trading inside a symmetrical triangle since May 19. After consolidating for nearly a month, it finally broke down from the pattern on June 7.
So far, BTC has reached a low of $32,351.
The closest support area is near $27,000, created by the 0.618 Fib retracement support level.
Wave Count
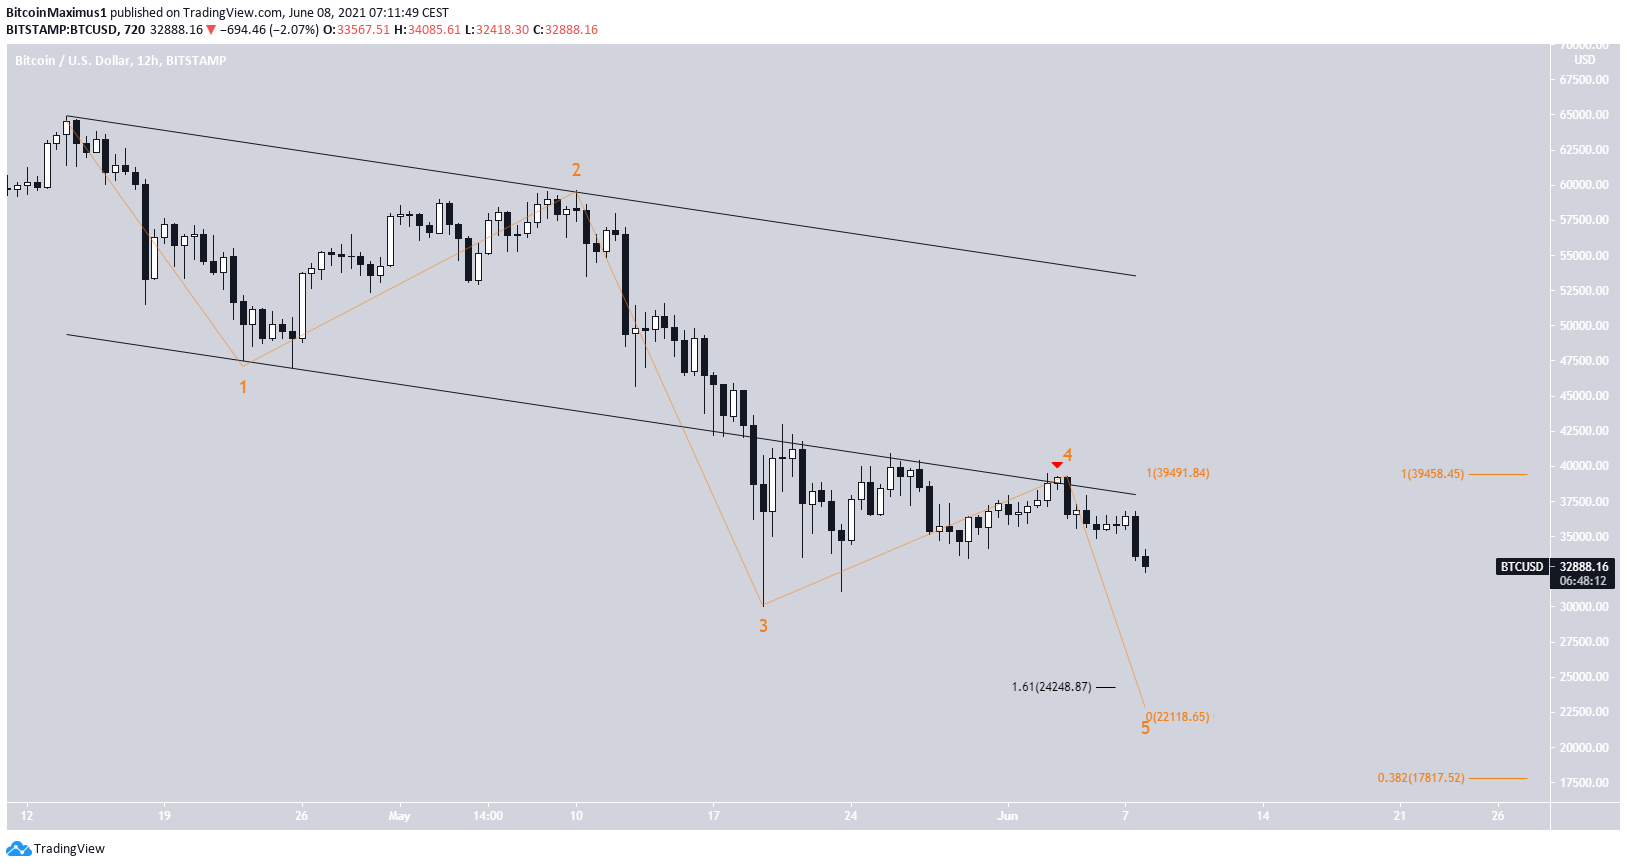
The wave count suggests that the drop is part of the fifth and final wave of a bearish impulse that began with the April 14 all-time high (orange).
This is evident by the rejection from the previous support line of a descending parallel channel (red icon).
The most likely area for the bottom of the movement is between $24,200 and $22,100. This range is found by using an external Fib retracement on wave four (black) and projecting the length of wave 1 (orange).
While an extension could take BTC as low as $17,000, it’s still too early to determine if the current decrease will extend.
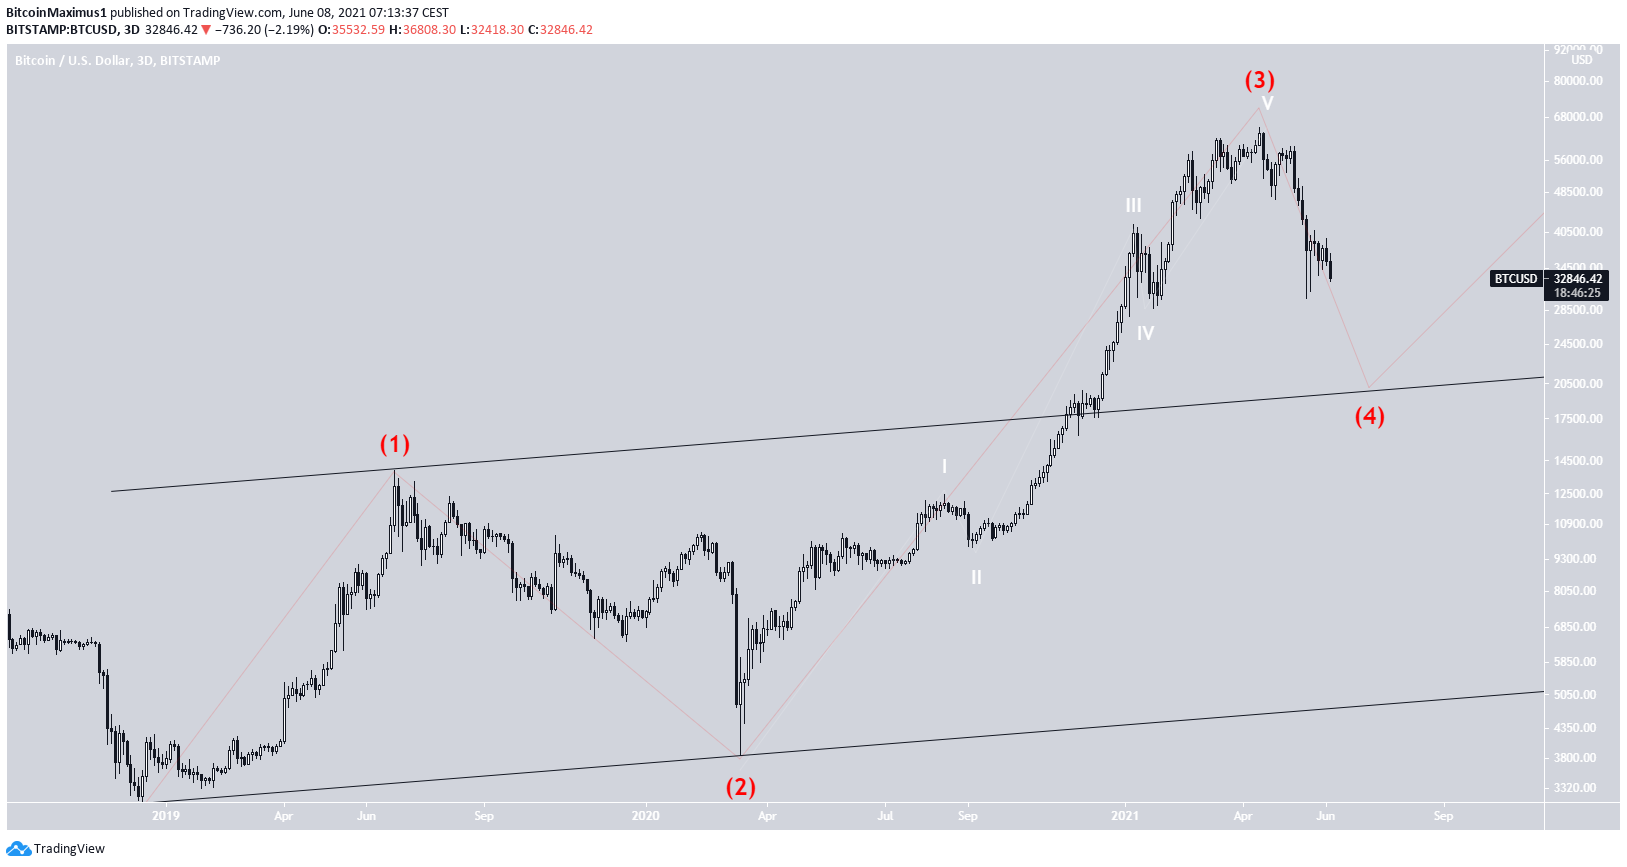
In the long term, the drop appears to be part of wave four (red) of a bullish impulse that began in December 2018.
The proposed decrease would complete a fourth wave pullback before another upward move that would complete the entire bullish cycle.
Future movement
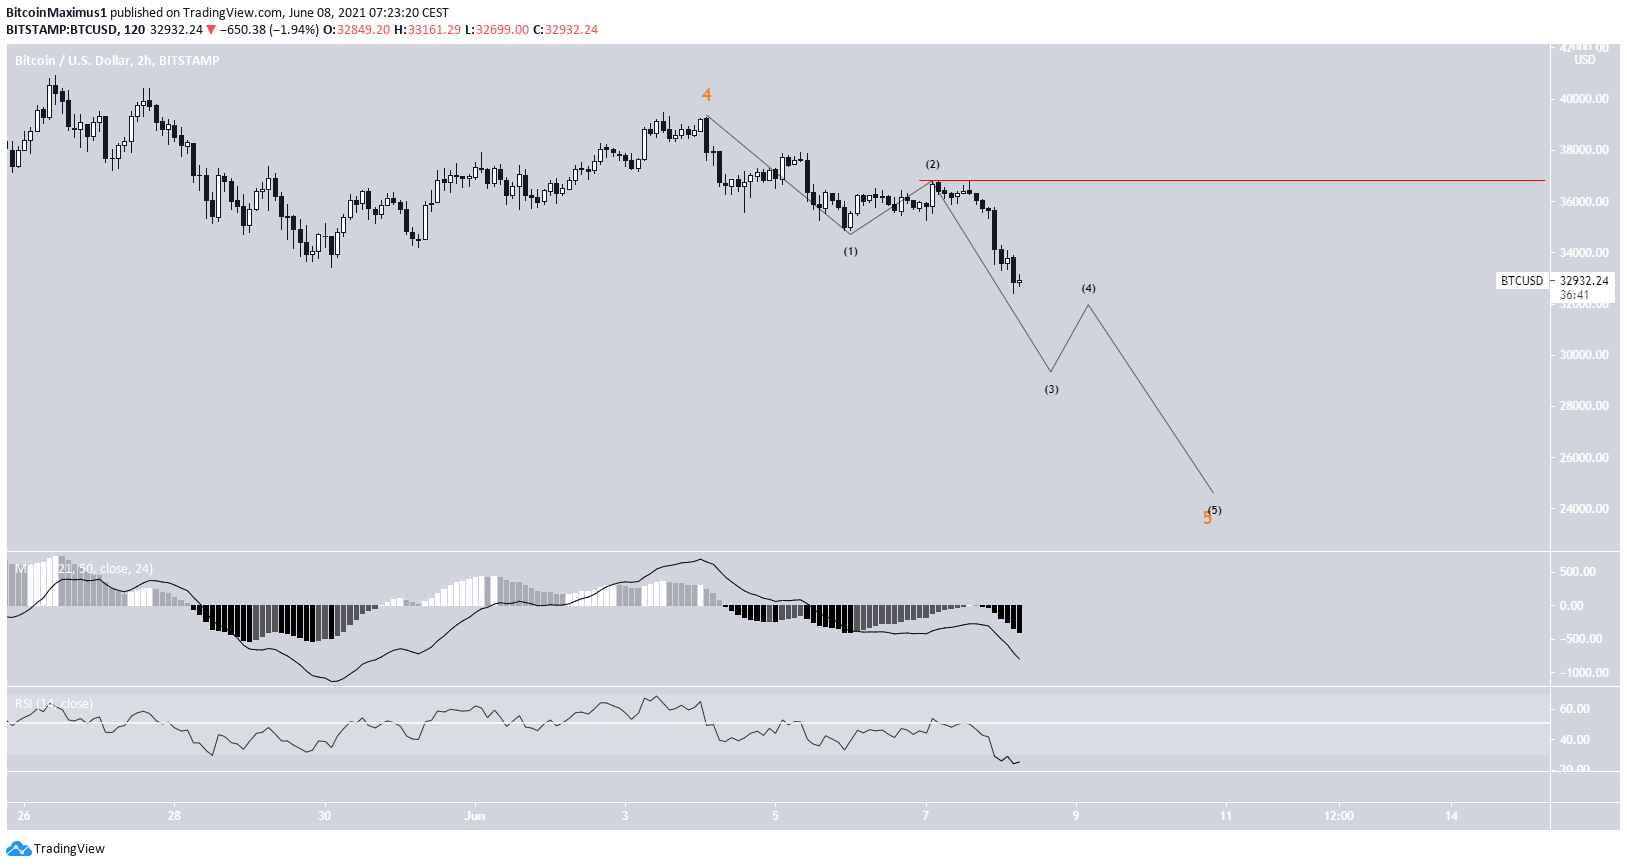
In the two-hour chart, the sub-wave count is shown in black. It outlines a potential path for the BTC price.
An increase above the sub-wave two high at $36,811 (red line) would invalidate this wave count.
Technical indicators do not yet show any signs of strength, supporting the possibility that BTC continues decreasing.
For BeInCrypto’s previous bitcoin (BTC) analysis, click here.
