
Bitcoin (BTC) is currently retracing after reaching a high of $21,723 on June 21. It has yet to create a short-term higher low.
BTC has been moving upwards since reaching a low of $17,622 on June 18. The next day, the price created a bullish engulfing candlestick (highlighted). This is a bullish pattern, in which the entire drop from the previous day is negated with one large bullish candlestick.
The increase led to a high of $21,723 on June 21, before a slight retracement.
The daily RSI is currently attempting to move above 30 (red circle). If it occurs, this would be considered a sign that suggests momentum is gradually turning bullish.
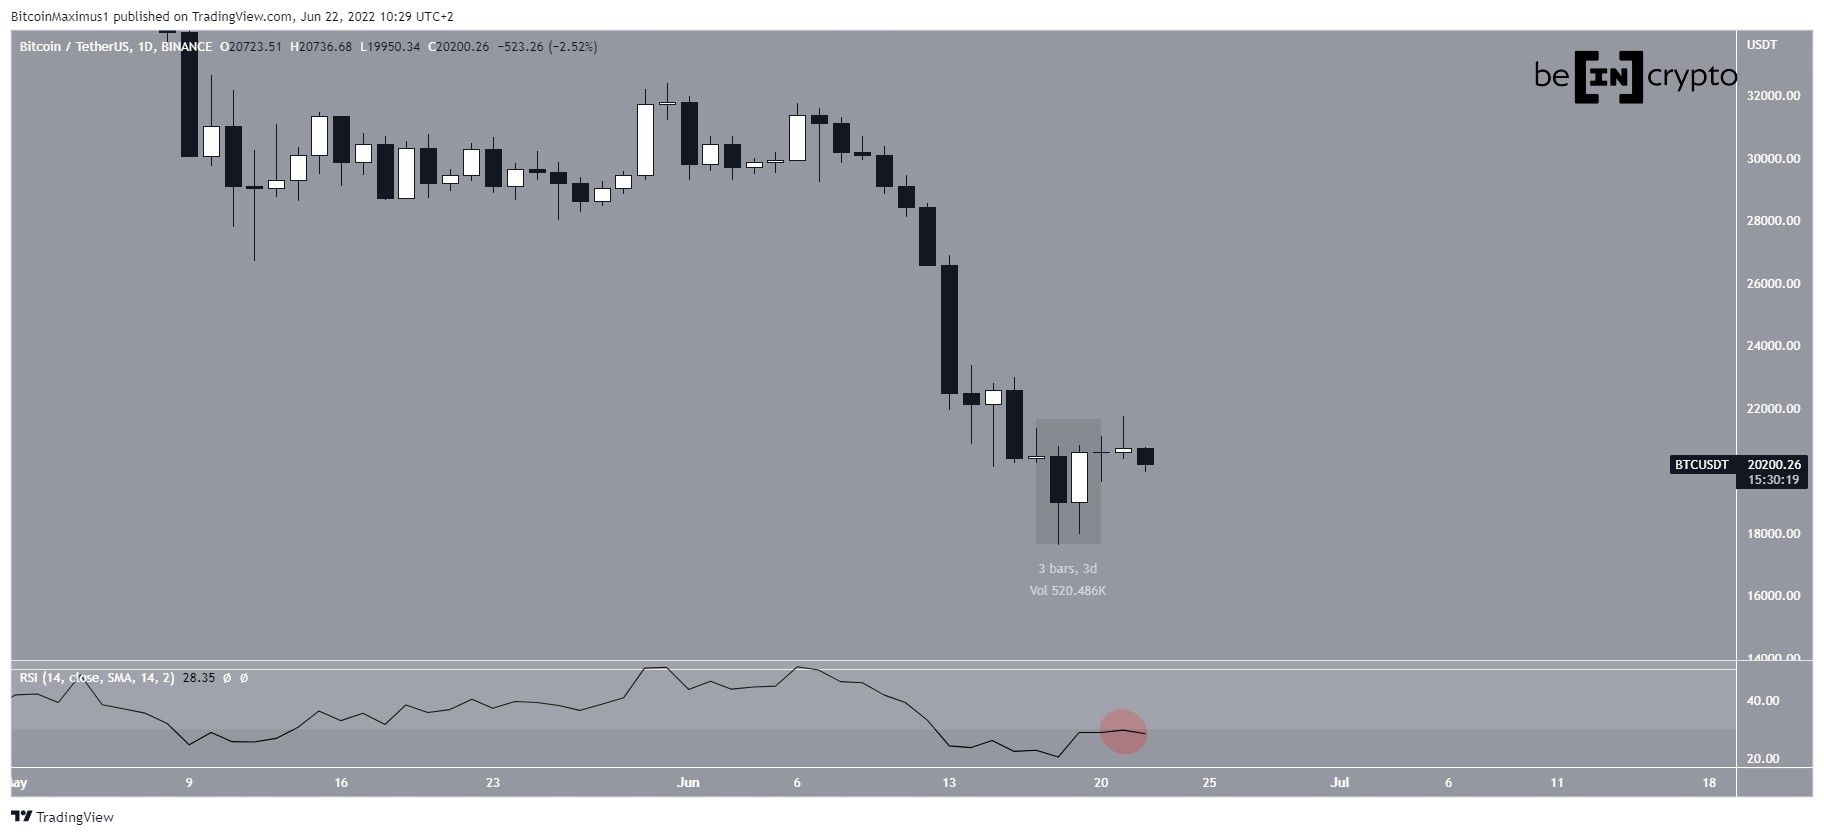
BTC bounces from lows
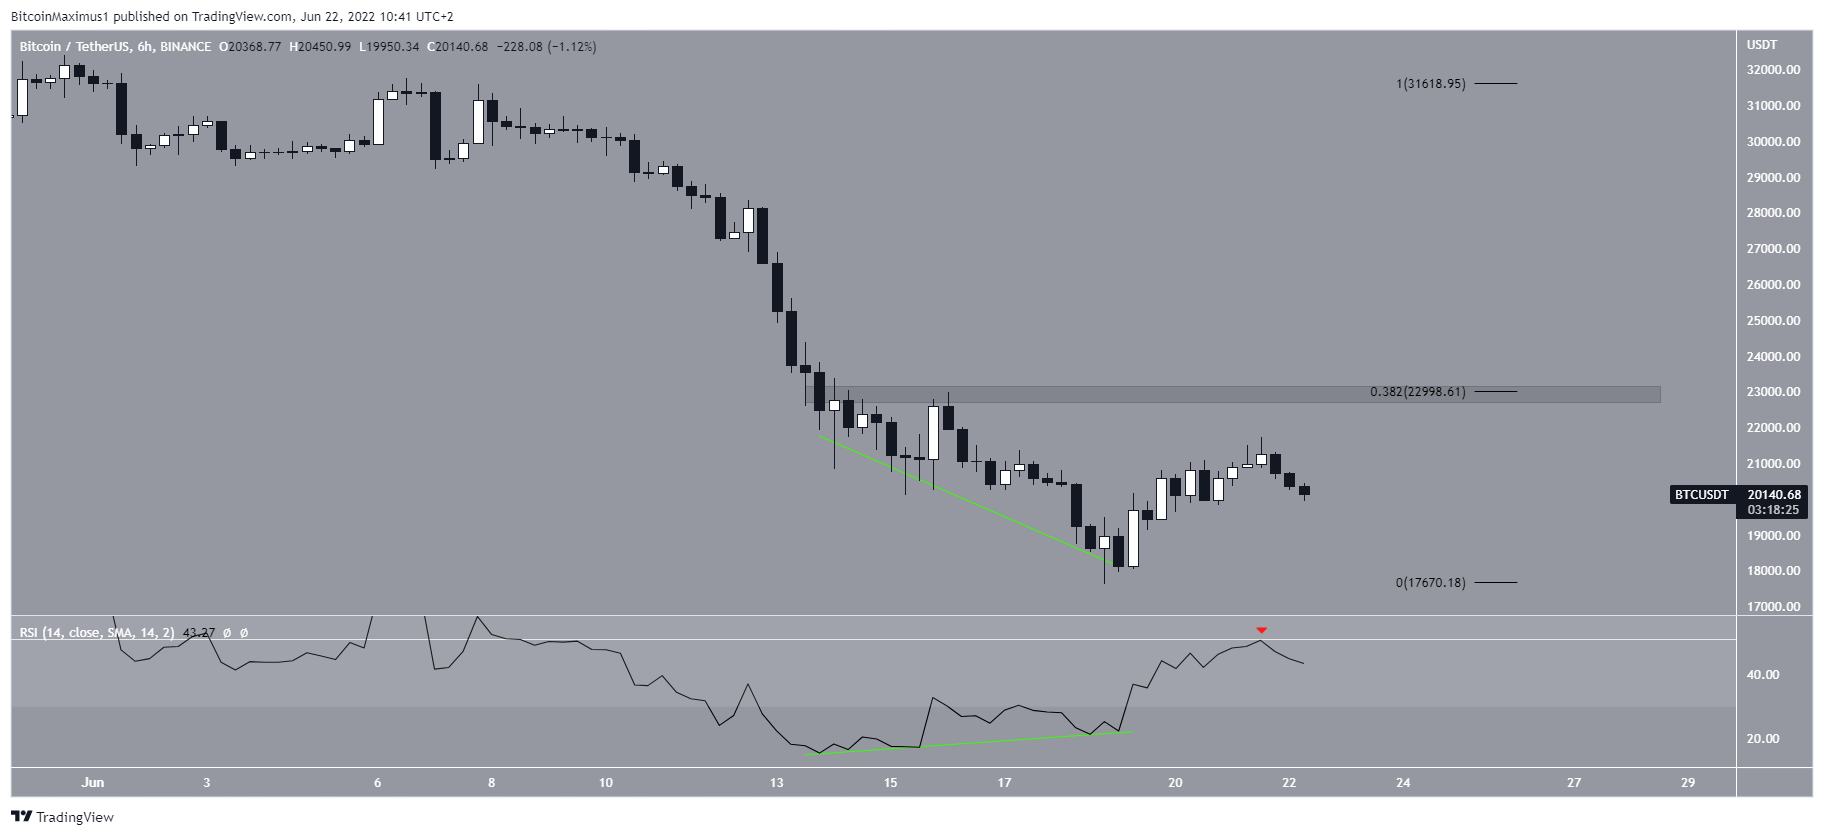
The six-hour chart shows that the ongoing bounce was preceded by a very significant bullish divergence in the RSI (green line). The signal would gain even more legitimacy if the RSI were to move above 50. This is a line that is considered a threshold for the beginning of a bullish trend.
If so, the closest resistance area would be at $23,000, created by the 0.382 Fib retracement resistance level and a horizontal resistance area.
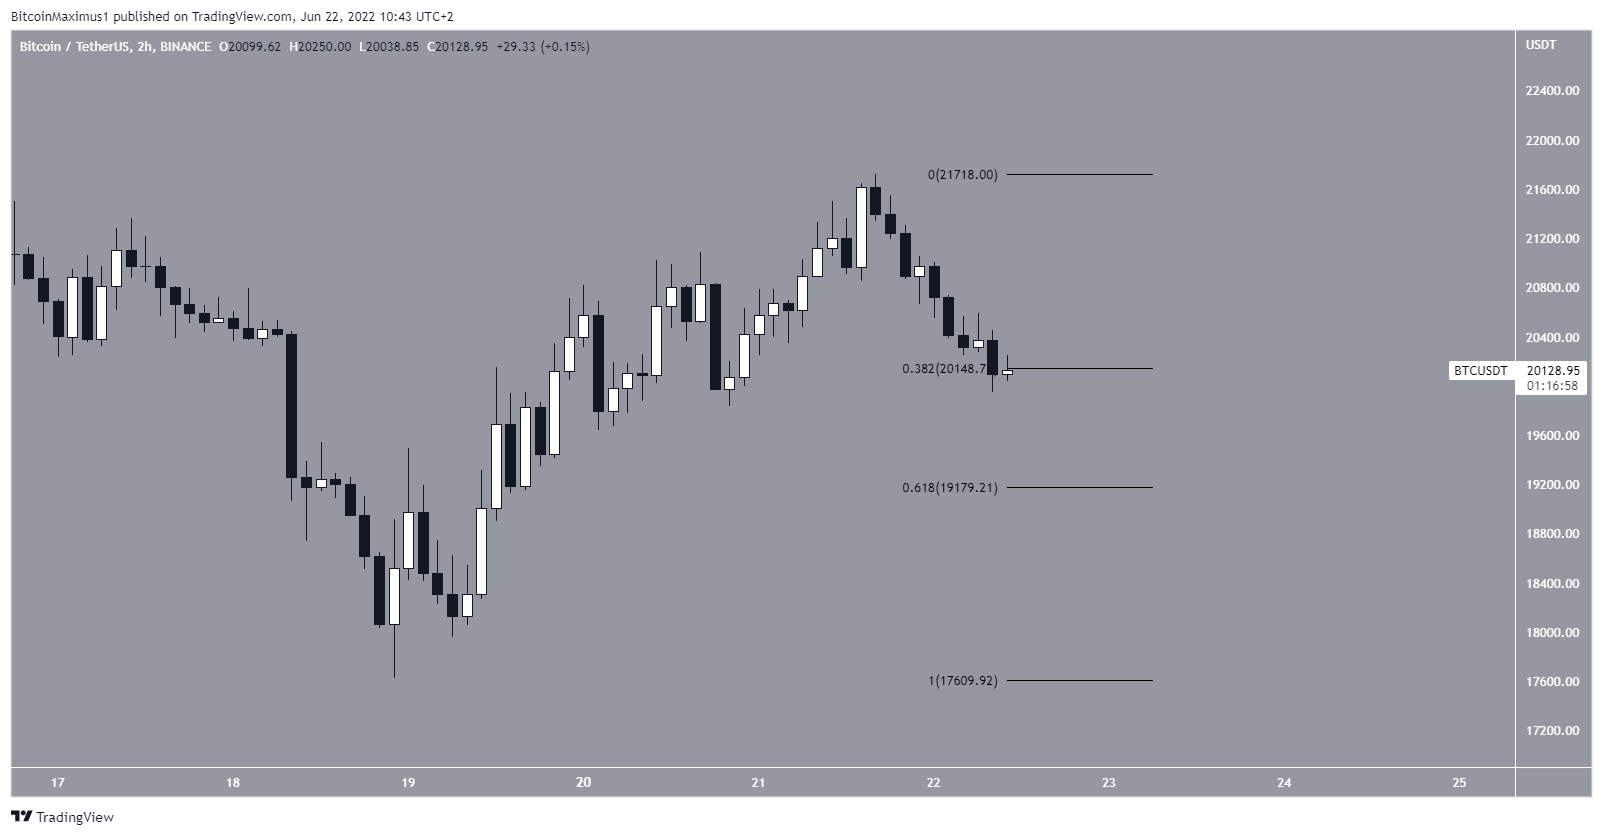
Moving closer, the two-hour chart shows that BTC is trading inside the 0.382-0.618 Fib retracement support levels. The levels create a support area between $19,200 and $20,150.
Therefore, in order for the upward movement to continue, the price has to create a higher low inside this area.
Wave count analysis
There are several possible long-term wave counts, the majority of which suggest a bounce is likely.
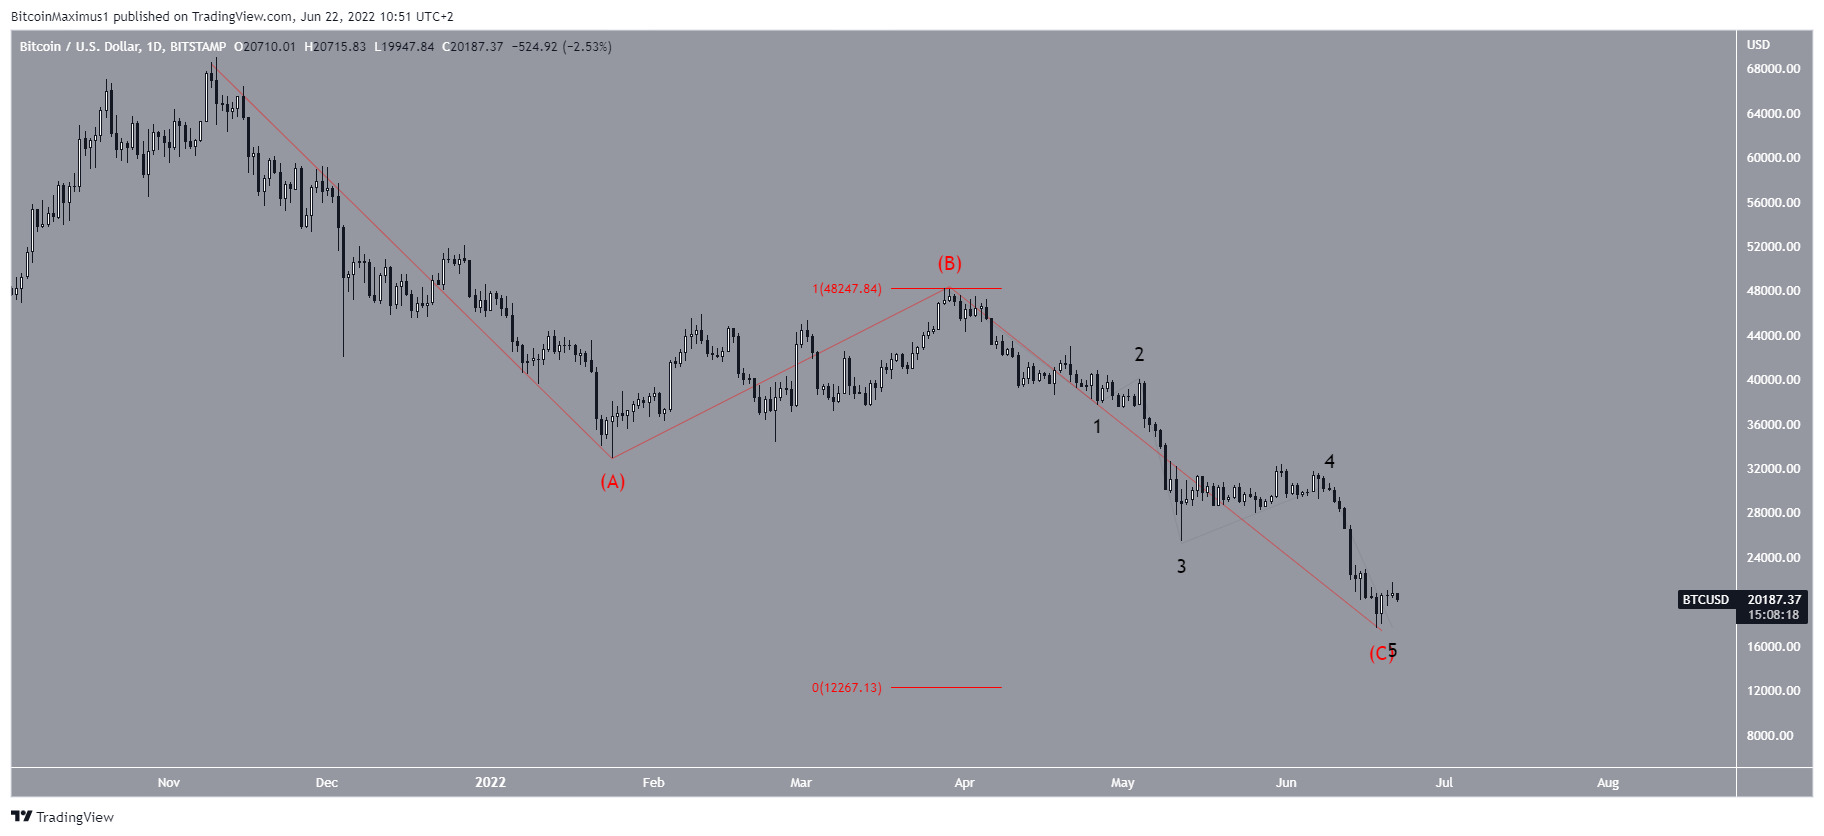
Consequently, the most likely short-term count suggests that the five-wave downward movement that began in April is now complete (black). The sub-wave count is given in yellow.
The June 18 low was made at a confluence of Fib levels, more specifically the 0.618 length of waves one and three (black) and the 2.61 external Fib retracement on wave four (white).
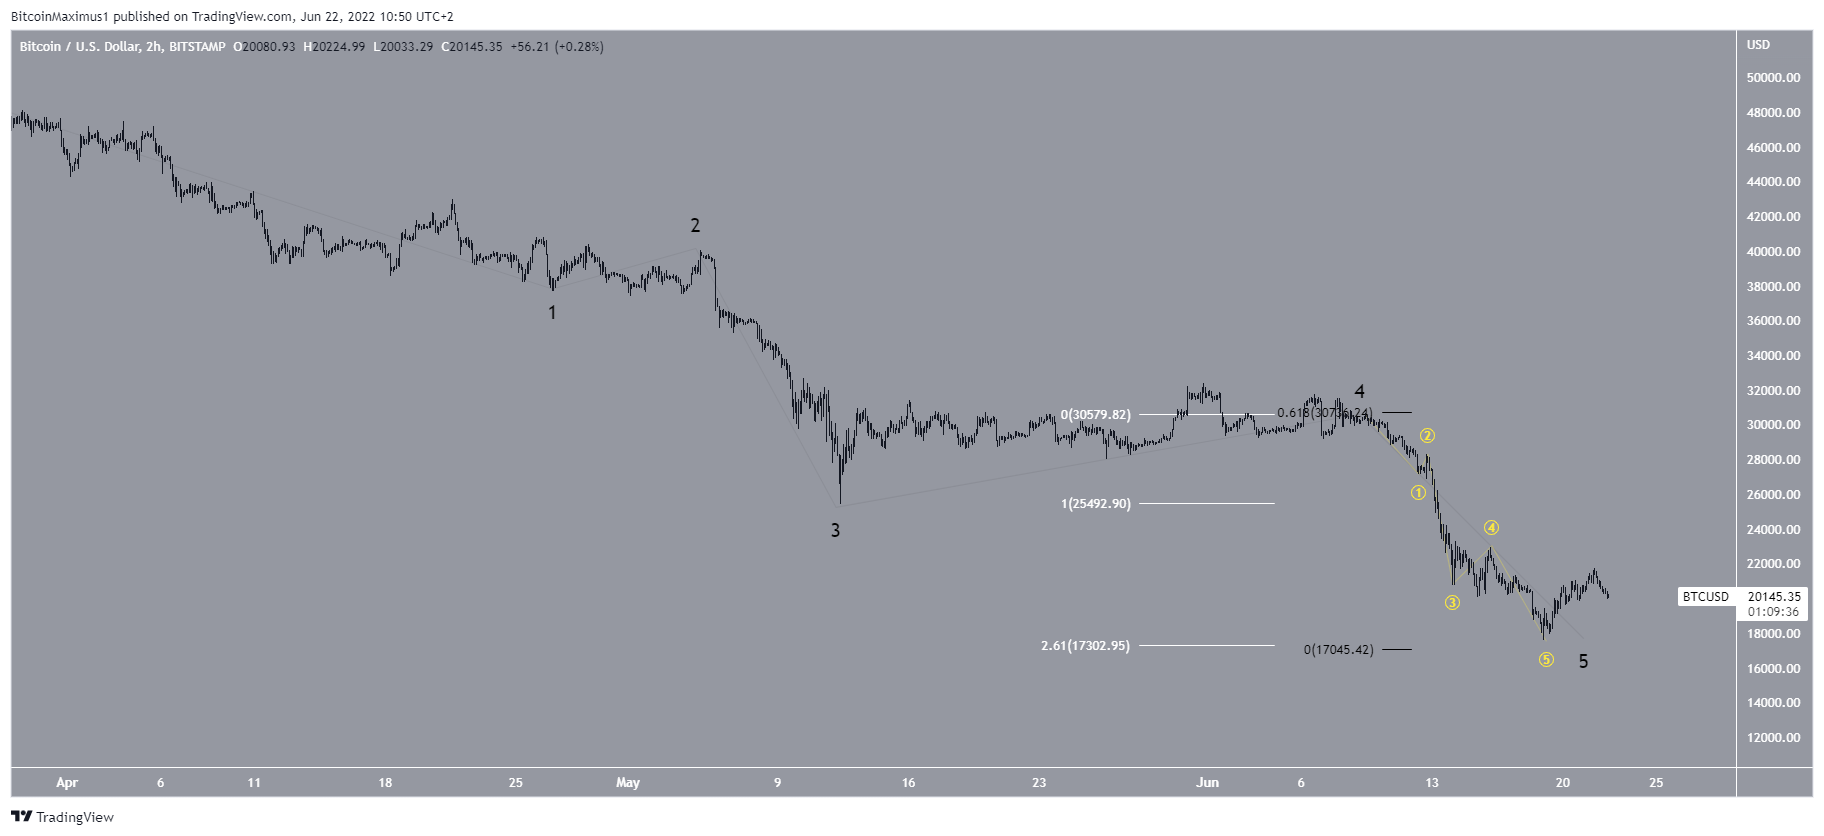
Nevertheless, it is worth mentioning that a proper Fib ratio is not in place when looking at the entire decrease since the all-time high.
In this case, the potential A-B-C correction would need to go all the way down to $12,260 in order to give waves A:C a 1:1 ratio.
For Be[in]Crypto’s previous bitcoin (BTC) analysis, click here
