


Be[in]Crypto takes a look at on-chain indicators for bitcoin (BTC), more specifically the realized profit, realized loss and their derivatives.
Realized losses and profits
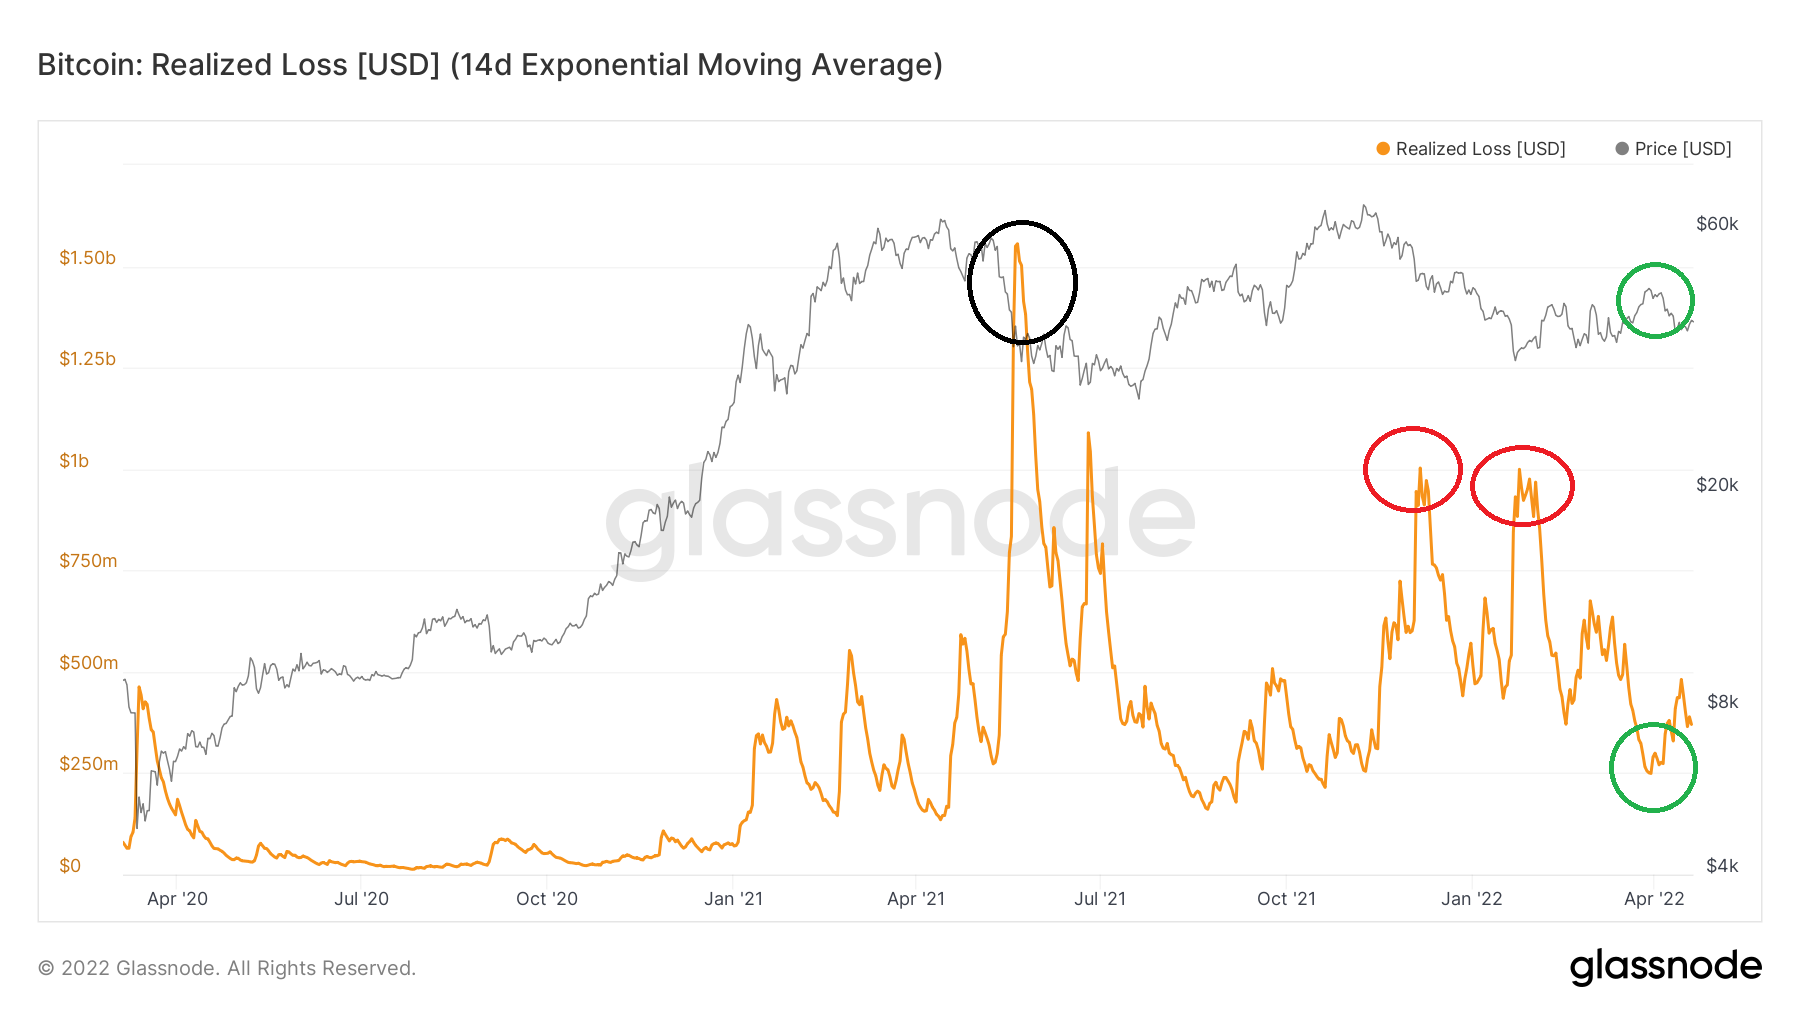
Realized losses show the USD loss of all the BTC that were sold at a loss in each specific day. The indicator reached a peak in May 2022, at a high of more than $1.5 billion (black circle). Since the BTC price was trading at $34,000 at the time, the loss could have been caused by participants who bought close to the $63,000 peak a month prior.
In Dec 2021 and Feb 22, realized losses peaked near $1.05 billion (red circles). This was likely caused as a result of all-time high buyers, who bought at prices above $60,000 in Nov.
A very interesting development transpired during the March bounce. While the BTC price increased to $45,000, realized losses fell to a low of $179 million. Therefore, participants who bought above these prices have either capitulated prior (red circles), or have become holders.
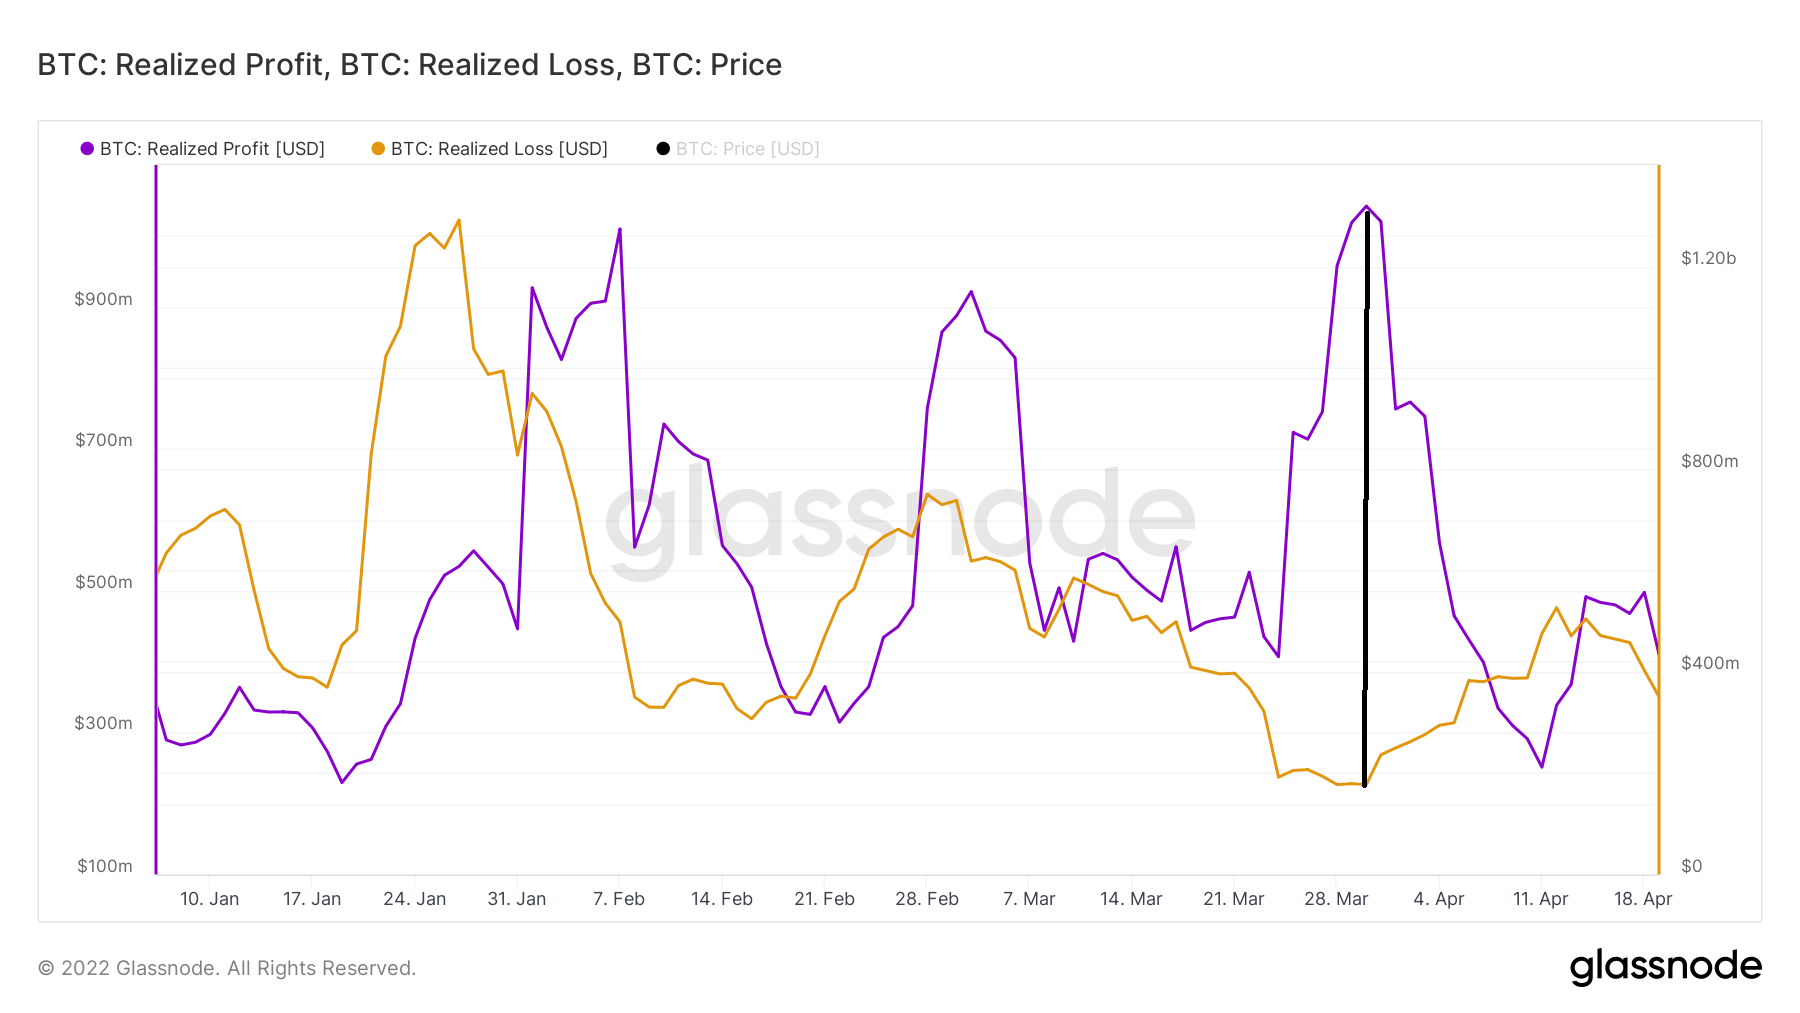
This occurrence is more clearly visible when putting realized losses (orange) and profits (purple) side by side. In the Jan and Feb spikes, both realized losses and profits moved upwards. Therefore, participants who had bought at higher and at lower prices were both selling.
However, during the March spike (black line), there is a significant difference between the two indicators. Since only realized profits spiked, this meant that the majority of the activity in the market was done by participants who had bought during the Jan – Feb dip.
BTC net realized profit/loss
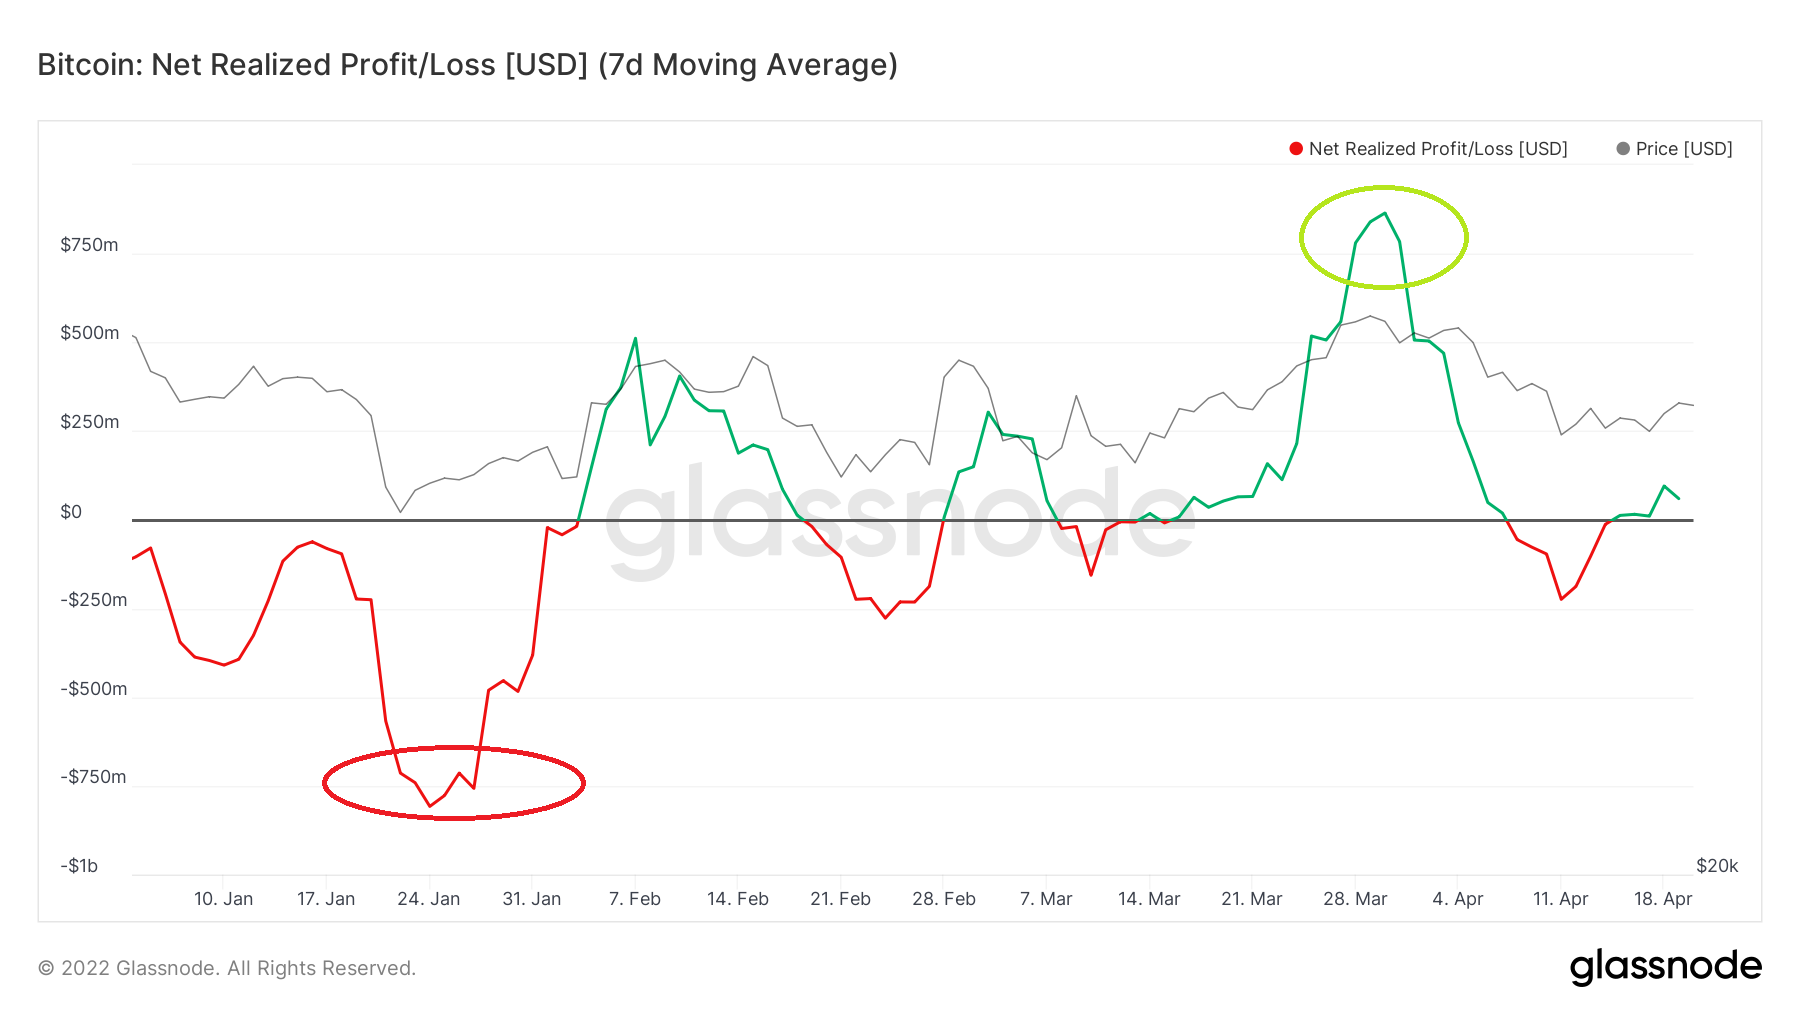
The net realized profit/loss indicator is created by subtracting realized losses from realized profits. If there are more losses, the indicator is negative. The opposite is true if there are more profits.
The indicator reached a low of -$808 million on Jan 24 (red circle), and a high of $864 million on March 23 (green circle). However, it has been hovering close to 0 in the periods in between. Therefore, this shows that the majority of market activity is done by short-term traders who bought close to the current prices.
Percent supply in profit
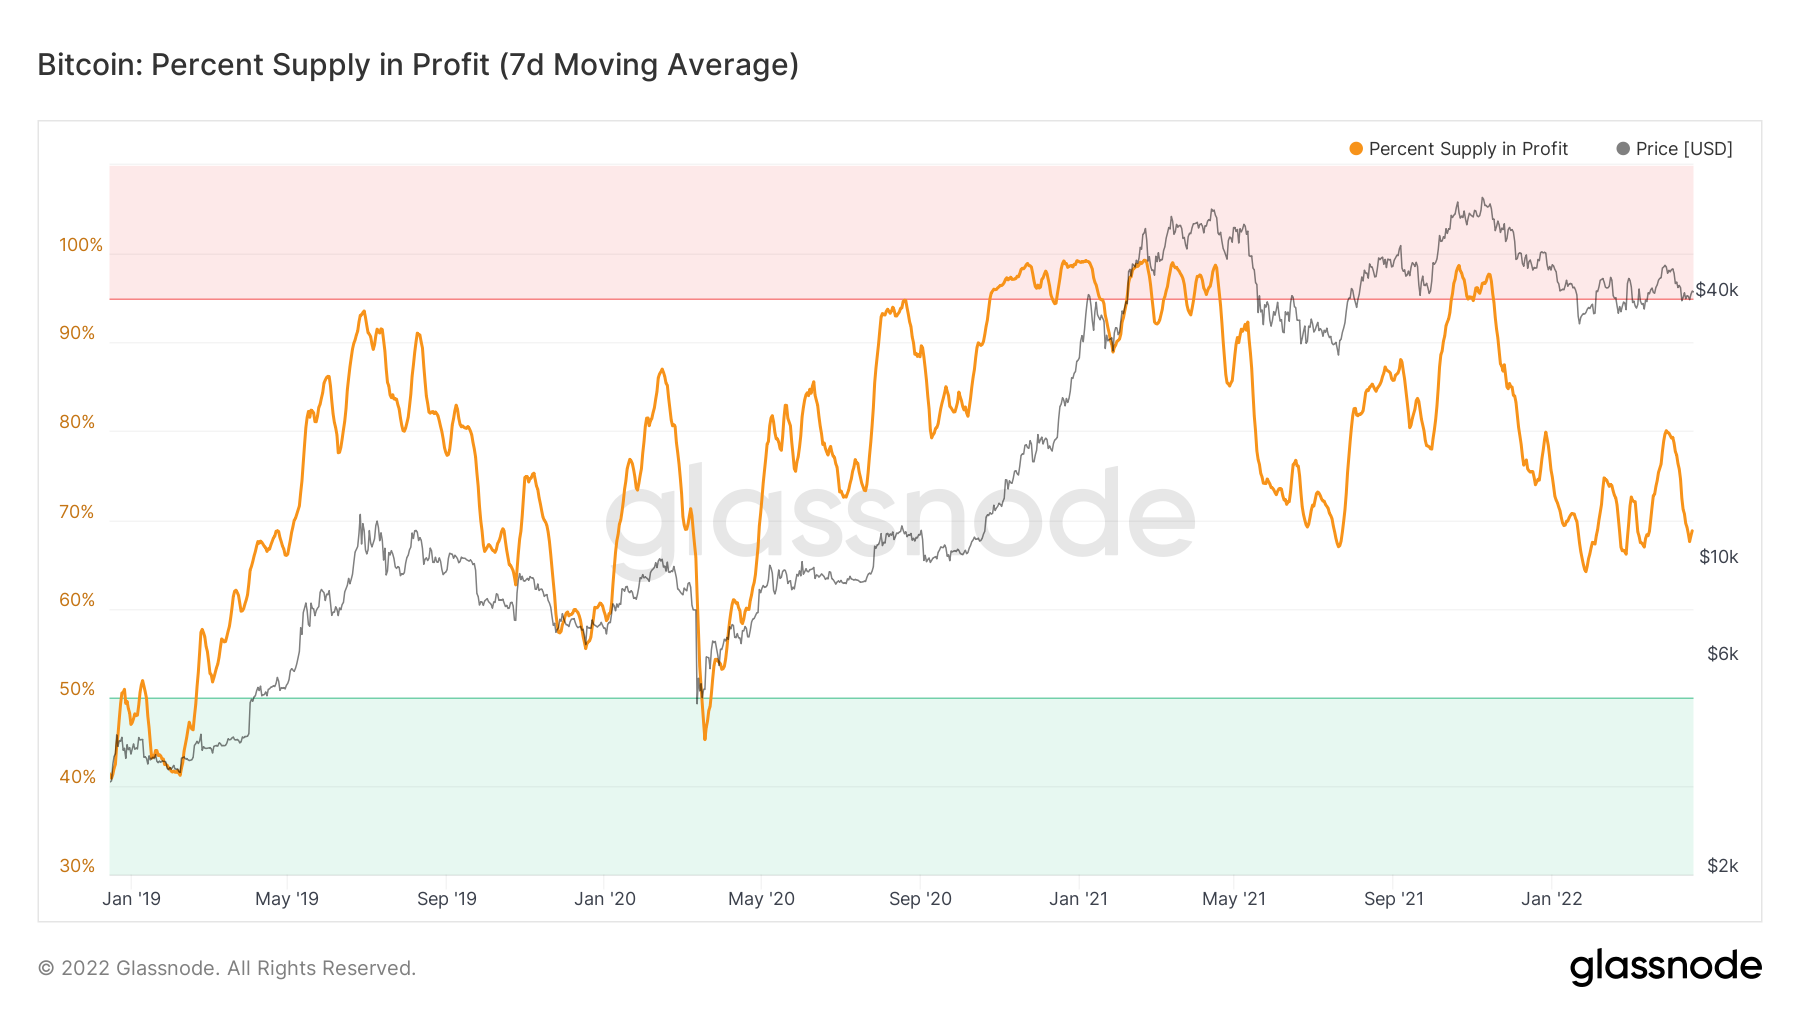
Finally, the percent supply in profit indicator shows the percentage of the total circulating BTC supply that is currently in profit. As of April 21, 67.5% of the BTC supply is currently in profit.
This is a similar value to that of July 2021 (black circles), despite the BTC price currently being more than $10,000 higher than it was in July.
For Be[in]Crypto’s latest Bitcoin (BTC) analysis, click here


