
The Bitcoin (BTC) price has broken out from a crucial resistance level.
After a potential short-term decrease, the price is expected to continue moving upwards towards the next closest resistance area.
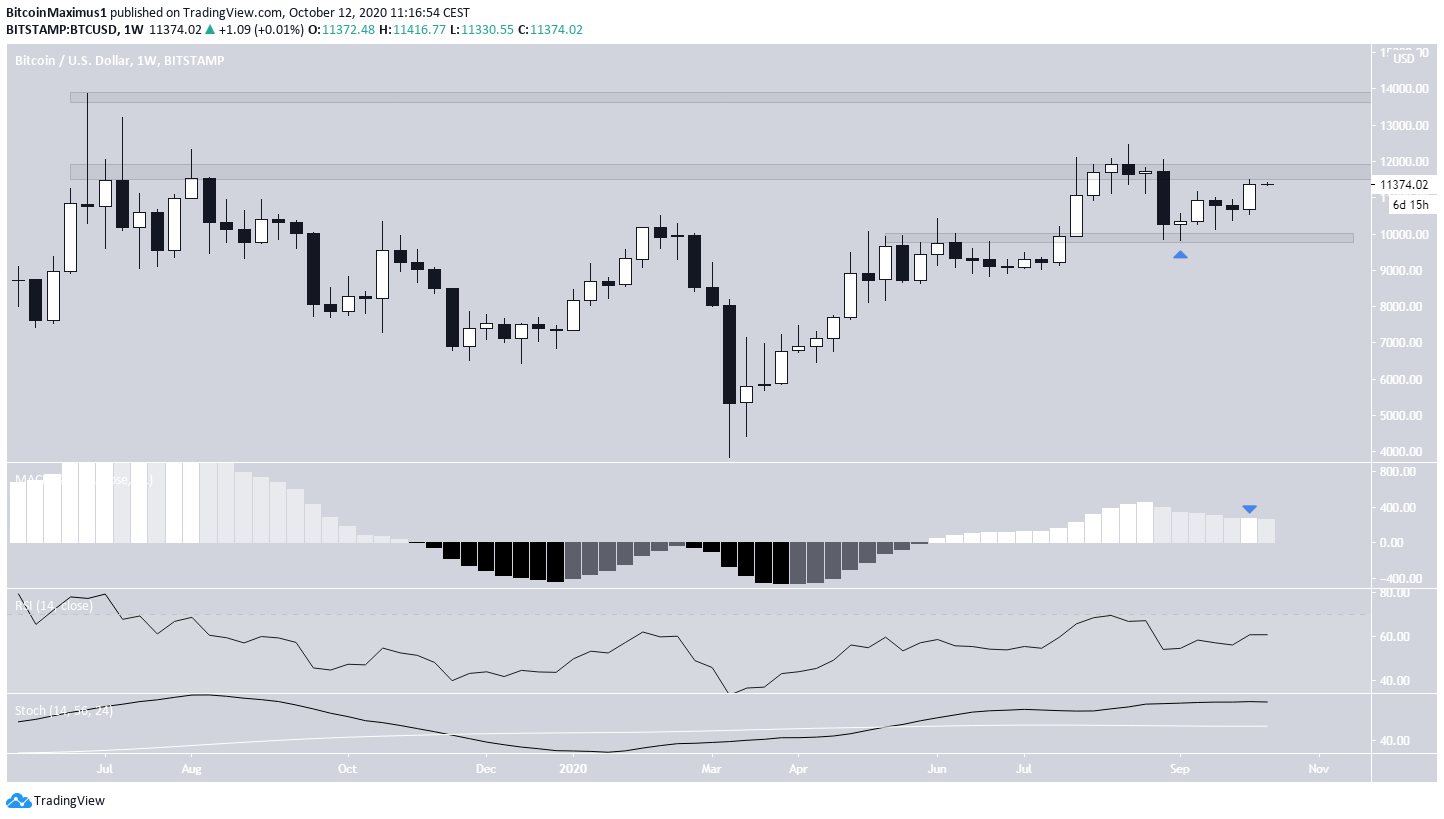
Weekly Bitcoin Outlook
During the week of Oct 5-11, the Bitcoin price created a bullish candlestick, increasing from a low of $10,525 to a high of $11,469.
While this is a bullish development, the price is still trading below the major $12,000 resistance area, which it has not traded above since July 2019. A breakout above the $11,700 level should allow for the price to increase all the way to $14,000.
The increase has been ongoing since BTC re-tested the $10,000 area as support at the beginning of September. Technical indicators are bullish, and the MACD just made a higher momentum bar after having decreased for four weeks in a row.
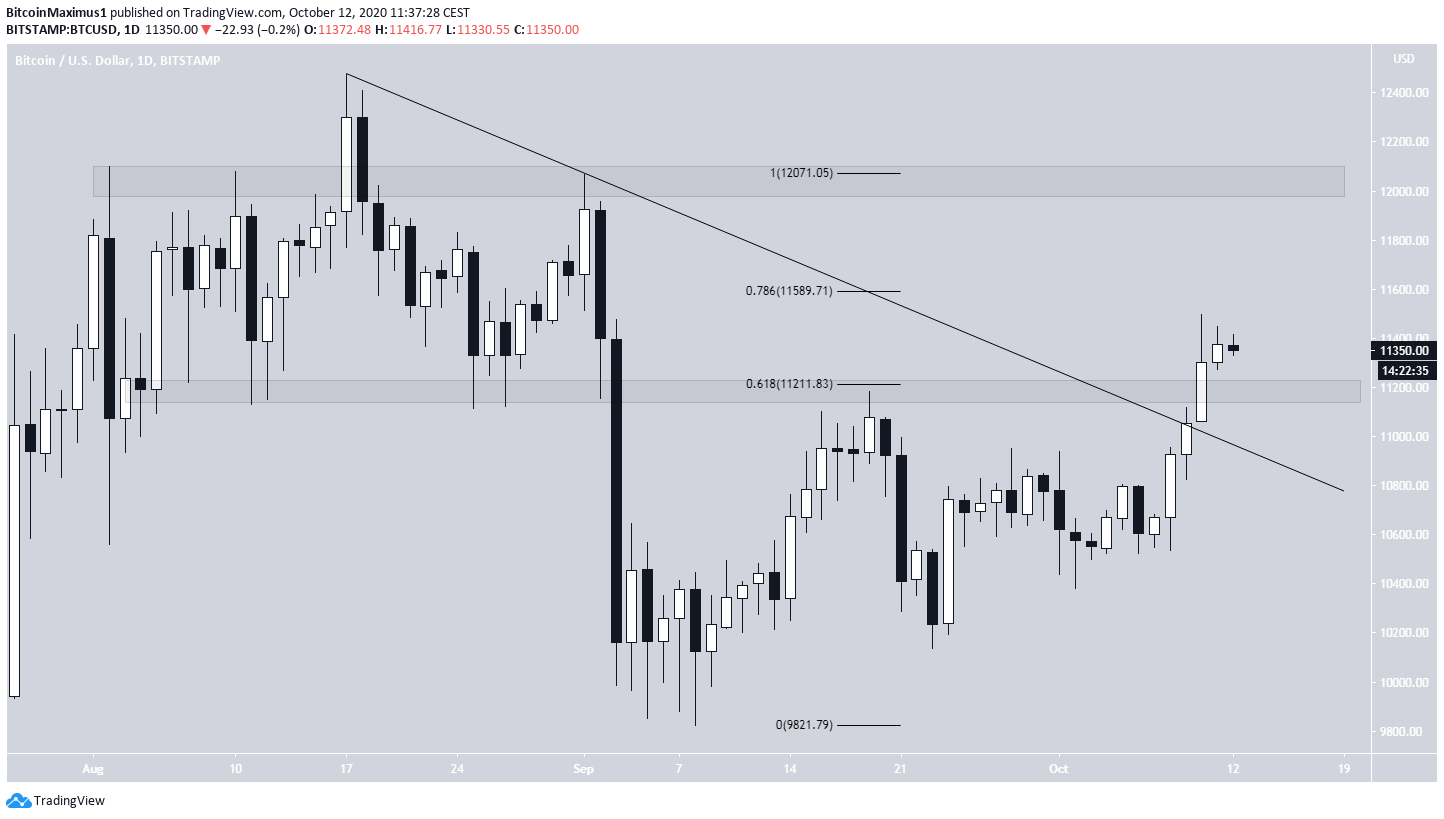
Breakout From Resistance
The daily chart for BTC shows that the price has broken out from:
- A descending resistance line that had been in place since the Aug 17 high.
- The $11,200 area, which previously acted as support and is the 0.618 Fib retracement level of the most recent decrease
If the price continues increasing, there is minor resistance at $11,600 and major resistance at $12,070, both coinciding with the aforementioned long-term resistance area outlined in the previous section.
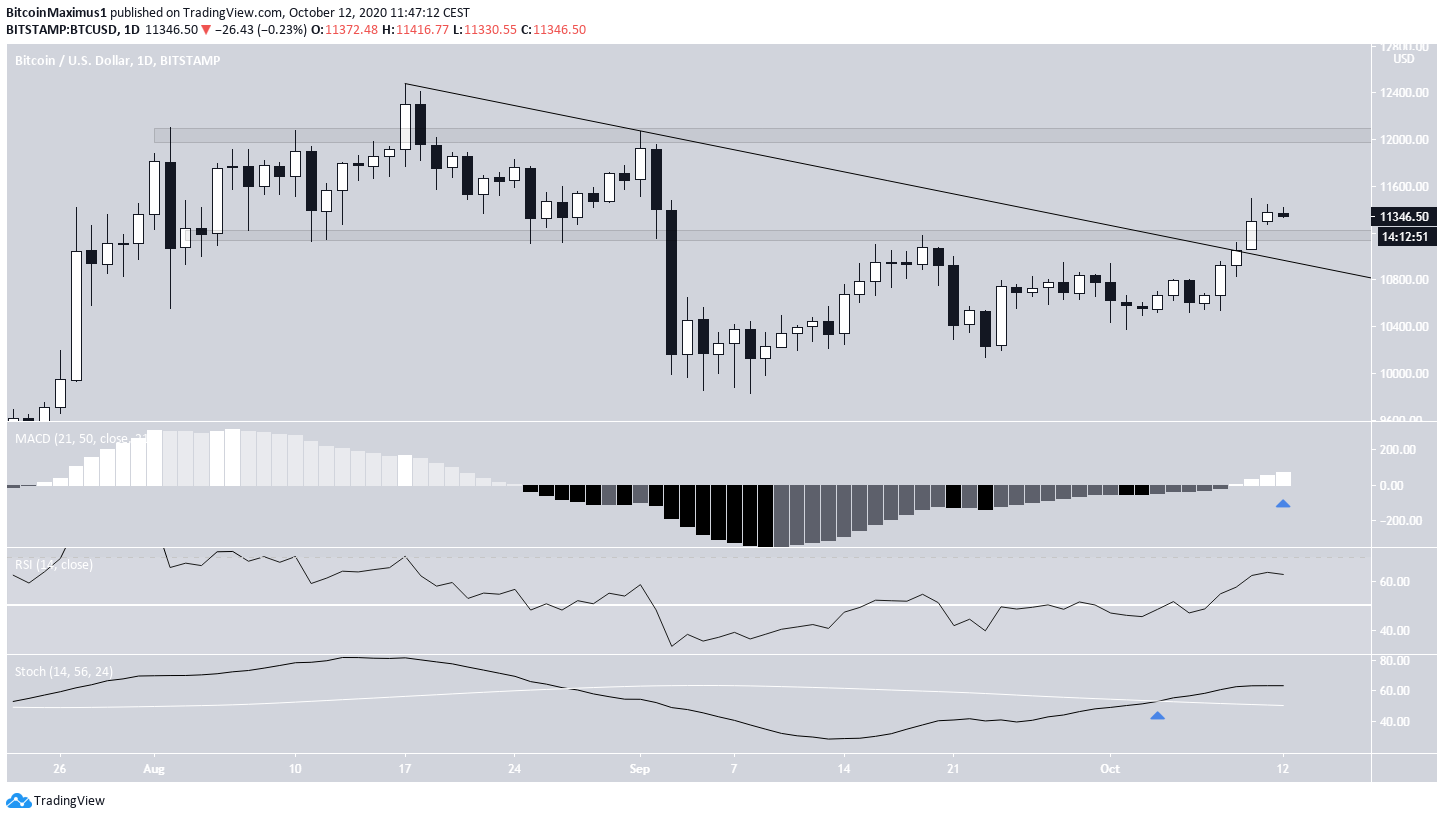
Technical indicators in the daily time-frame are bullish. The MACD, RSI, and Stochastic Oscillator are all increasing. Furthermore, the MACD has reached positive territory and the Stochastic Oscillator has made a bullish cross.
Therefore, Bitcoin is expected to soon make an attempt at breaking out above $12,000.
Possible Retracement
Despite the bullishness from the long-term price action and indicators, the shorter-term chart looks more bearish.
The price has been struggling to move above $11,400 and weakness has started to show. The 6-hour RSI has generated some bearish divergence and the MACD has begun to decrease.
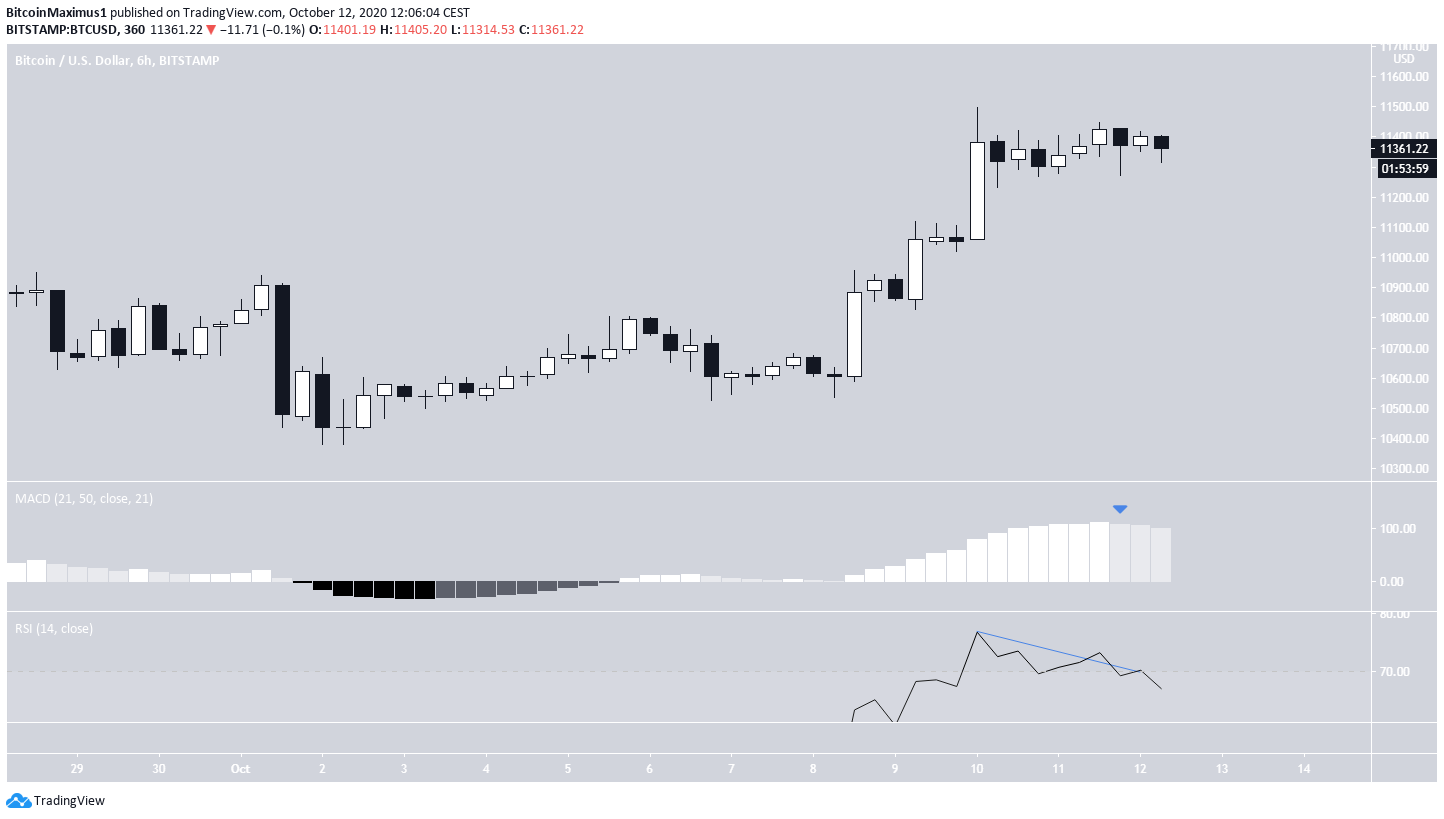
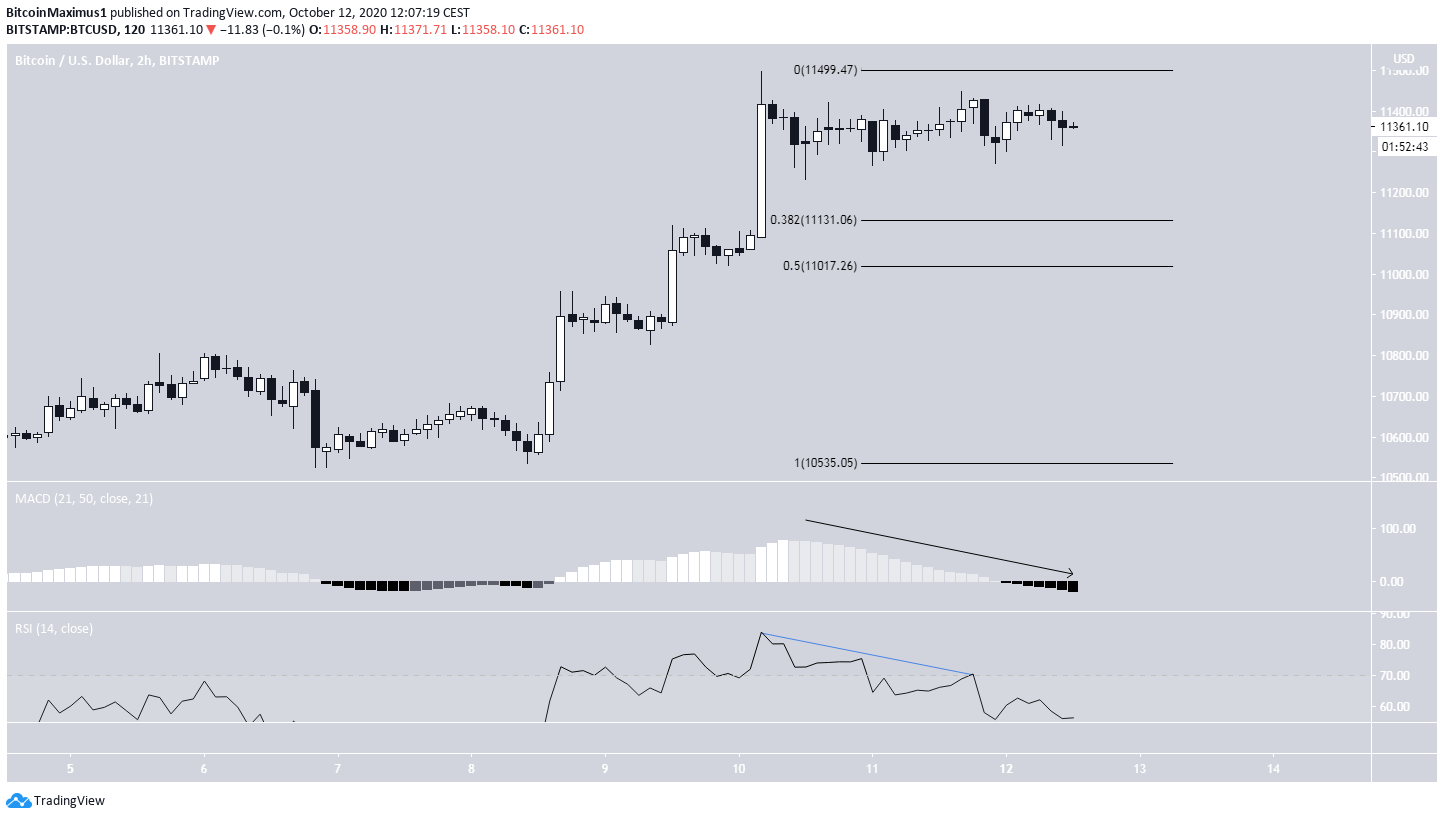
The 2-hour chart looks even worse considering the bearish divergence and MACD flipping negative.
Therefore, a decrease towards the 0.382-0.5 Fib levels between $11,017-$11,131 would be expected before the upward move continues.
To conclude, the Bitcoin price is expected to eventually make an attempt at breaking out above the $11,600-$12,000 resistance area. A short-term decrease is likely to occur prior to the breakout attempt.
For BeInCrypto’s previous Bitcoin analysis, click here!
Disclaimer: Cryptocurrency trading carries a high level of risk and may not be suitable for all investors. The views expressed in this article do not reflect those of BeInCrypto.
