


On Aug 17, the Bitcoin (BTC) price created a bullish engulfing candlestick and broke out above its previous high.
While the breakout looks legitimate, it is not yet clear if there is enough buying power for BTC to continue making higher-highs.
Bitcoin’s Questionable Breakout
On Aug 2, the Bitcoin price reached a high of $12,123 but dropped sharply the same day. Since then, the $12,000 area has been acting as resistance, thwarting multiple attempts at a breakout since.
Yesterday, the Bitcoin price created a bullish engulfing candlestick and was finally successful in breaking out and closing over $12,000. In the future, the same area is expected to act as support.
Technical indicators are providing mixed signals.
There is a bearish divergence in the daily RSI, and volume has been very low during the breakout. On the bullish side, the MACD has shown a bullish reversal signal and has nearly turned positive.
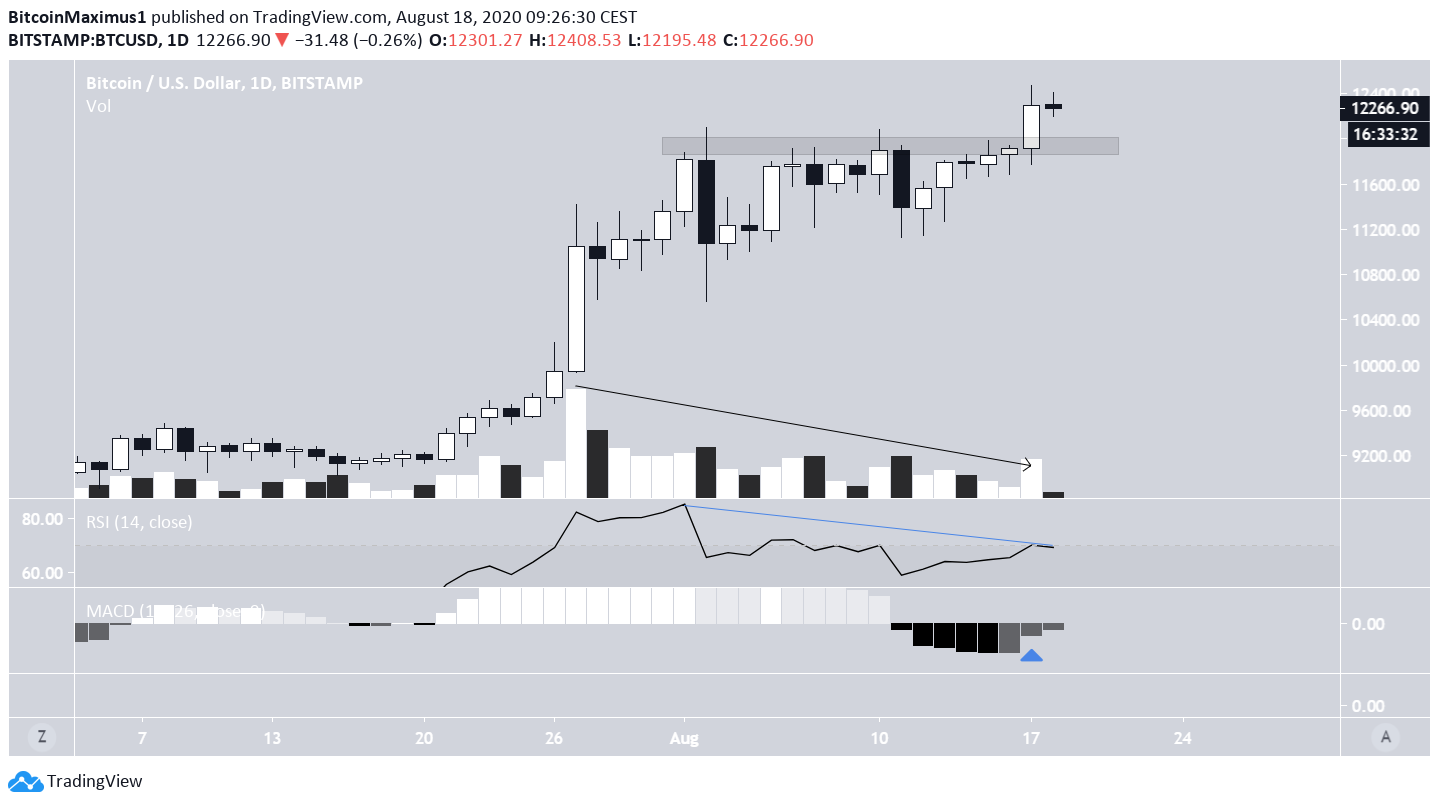
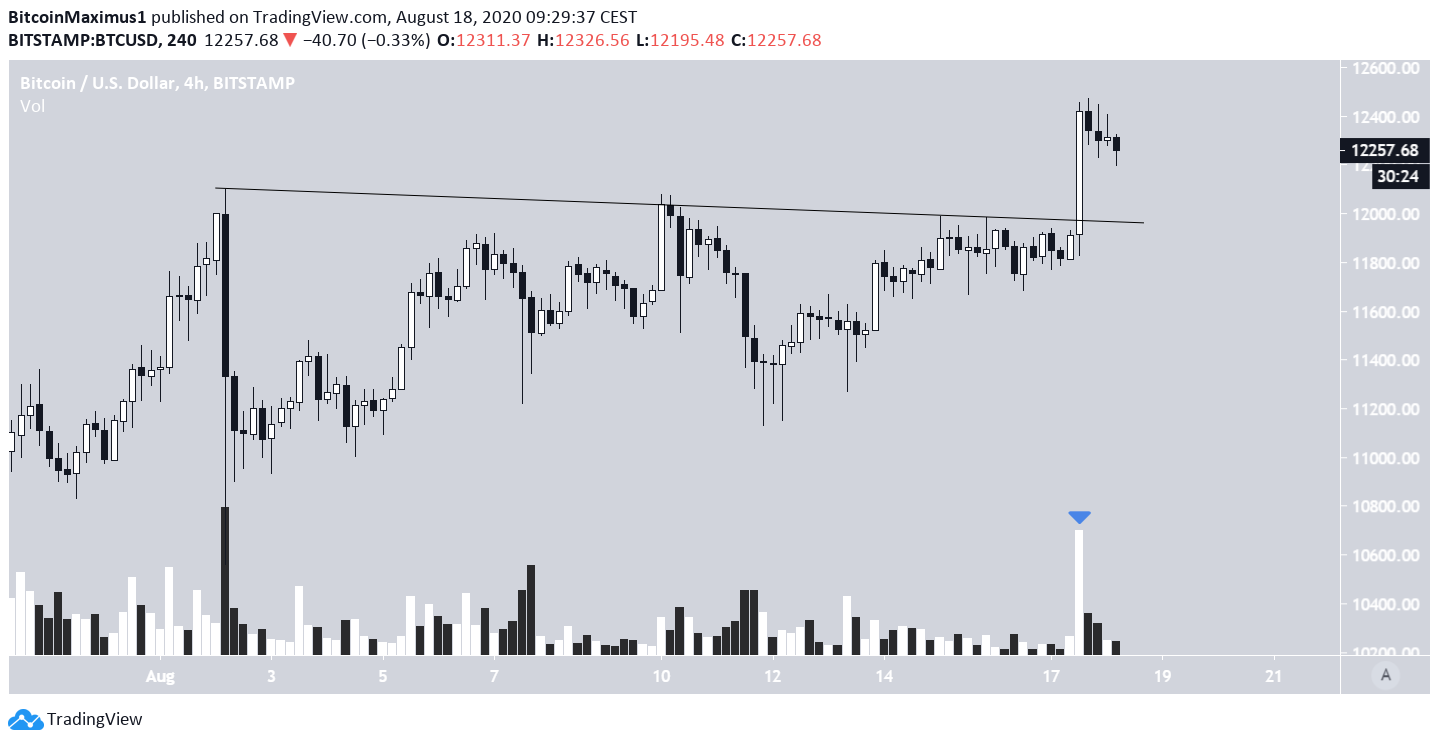
The shorter-term chart reveals a breakout from a descending resistance line. Furthermore, it shows that volume was significant during the initial breakout but waned shortly after.
The conflicting signs make it difficult to determine the validity of the breakout until we see a reaction of the price to the breakout level/descending resistance line.
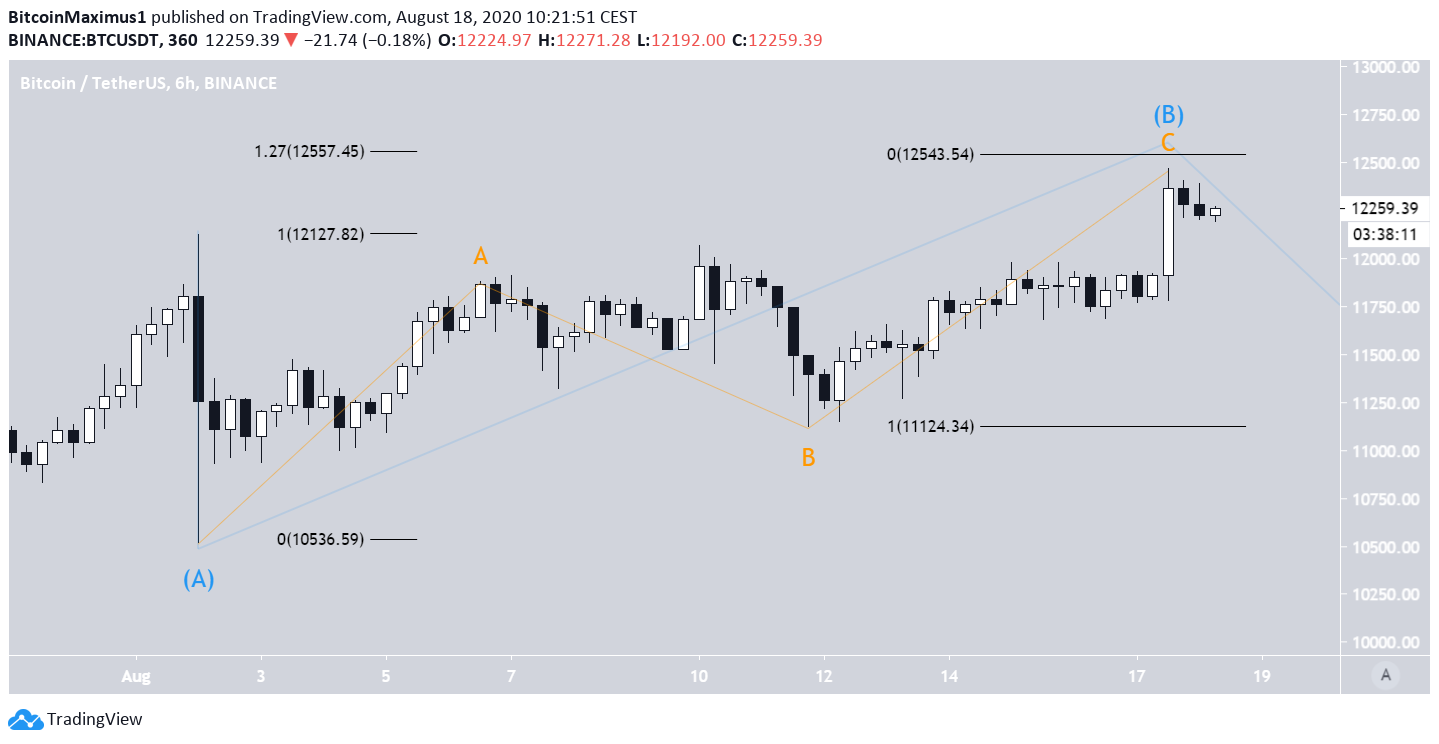
Wave Count
Since the August 2 breakdown, the price has been making higher lows. However, due to the considerable overlap and sub-wave formation, it’s possible that the upward movement is corrective rather than impulsive.
If so, the price is still in a B wave (blue), that is transpiring with an A-B-C sub-wave formation (orange).
The most likely high for the C wave would be found near $12,550. The high is found by projecting the length of sub-wave A to the bottom of sub-wave B (orange). Furthermore, it is the 1.27 Fib level of the external retracement of wave A (blue)
In the shorter-term count, we can see that the C sub-wave (orange) is transpiring in a five minor sub-wave pattern (green). The price is currently in the fifth and final wave. Projecting the length of wave 1 to the bottom of 4 gives us a target of $12,632, very near our estimated top from the previous section.
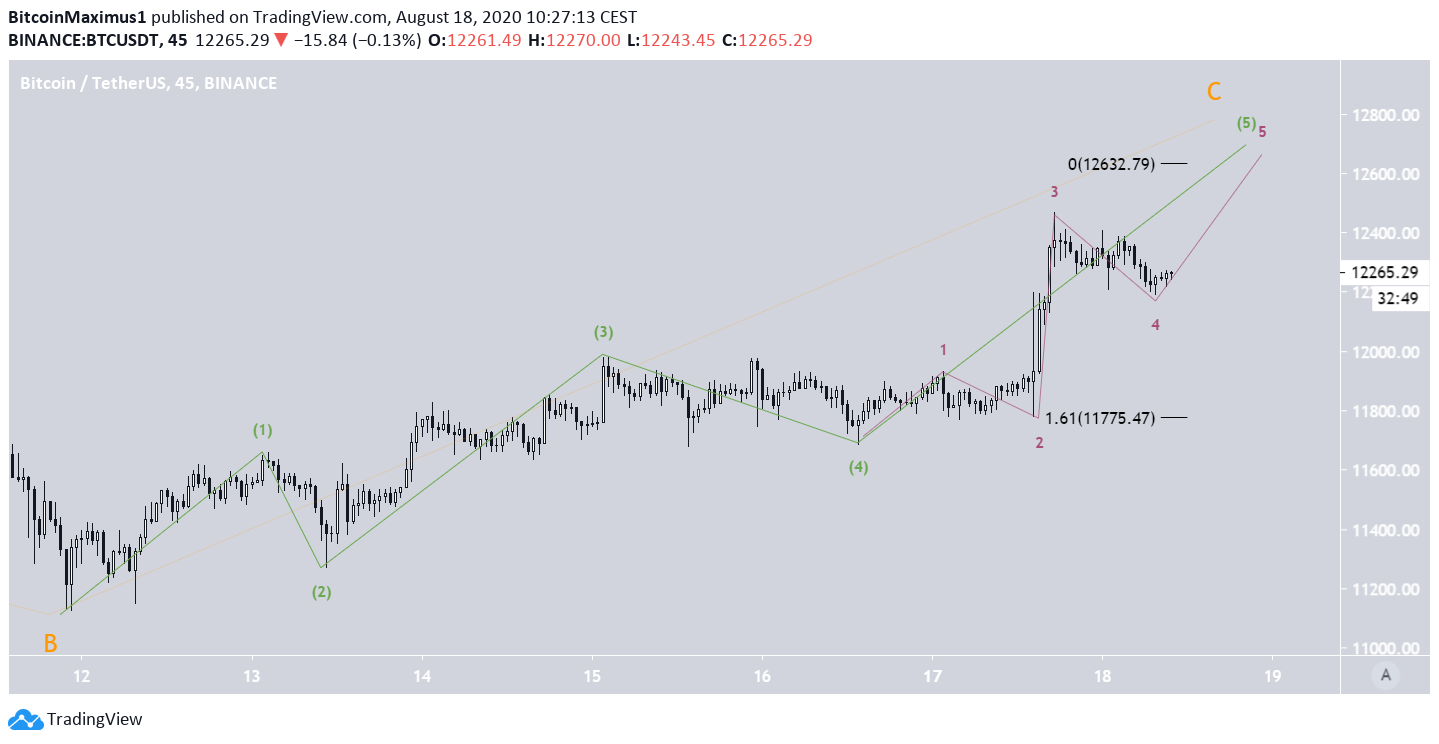
To conclude, even though Bitcoin broke out yesterday, the most likely scenario has the price going to $12,550 before a retracement.
For our previous analysis, click here.


