


On April 6, the Bitcoin price created a bullish engulfing candlestick and moved above several important resistance levels, including the yearly open. The rally has stalled, however, since reaching the 50-day moving average (MA).
Bitcoin Daily Levels
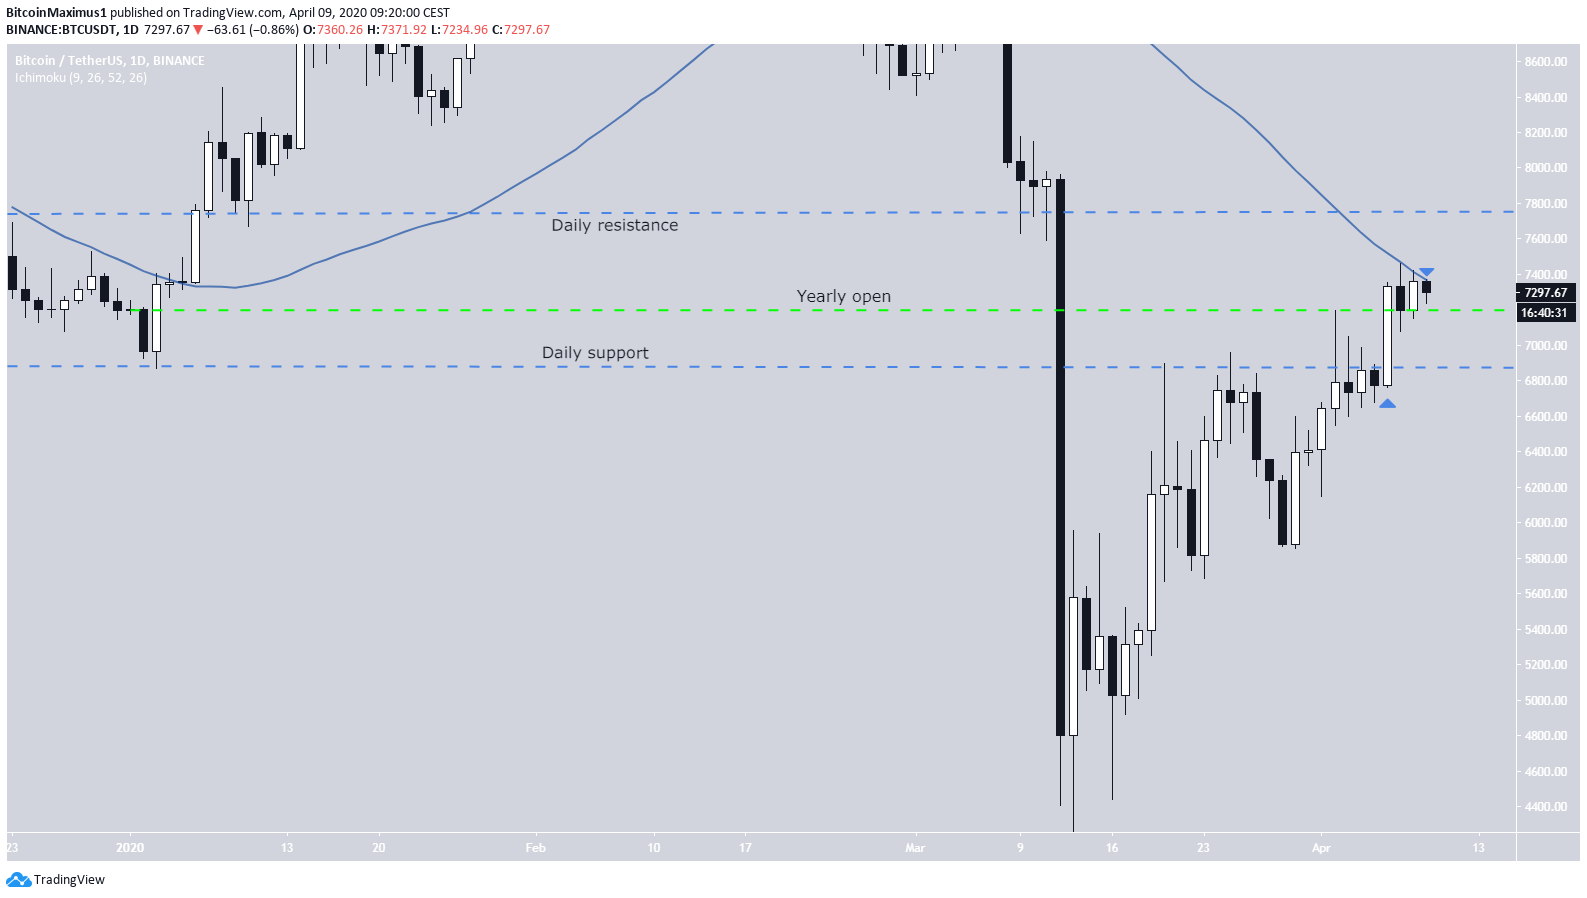
The BTC price has increased significantly since reaching a low on March 13, creating at least four higher-lows. This is a sign indicating that the price is in a bullish trend.
Looking at the daily chart, we can see that BTC created a bullish engulfing candlestick on April 6 and moved above the main resistance level at $6,850. The increase has been continuing and the price has also moved above the yearly open.
However, the rally stopped once the price reached the 50-day MA, which it has yet to flip as support. If it is successful in doing so, the next resistance level up is found at $7,750.
Short-Term Perspective
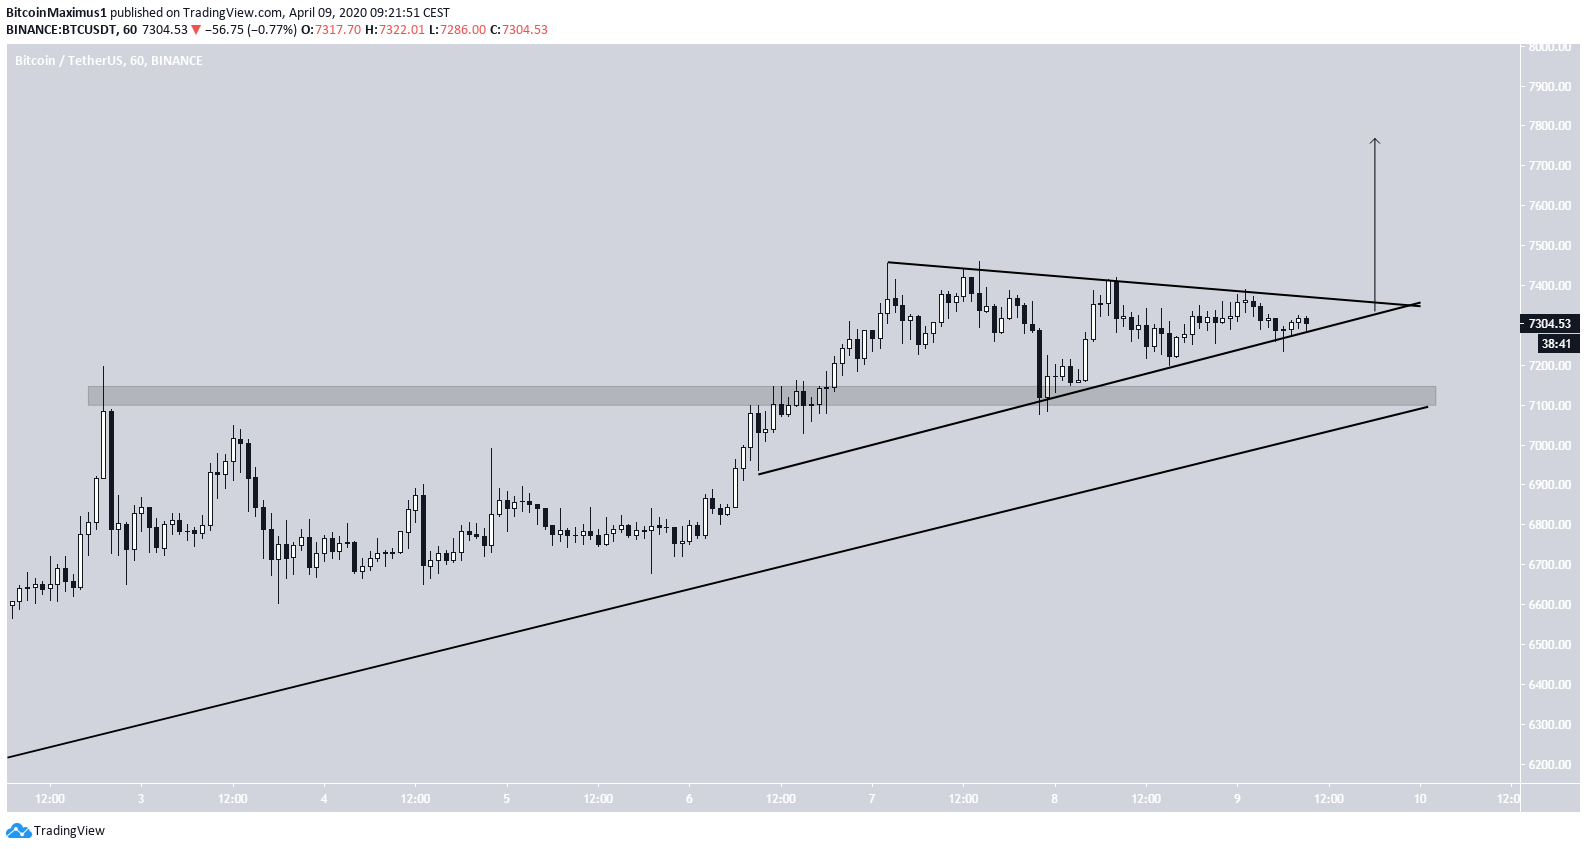
In the short-term, the price is following an ascending support line and has been doing so since March 30. However, it also seems to have created a short-term symmetrical triangle, which is considered a neutral pattern. Since it is occurring while the price is in an upward trend, a breakout from this pattern is expected.
Even if the price breaks down, it would be very likely if it found support at $7,100, a confluence of both a significant support level and the ascending support line. Therefore, a breakdown from the short-term triangle would not necessarily mean that the upward trend has ended.
The proposed breakout would also take the price towards the resistance line of the ascending wedge it has been trading in since reaching the March 13 bottom.
If so, the price would likely complete the fifth and final wave of an Elliott formation, after which a breakdown would be expected.
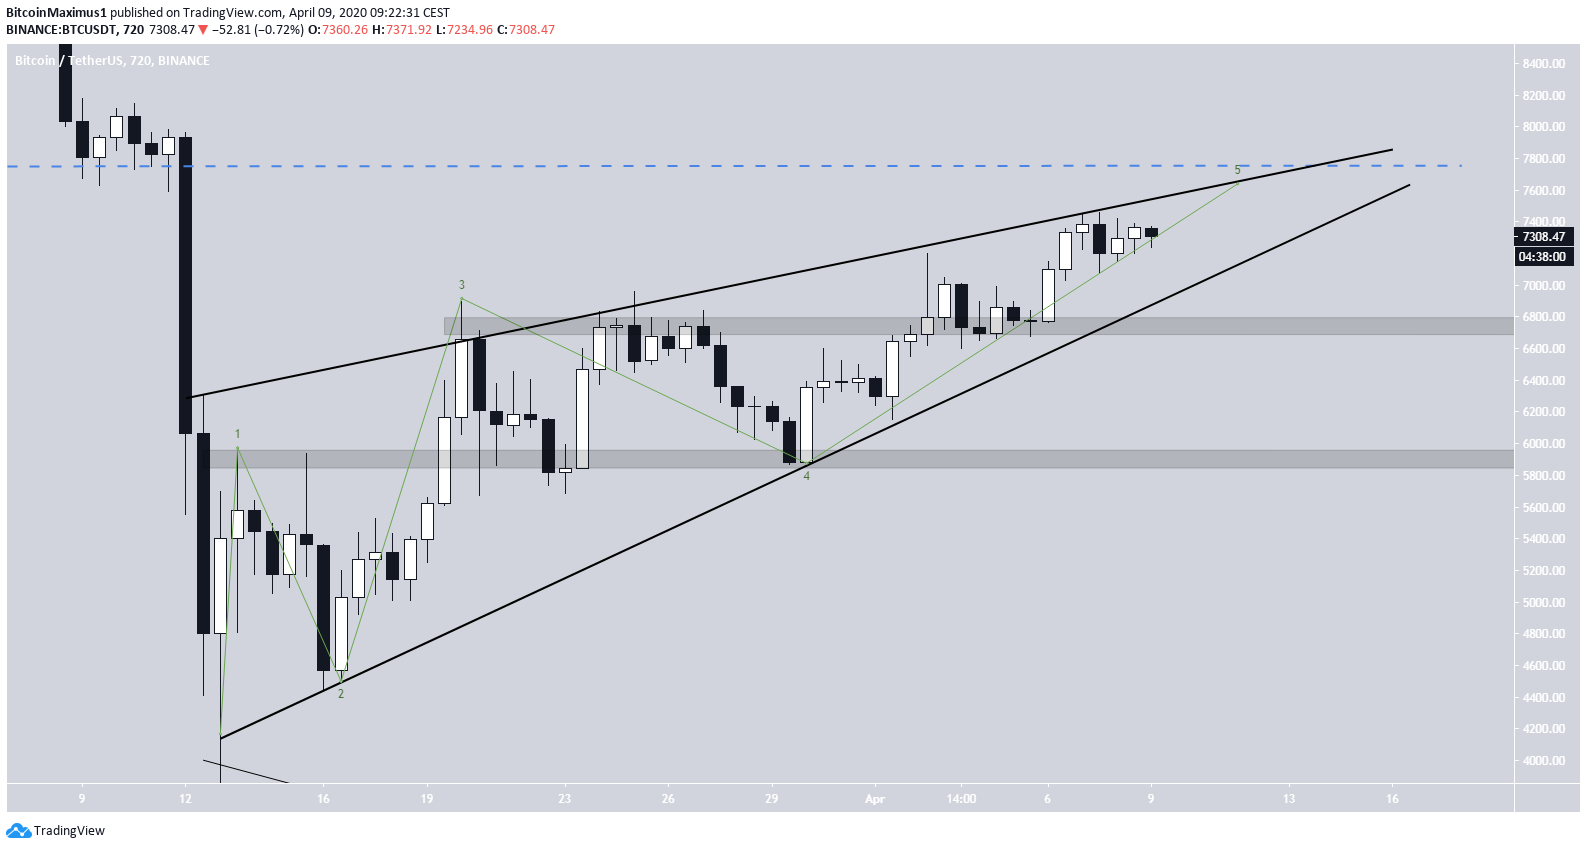
A strong movement above $7,800 would invalidate the wedge formation and indicate that the price is not yet done moving upwards. At the time of writing, this does not seem likely.
To conclude, the BTC price is trading inside a short-term symmetrical triangle and a longer-term ascending wedge. A breakout from the triangle would likely take the price to the resistance line of the ascending wedge.
For those interested in BeInCrypto’s previous Bitcoin analysis, click here.


