
The Bitcoin price has bounced at an important support level and created a descending wedge, from which the price is expected to break out.
The Bitcoin price has been decreasing since May 14, trading inside a descending wedge. At the time of writing, it was approaching the projected end of the descending wedge, which is considered a bullish reversal pattern.
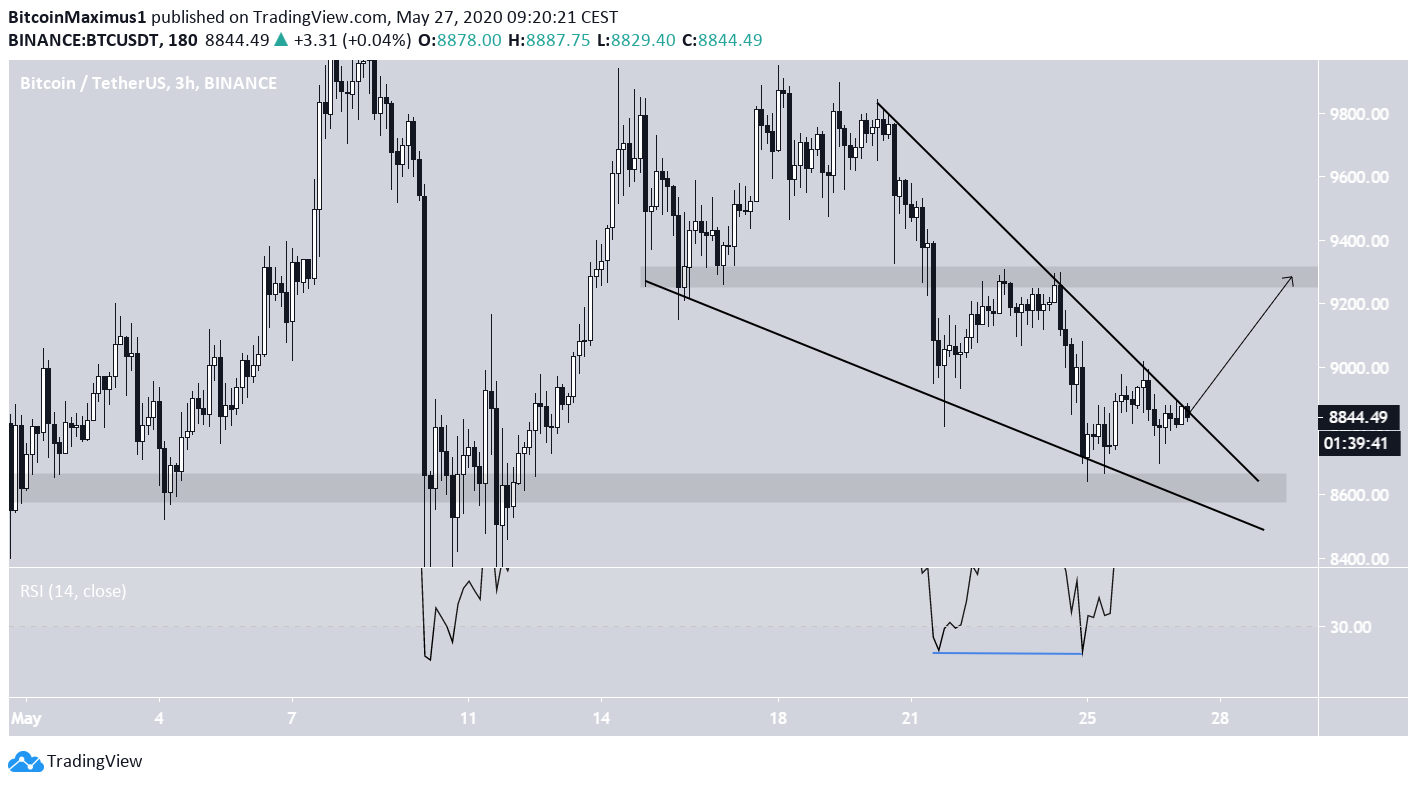
Bitcoin Falling Wedge
During the final two touches of the support line, the RSI generated considerable bullish divergence, another sign that the price is likely to break out. If it does, the closest resistance area is found at $9,300, the midpoint of the wedge.
The closest support level is found at $8,600. The price reached this level during the final touch of the support line, created a long lower-wick, and began to move upwards.
Future Movement
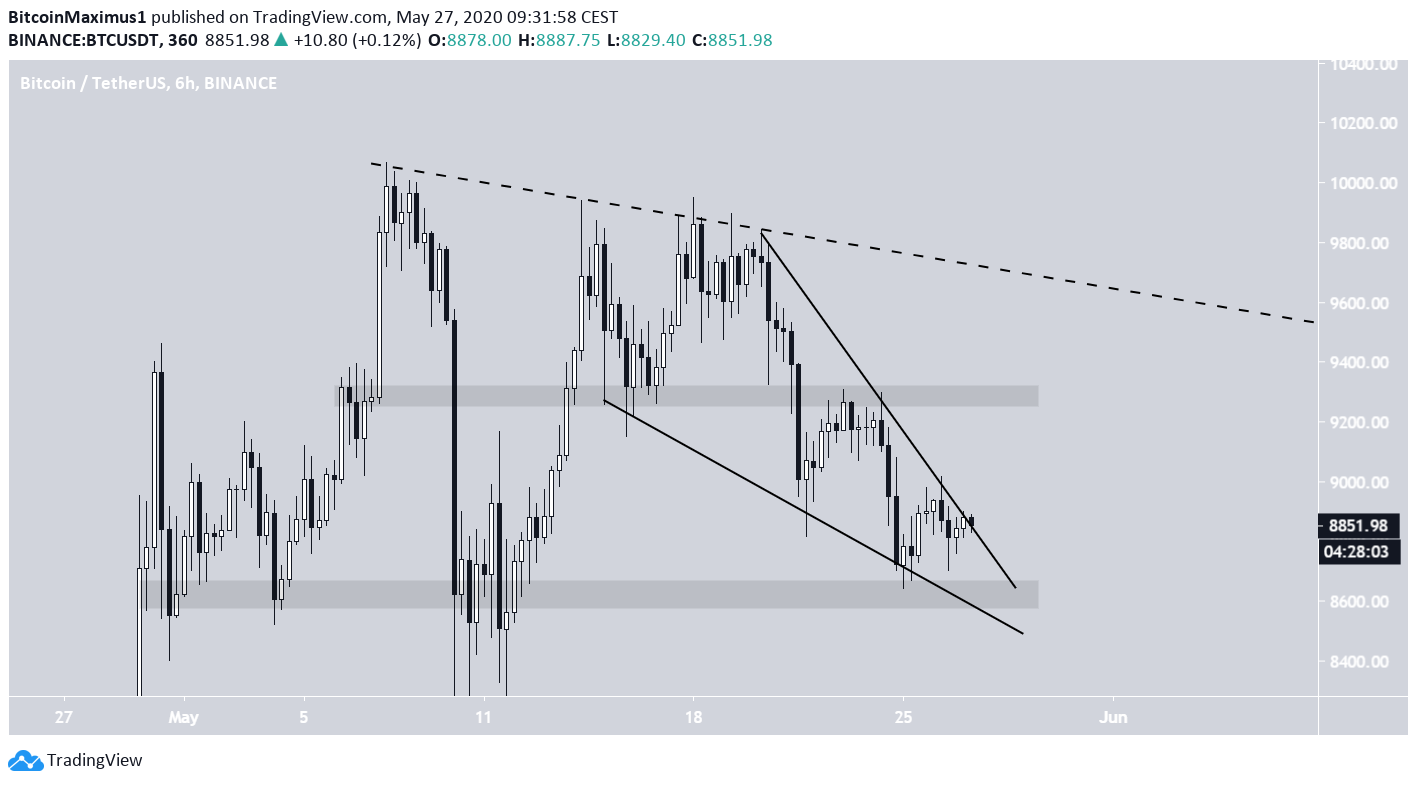
If the price were to break out and reach the aforementioned resistance area, the next important resistance level would be the descending resistance line that is drawn from the May 6 high, currently being near $9,500.
Until the price breaks out above this line, we cannot consider the upward price movement as the beginning of a new upward trend, rather a retracement in response to the prior decrease.
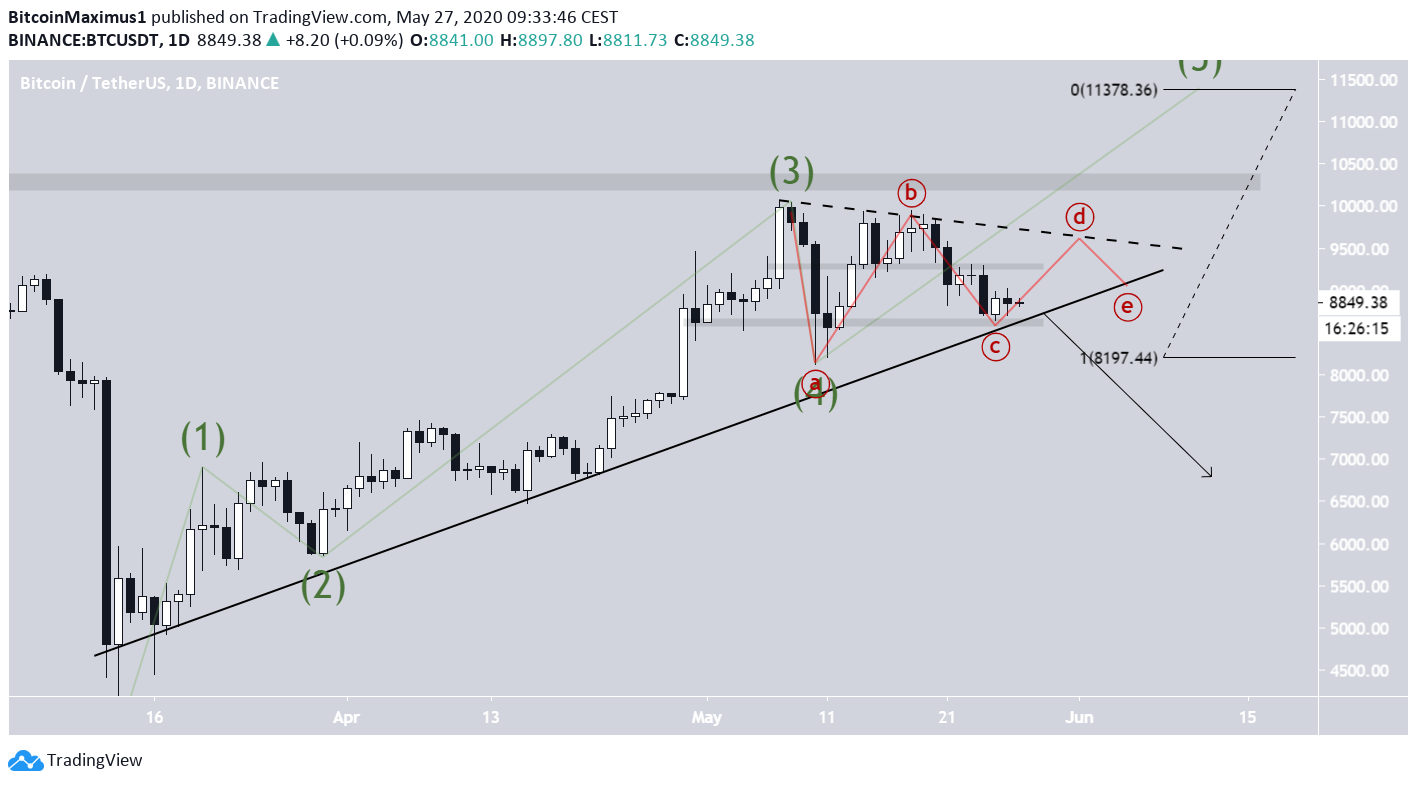
As for the longer-term future movement, there are two possible options.
First, the price breaks down from the long-term ascending support line, after consolidating in the newly created symmetrical triangle. This would indicate that the upward trend has ended, confirmed by a daily close below $8,500.
The second is that after consolidating in the triangle, the price breaks out and finishes what seems to be the fifth and final wave of an Elliott formation. Based on the length of wave 1, this move could take the price all the way to $11,400.
For those interested in BeInCrypto’s previous Bitcoin analysis, click here.
