


After the rapid downward move on May 24, BTC has been showing signs of life with a slight upward retracement.
However, it has yet to move above the first important resistance area, found at $8,950.
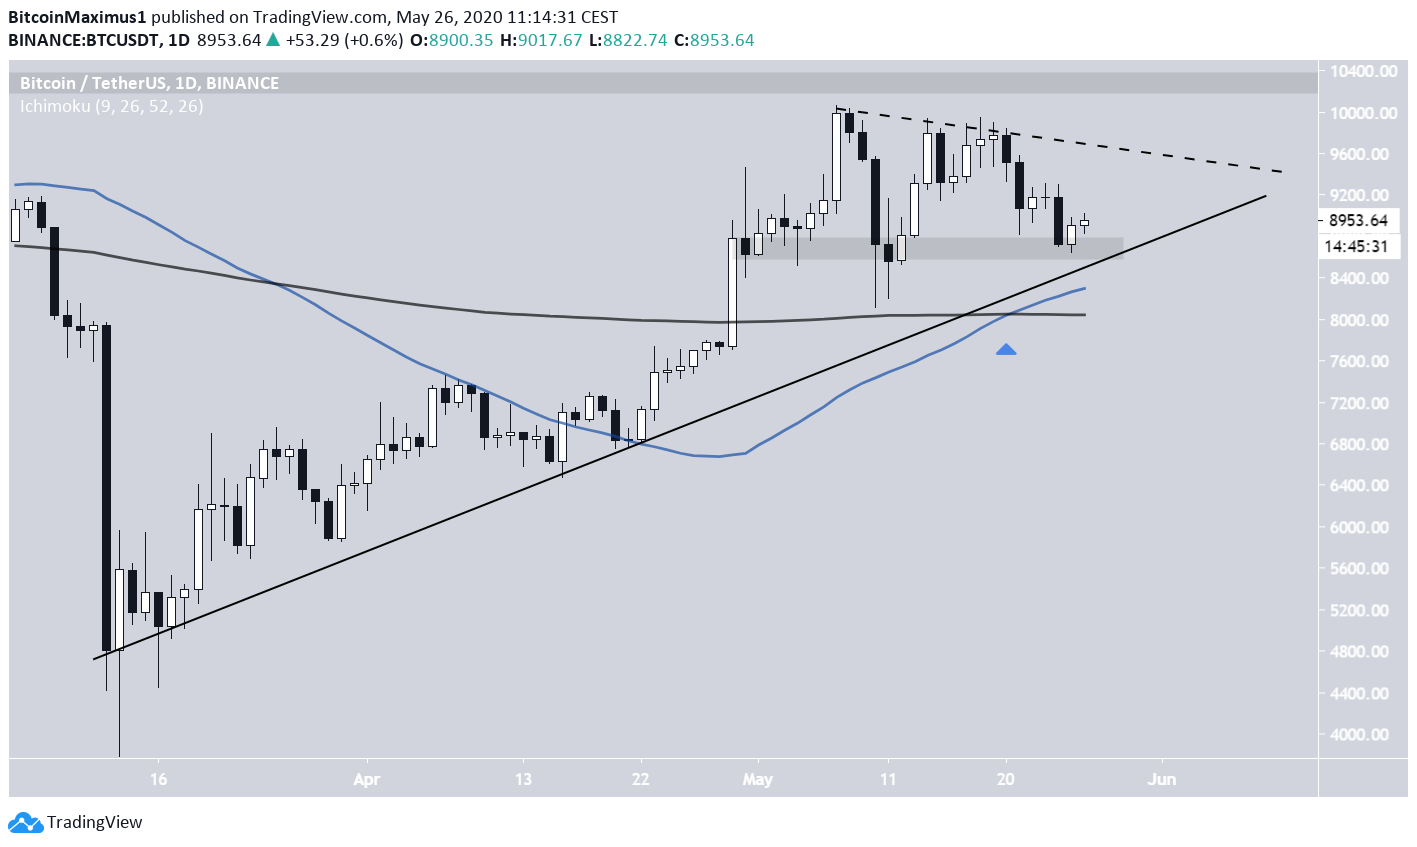
Bitcoin Ascending Support Line
The Bitcoin price has been following an ascending support line since it reached a bottom on March 13. However, it has not touched this line since the rate of increase accelerated on April 21. At the time of writing, the price was trading slightly above this support.
However, the price is also sitting very near a confluence of two other support levels, the $8,550-$8,700 horizontal support level and the 50-day moving average (MA), which has just made a bullish cross with the 200-day MA.
Therefore, after a slight decrease to validate this line once more, this could be a good level to initiate a bounce.
As for the resistance line, while it is not yet entirely clear, it seems that BTC is following a descending resistance line (dashed). As long as the price is trading below this line, it is considered bearish, and all price increases are considered retracements.
Therefore, as long as the price is trading inside this possible symmetrical triangle, the direction of the trend is still unclear.
Current Retracement
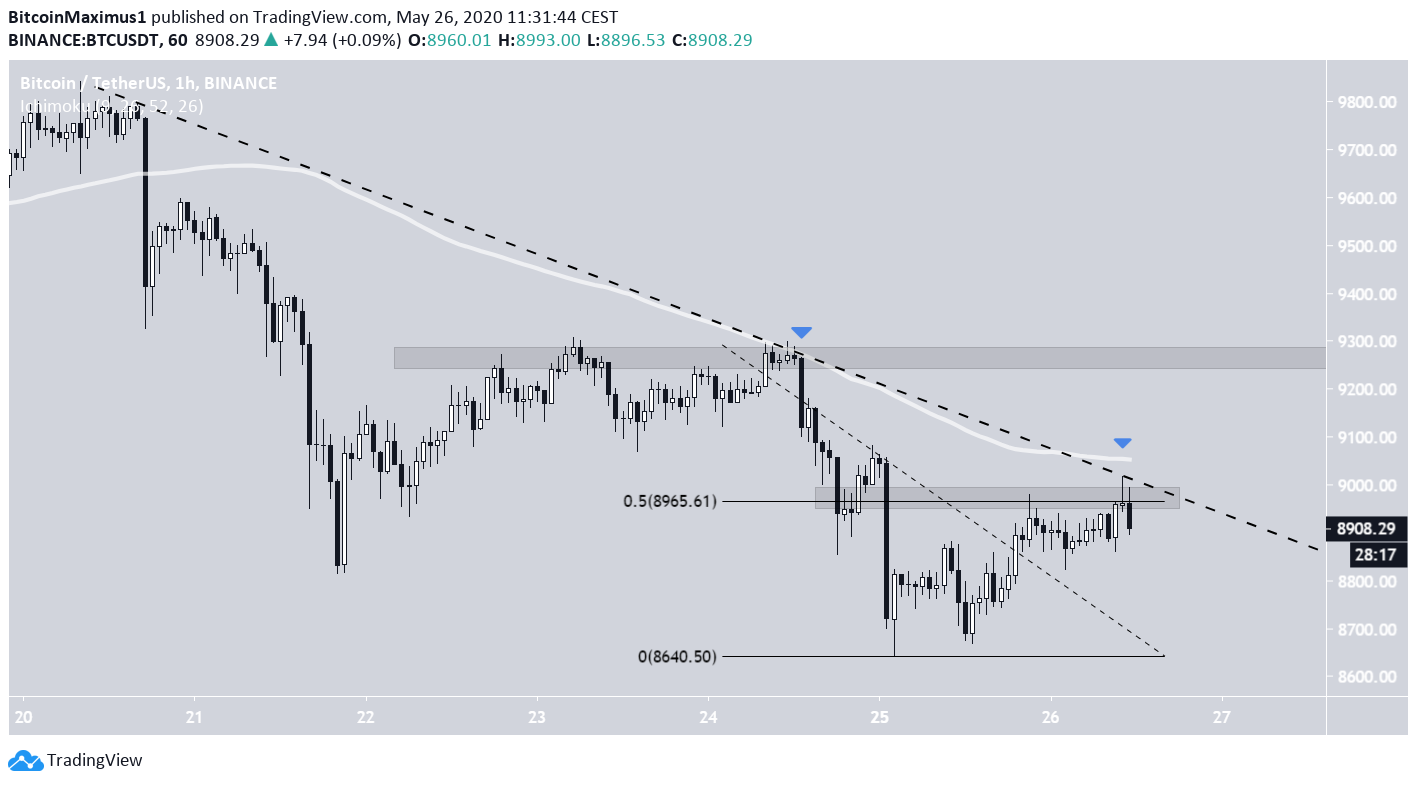
In the shorter-term, the BTC price has been following a descending resistance line since the decrease began on May 20, having validated it thrice until now.
This morning, the price was rejected by the resistance line, along with the 0.5 Fibonacci level of the entire decrease at $8,950 and the 100-hour MA, which also rejected the price on May 24. Therefore, until the price successfully flips the $8,950 level as support, its movement is considered bearish.
A breakout would likely take the price towards $9,300. At the time of press, there are no indications that BTC will break out.
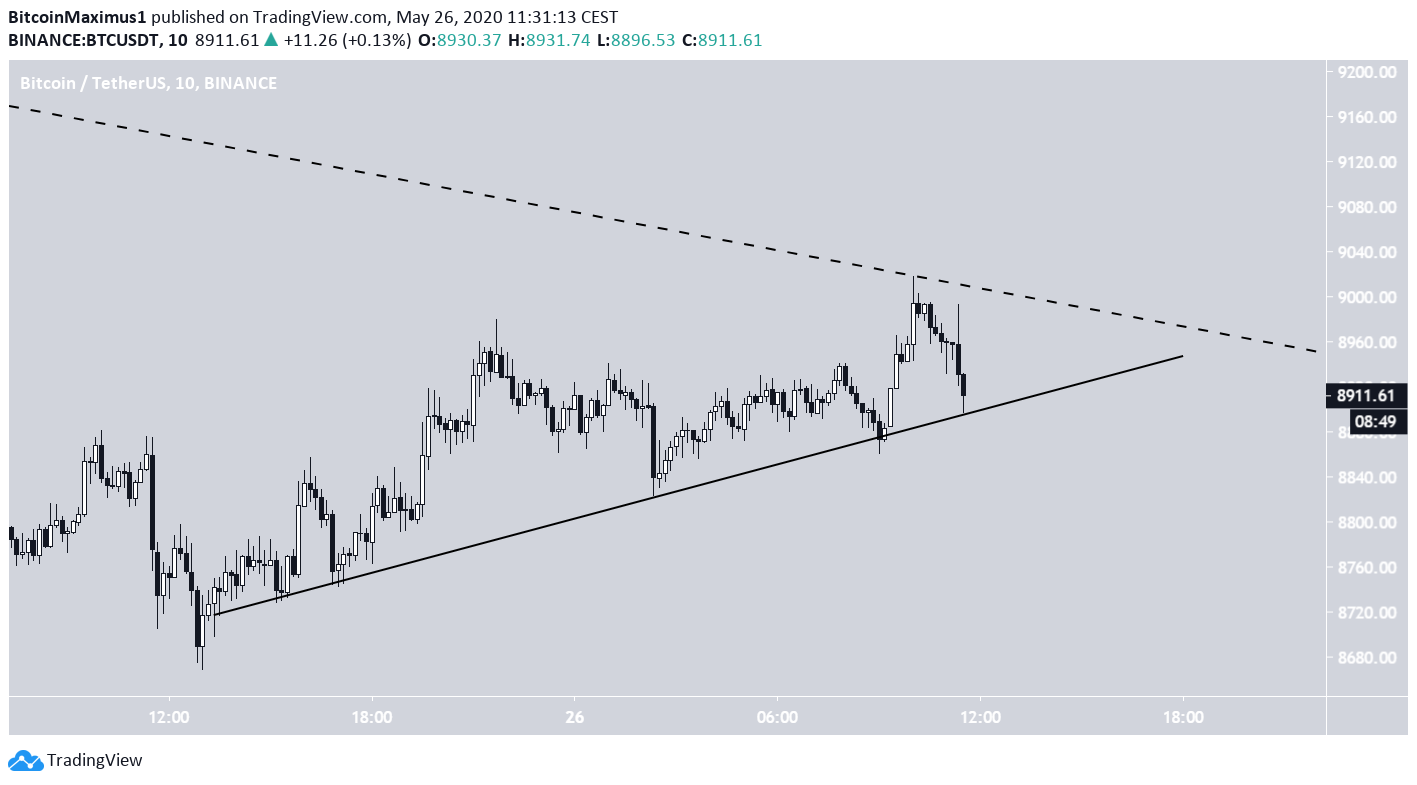
Using the 10-minute chart we can see that the price is also following a very short-term ascending support line, which should coincide with the descending resistance line later tonight.
Therefore, the price is expected to determine the direction of its trend by tonight at the latest. For the time being, it seems slightly more likely that BTC will break down from this ascending support line and head towards the $8,700-$8500 levels.
For those interested in BeInCrypto’s previous Bitcoin analysis, click here.


