


After a parabolic increase, the BTC price stalled and created a Spinning Top candlestick on Nov 18.
The price has begun to show signs of weakness, but a breakdown is not yet confirmed.
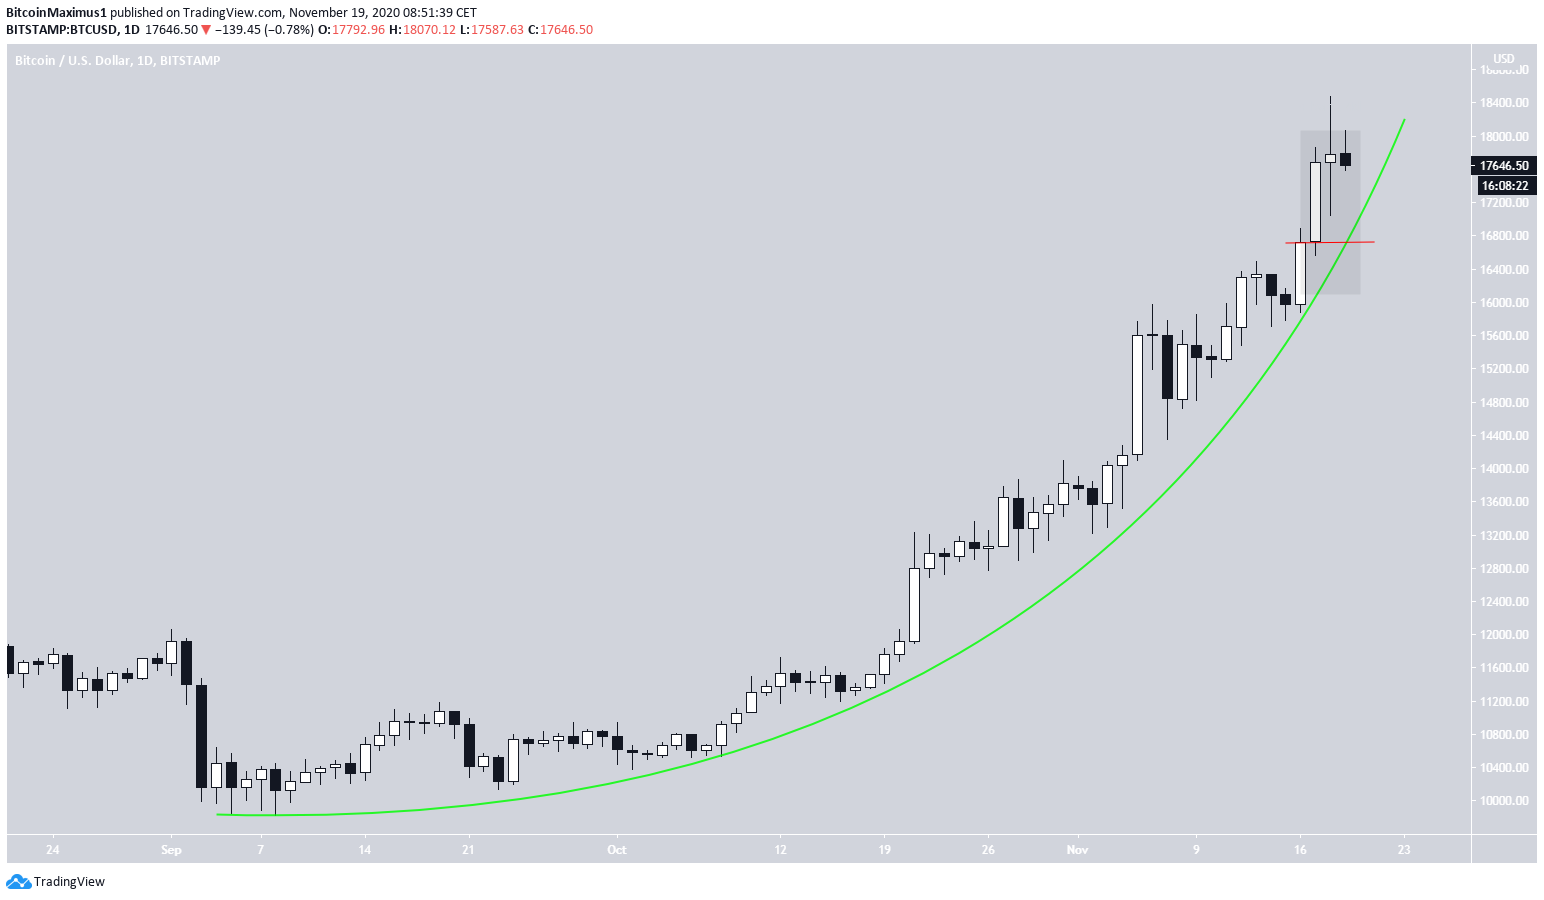
Bitcoin Follows Parabolic Support
The Bitcoin price has been following a parabolic ascending support line since the beginning of September. At the time of press, BTC was trading just above this support line.
On Nov 18, BTC followed up its previous bullish candlestick with a Spinning Top, a sign of indecision, especially when coming after such a strong upward trend.
The price is also in the process of completing an evening star pattern (highlighted). The pattern would be complete with a close below $16,700, the opening price on Nov 17 (red line).
Such a decrease would also cause a breakdown from the parabolic support line.
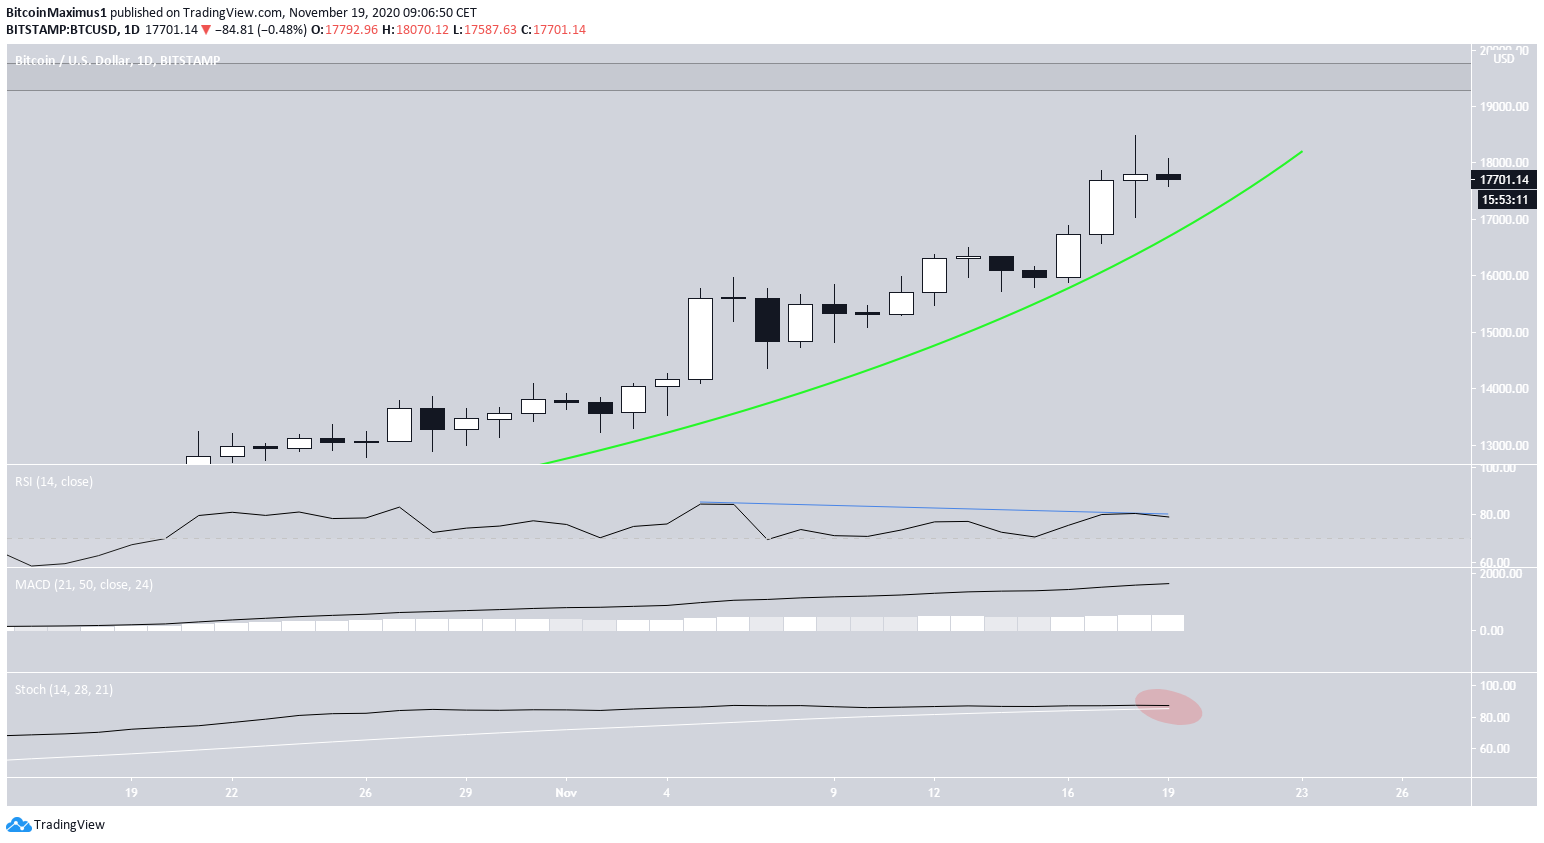
Technical indicators in the daily time-frame have begun to show weakness. The RSI has generated a bearish divergence and the Stochastic oscillator has begun to roll over, possibly getting ready to make a bearish cross.
While the MACD is overextended, it has not yet begun to decrease.
While these are potential signs of weakness, they do not yet confirm a downward trend. A breakdown from the line would likely cause a bearish cross and a decrease in both the MACD and RSI, confirming the reversal.
Short-Term Movement
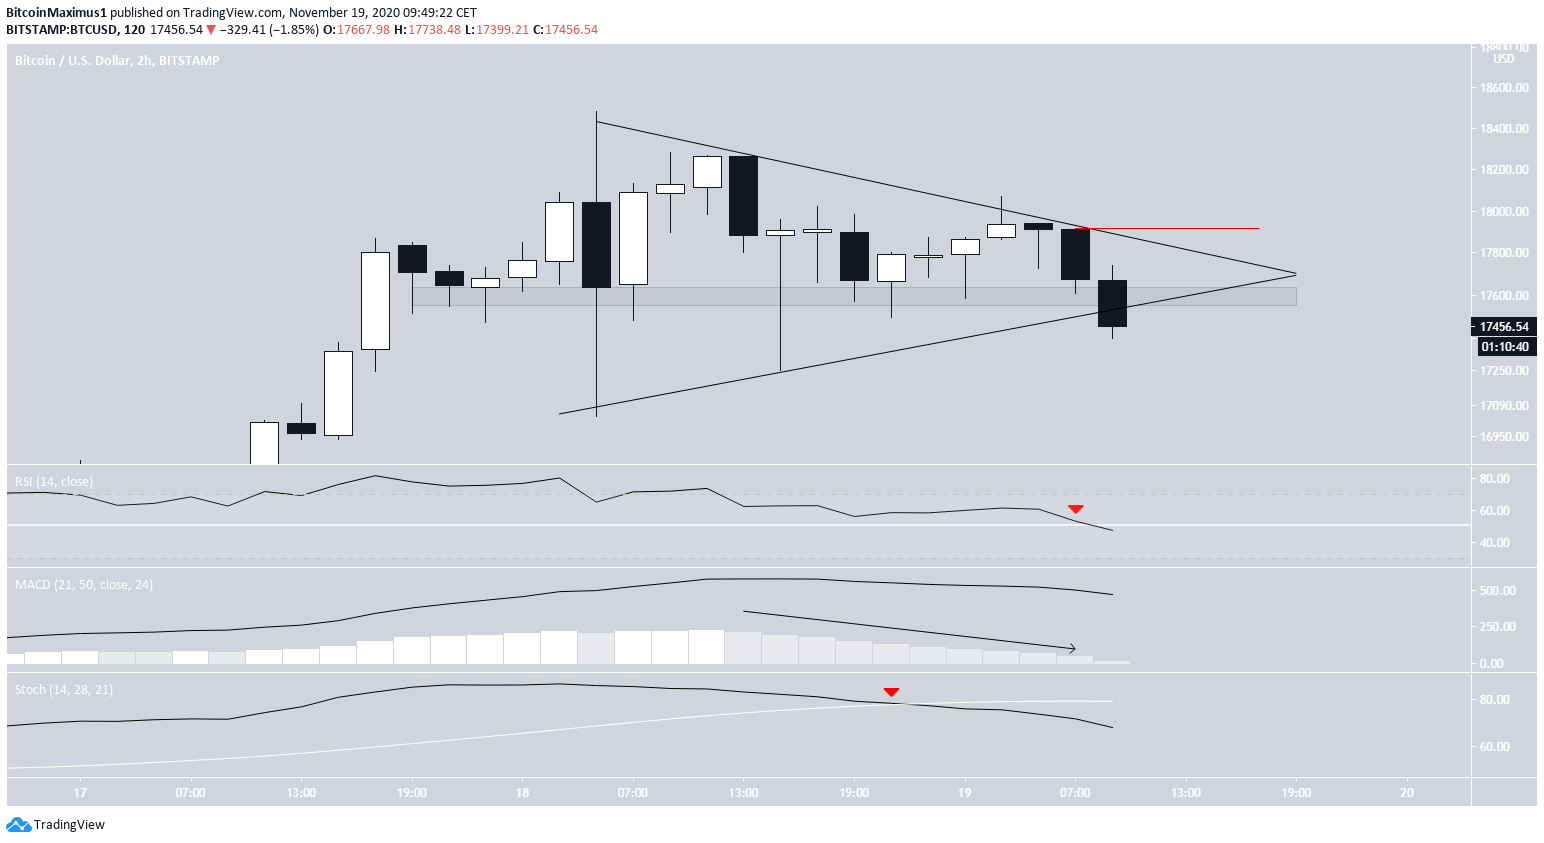
The shorter-term chart shows that the price is trading inside a symmetrical triangle, currently being at the support line of the pattern. Furthermore, it is trading inside the $17,550 support area.
A breakdown from the triangle would likely take the price back down to $16,770, the 0.618 Fib level of the most recent increase. This zone is also a horizontal support level and the target found by projecting the length of the triangle to the breakdown point.
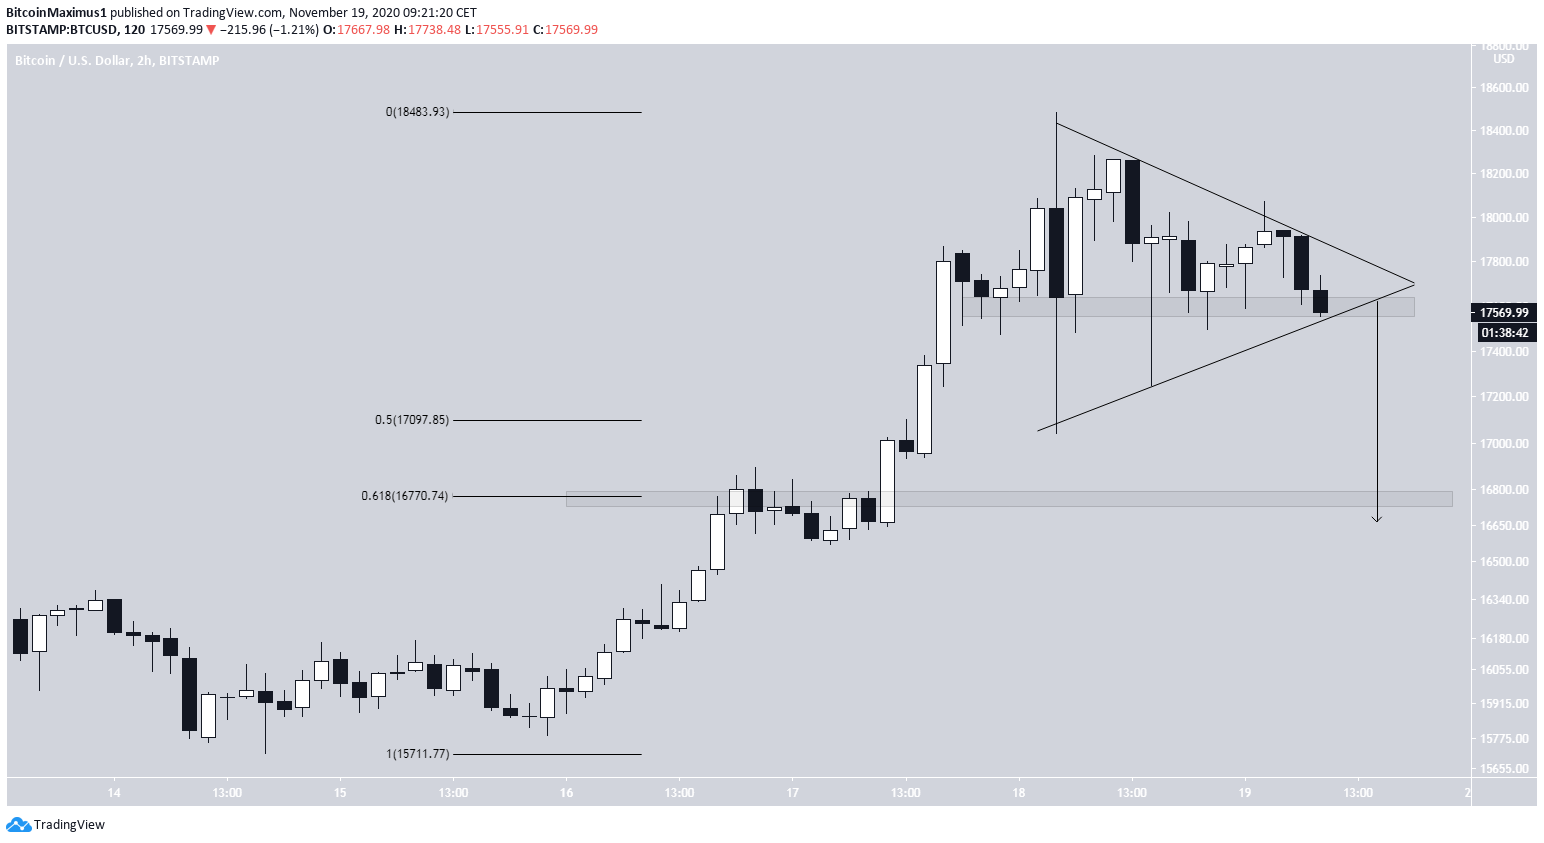
If the support area manages to hold and cause a breakout above the symmetrical triangle (red line), BTC might increase above the Nov 17 high and move towards the all-time high price near $19,500.
At the time of press, however, that scenario seems unlikely.
Conclusion
Bitcoin created a Spinning Top candlestick and stalled after a massive increase. The price is trading inside a short-term symmetrical triangle, from which a breakdown is the most likely outcome.
For BeInCrypto’s previous Bitcoin analysis, click here!
Disclaimer: Cryptocurrency trading carries a high level of risk and may not be suitable for all investors. The views expressed in this article do not reflect those of BeInCrypto


