


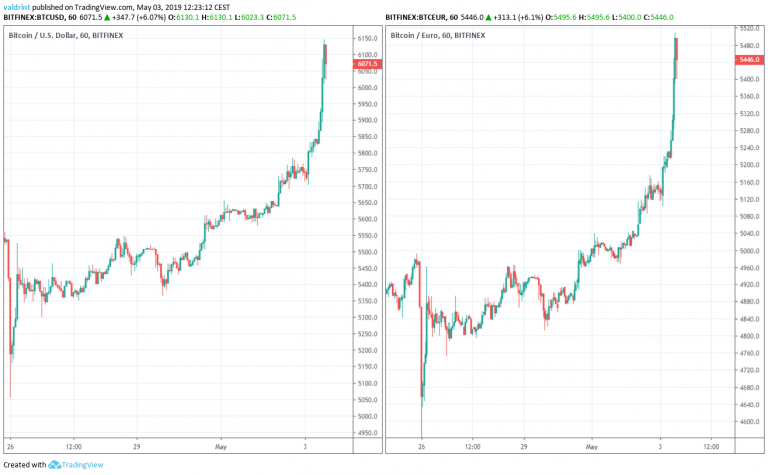
On Apr 26, the price of BTC reached lows of $5055 and €4539. A gradual increase ensued, which intensified on May 3.
Will Bitcoin continue rising and make new highs or is a reversal in store?
Let’s find out:
Bitcoin (BTC): Trends and Highlights For May 3, 2019
- Both BTC/USD and BTC/EUR reached a low on Apr 26.
- Bitcoin is following an ascending support line.
- It broke out from a long-term ascending channel.
- The breakout occurred on slightly above average volume.
- Bearish divergence is developing in the RSI and the MACD.
- There is resistance near $6400 and €5650.
A Look at the Current Trading Pattern
On Apr 26, the price made a low of $5055. A gradual increase followed. The price has made several higher lows during this period.
Tracing these lows gives us an ascending support line:
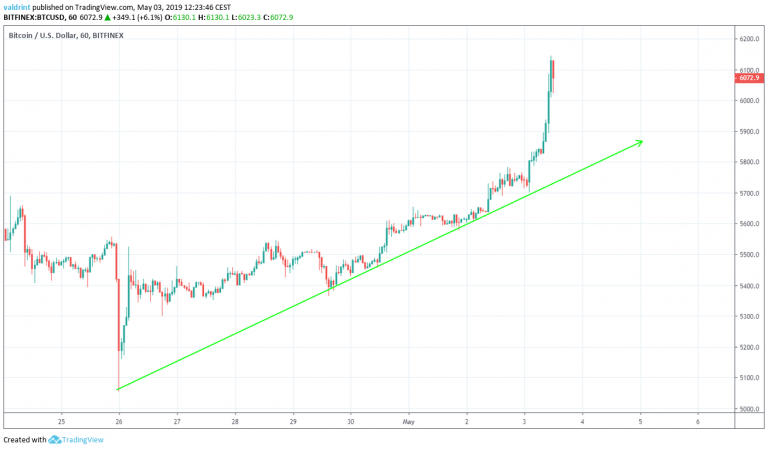
The price is not following any visible resistance line. In order to predict future price movement, a look at technical indicators and previous movement is required.
Previous movement
To better assess future price fluctuations, we analyze the price of Bitcoin at six-hour intervals from Apr 1 to May 3 alongside volume.
It is shown in the graph below:
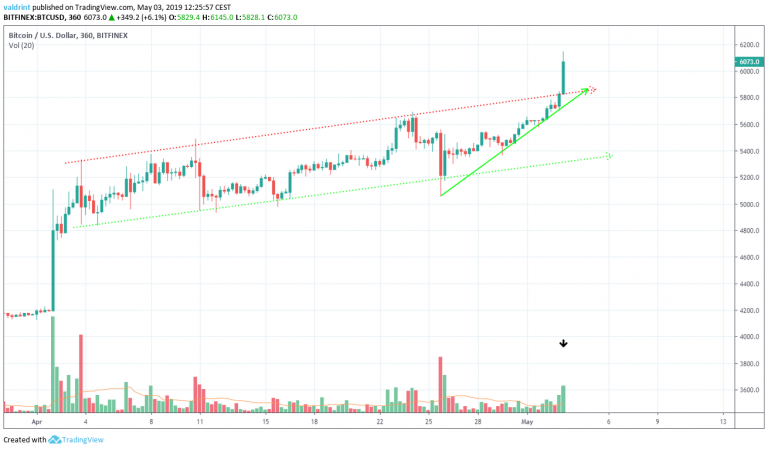
The price had been trading inside an ascending channel since Apr 3. It has touched both the resistance and support lines multiple times.
On May 3, the price broke out above the resistance line of the channel. The breakout occurred on slightly above average volume. This may indicate that the breakout is not strong and the price may soon reverse.
In order to confirm this assumption, we need to take a look at other technical indicators inside a longer time-frame.
Technical Indicators
The price of Bitcoin is analyzed at one-day intervals from Oct 2018 to May 2019 alongside the RSI and the MACD.
The moving average convergence divergence (MACD) is a trend indicator that shows the relationship between two moving averages (long and short-term) and the price. It is used to measure the strength of a move.
Combining RSI bullish/bearish divergence with support/resistance essentially predicts price fluctuations. They are shown alongside Bitcoin’s current trading pattern below:
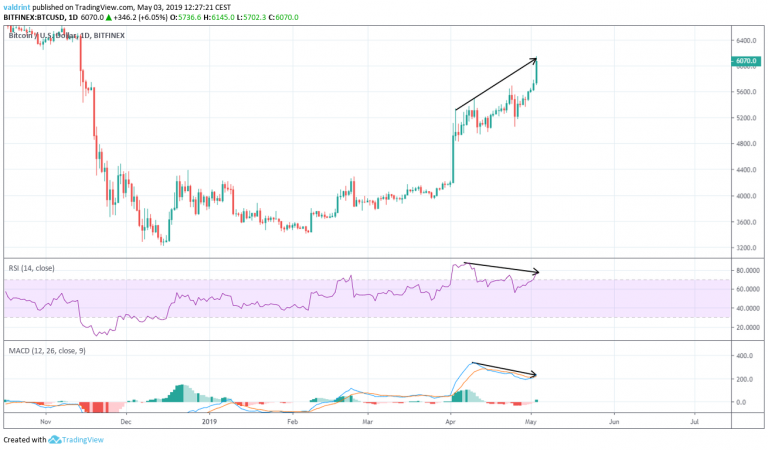
On Apr 3, the price made a high of $5335. After several increases and decreases throughout the month, it made another high of $6145 on May 3.
Similarly, the RSI and the MACD made the first high on Apr 3. However, they have proceeded to generate lower values. This is known as bearish divergence and often precedes price decreases.
Using these indicators and previous movement, it is likely that the price is approaching the end of its downtrend.
Resistance Areas
To better determine reversal levels and support areas inside the confines of the channel, we incorporate resistance areas into this section of the analysis.
One resistance area is traced for BTC/USD and BTC/EUR below:

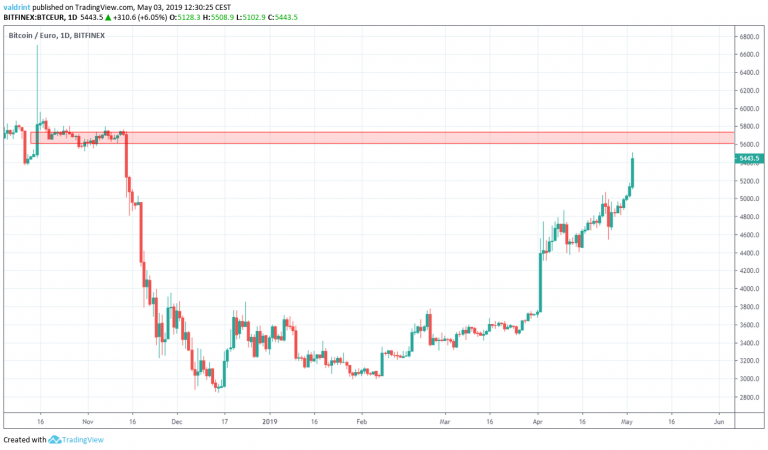
The closest resistance area is near $6400 and €5650. We believe that it is unlikely that the price will move above this area.
Conclusion and Summary
According to our analysis, the price of Bitcoin is nearing the end of its uptrend. Short-term increases may occur, but a reversal is already overdue. We believe the price may reach levels as high as $6400 and €5650 before it begins a reversal.
Despite short-term losses, however, we believe we believe Bitcoin is likely to make long-term gains.
To learn more, read out 2019, 2020, and 5-year price predictions by clicking on the blue button below:
Do you think BTC will keep trading inside the channel? Let us know your thoughts in the comments below!
Disclaimer: This article is not trading advice and should not be construed as such. Always consult a trained financial professional before investing in cryptocurrencies, as the market is particularly volatile.


