


![Bitcoin Analysis for 2019-12-11 [Premium]](/_mfes/post/_next/image/?url=https%3A%2F%2Fassets.beincrypto.com%2Fimg%2FDqPjUpIRSwWAHXzKLIUoPTAgdLs%3D%2Fsmart%2F8dafef478f5540ab89f4a7e1ddfd4d2a&w=1920&q=75)
The Bitcoin price has decreased to the middle of the $6900-$7600 trading range. The price is at a very important level. A breakdown below $7100 would cause it to fall below significant long-term support. On the other hand, reclaiming the $7800 resistance area could indicate that the bottom is in.
Bitcoin Price Highlights
- The Bitcoin price is trading in a range between $6900 and $7600.
- It is trading in line with the 10- and 20-day moving averages (MA).
- There is strong resistance at $7800.
- The price is barely holding on to the 50- and 100-week MA support.
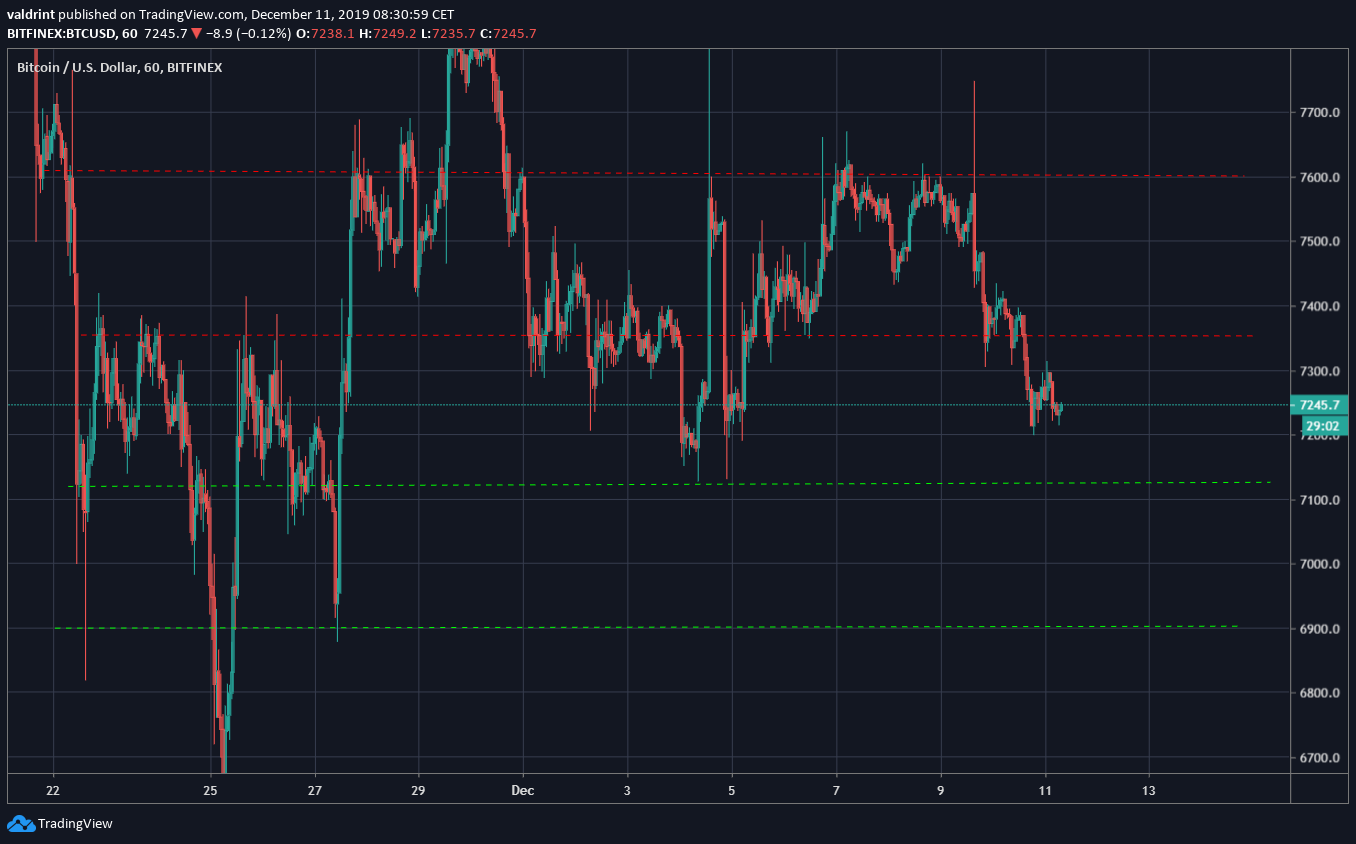
Bitcoin’s Trading Range
Since November 22, the Bitcoin price has been trading in a range between $6900 and $7600, with the exception of two outlier moves. It is currently between a minor range inside it at $7100-$7350.
A return to $7100 would mark a full retracement relative to the move beginning on December 5. A breakdown below it would but $6900 in play.
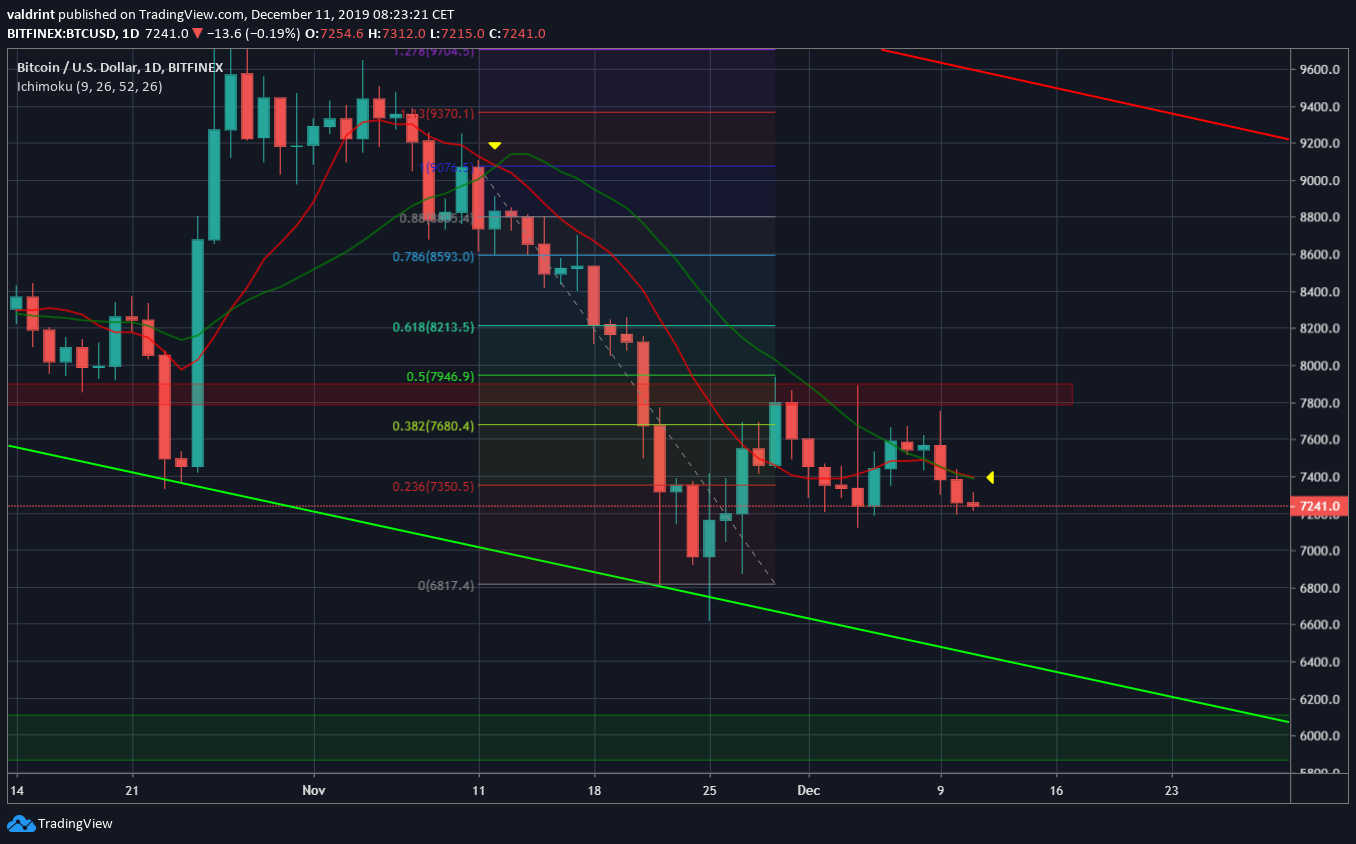
Daily Outlook
The daily outlook remains bearish. The Bitcoin price was twice rejected by the $7800 resistance area, creating a long upper wick the second time.
The support line of the channel, which initiated the current bounce on November 25 is at $6400. From January 2020, it will coincide with the minor support area at $6000.
The Bitcoin price is trading well below the long-term daily moving averages (MA). However, it is very close to the 10- and 20-day MAs. They are on top of each other, meaning a strong price movement in either direction would cause a bullish/bearish cross. The bearish cross between these two MAs preceded the downward move on November 11.
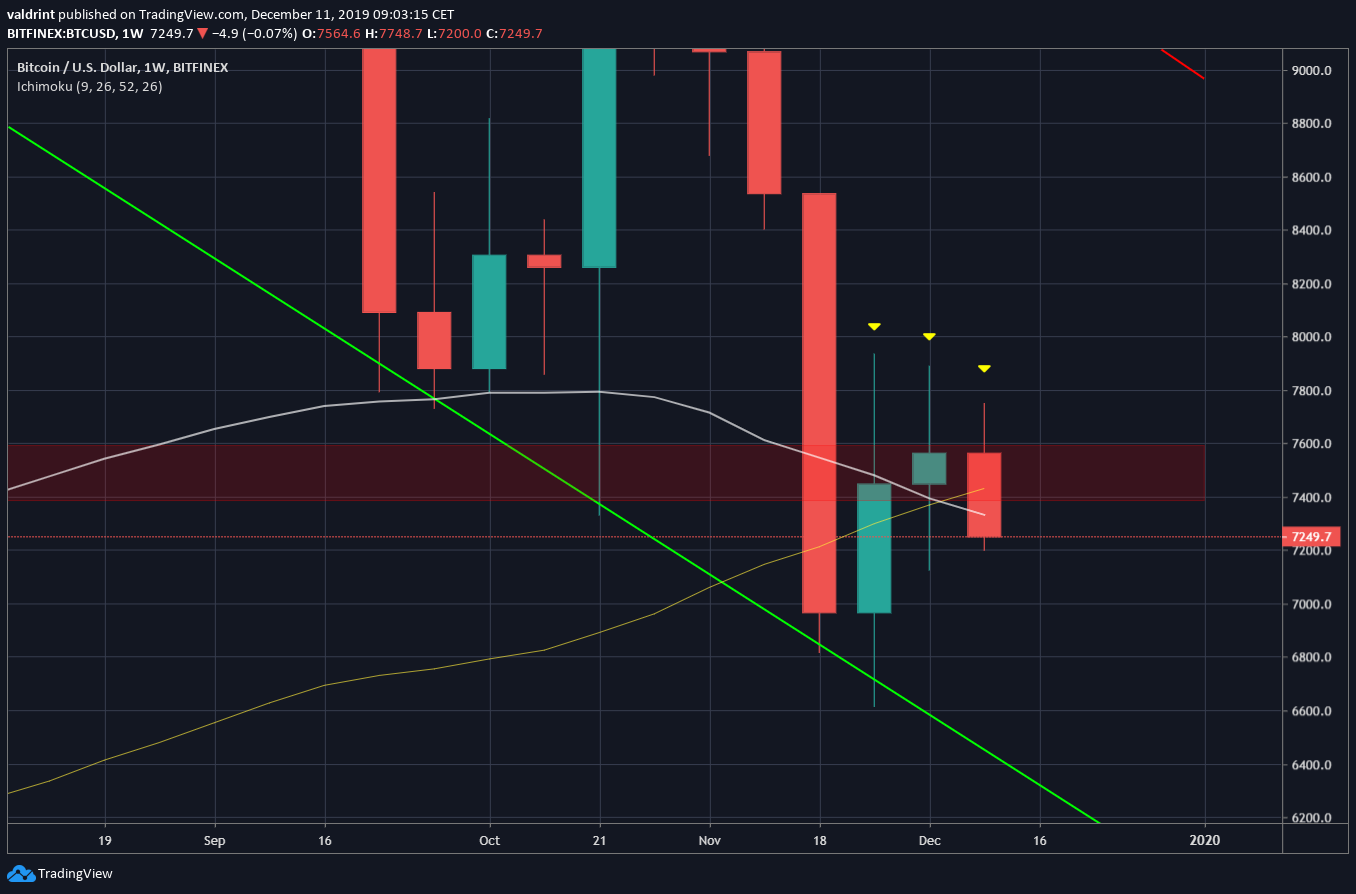
Significant Support
The weekly outlook reveals that the Bitcoin price is at a very important level. It is barely holding on to the support offered by the 50- and 100-week MAs, which have made a bullish cross.
The candlesticks for the final three weeks have been easily contained within the body of the massive bearish engulfing candlestick for the week of November 18-25. All three have had long upper wicks, a bearish development.
In order for the Bitcoin price movement to be considered bullish, BTC must close above the resistance area and possibly the high of the wicks. If it fails to do so, we would likely see a price movement below $7000.
For our previous analysis, click here.


