


![Bitcoin Analysis for 2019-12-10 [Premium]](/_mfes/post/_next/image/?url=https%3A%2F%2Fassets.beincrypto.com%2Fimg%2F0ZpLdReKINk0qV0_d7u25AmpWIA%3D%2Fsmart%2F97f4ef7ae85747eab49828db237c2714&w=1920&q=75)
The Bitcoin price broke down from the short-term ascending triangle. It is still trading inside a longer-term symmetrical triangle. Higher time-frames are giving a bearish outlook, suggesting that the price will continue to decrease throughout the month.
Bitcoin Price Highlights
- The Bitcoin price broke down from an ascending triangle.
- There is resistance at $7600.
- The price is trading inside a symmetrical triangle.
- It is barely holding on to the weekly moving average support.
Bitcoin Price Breakdown
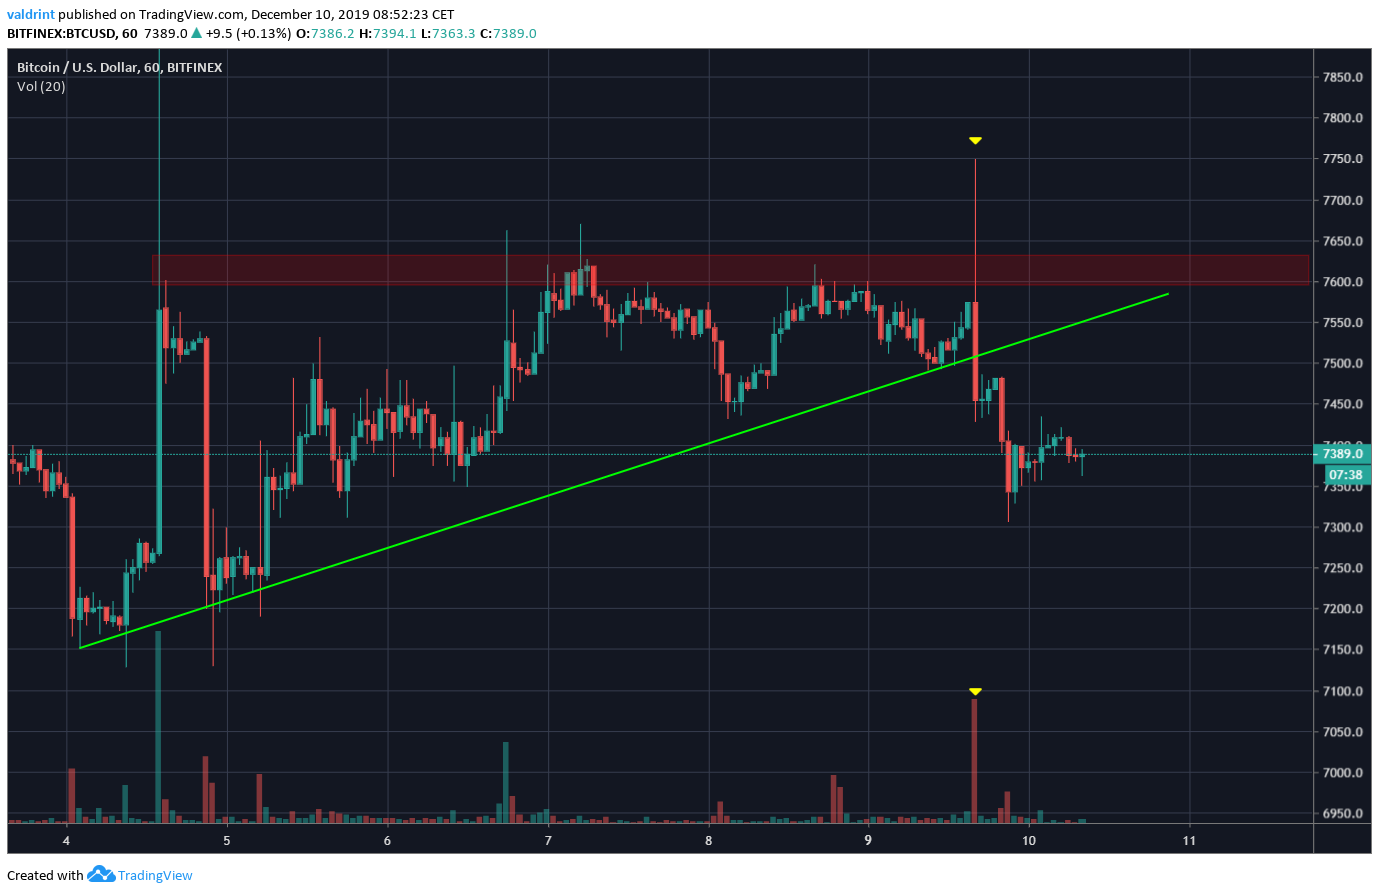
The Bitcoin price had been trading inside an ascending triangle since December 4. The resistance area was found at $7600.
Last night, the Bitcoin price made an attempt at breaking out and reached a high of $7750. However, a very rapid price decrease followed that caused the price to break down below the ascending support line. The decrease transpired with significant volume, giving validity to the breakout.
Additionally, the Bitcoin price has not yet returned to validate the previous support line. If the price does not do so, it will further attest to the strength of the breakdown.
Symmetrical Triangle
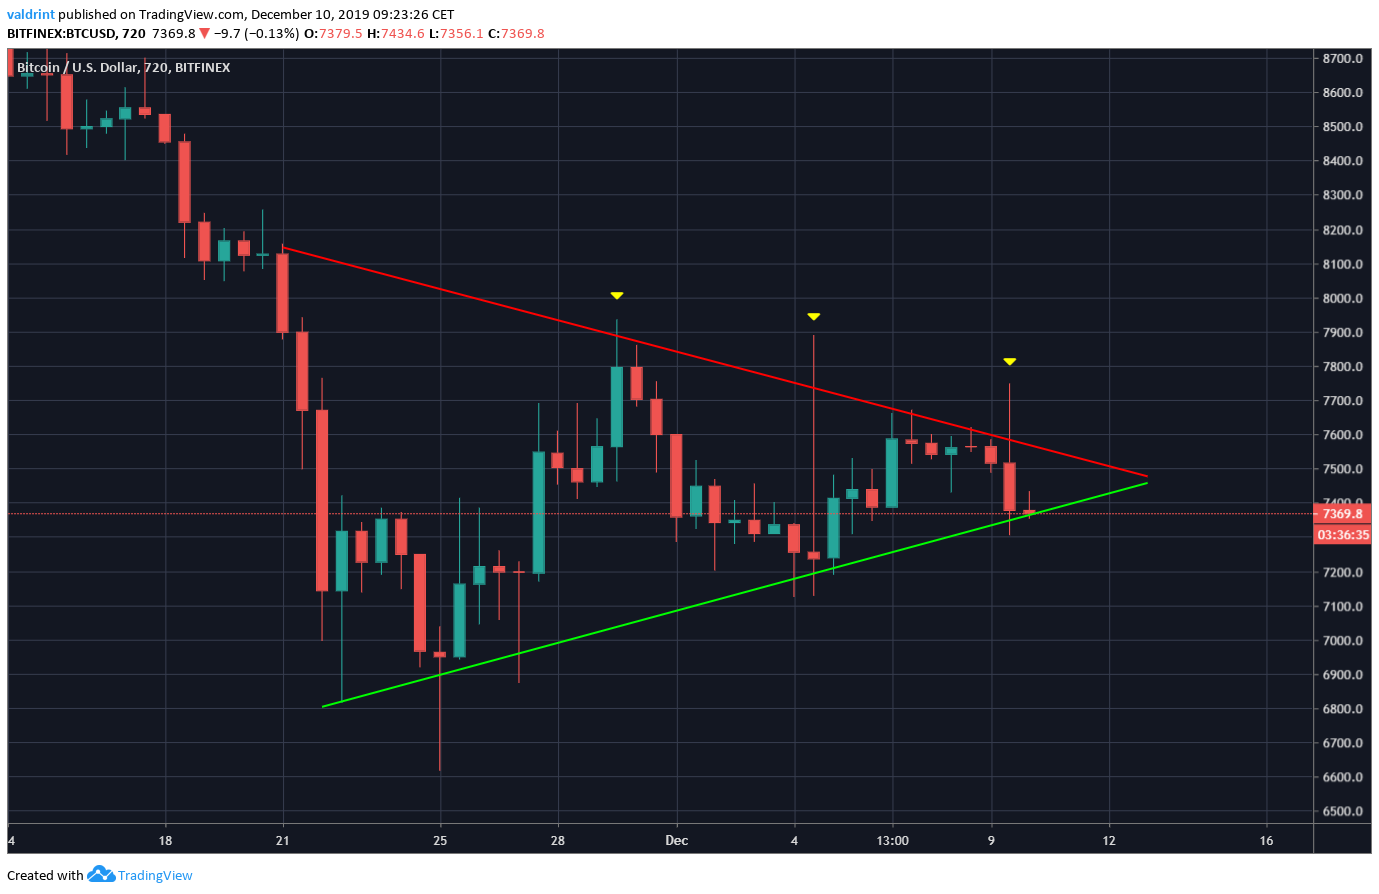
However, the daily time-frame reveals the longer-term triangle that is still intact. Beginning from the November 22 low, the Bitcoin price is following what looks like a symmetrical triangle and is currently right at its support line.
The symmetrical triangle is a continuation pattern, and since it is transpiring after a price decrease, a breakdown would be likely. The presence of three long upper wicks solidifies this belief.
Weekly Outlook
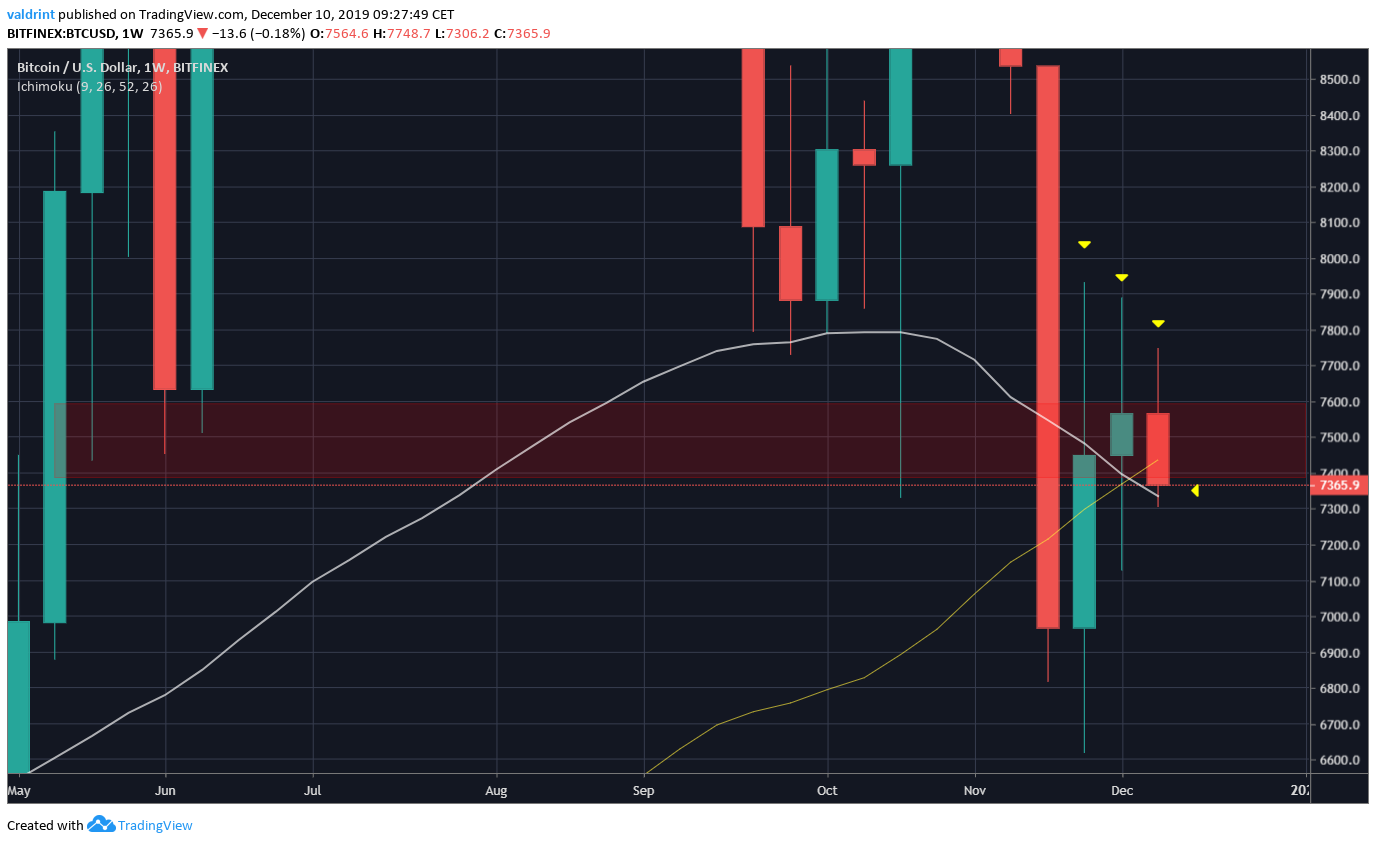
While it is very early in the week, the weekly chart has started to look really bad. After failing to close above the resistance area, the Bitcoin price has created several long upper wicks, and is now in the process of closing below the resistance area.
If the Bitcoin price does so, combined with a movement below the moving averages (MA), it would indicate that it is heading for new lows.
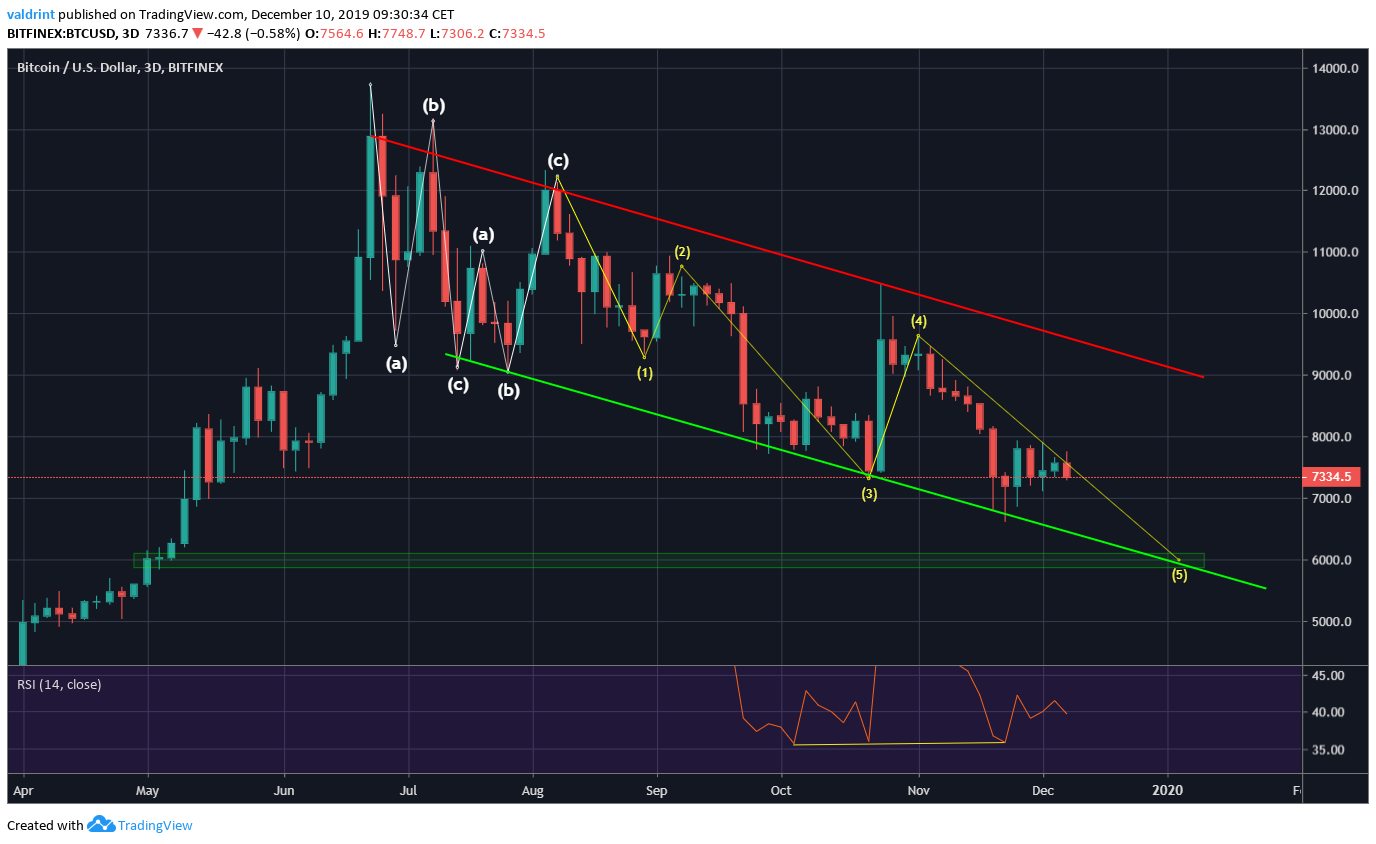
For a target, we can use the support line of the descending channel the price has been trading in. We are likely in the fifth and final wave of the correction. A likely endpoint would be $6000, coinciding with the descending support line and minor support area.
However, we cannot completely neglect the developing bullish divergence in the RSI, which makes it possible that the fifth wave ended at $6600. As it stands, the first option that takes us to $6000 is more likely.
To conclude, the BTC price broke down from a short-term pattern. While it is holding on to support, higher time-frames suggest that the price will continue to decrease throughout the month.
For our previous analysis, click here.


