


![Bitcoin Analysis for 2019-10-21 [Premium]](/_mfes/post/_next/image/?url=https%3A%2F%2Fassets.beincrypto.com%2Fimg%2FEhm6q0rxp2vLcLIn8HT3SwqJQtc%3D%2Fsmart%2F9a3154410cae4012b243c1b4d8793c87&w=1920&q=75)
Bitcoin looks to have begun a short-term upward move, which we believe will not go higher than the resistance line of the descending wedge. In a long-term view, we believe we are approaching the bottom.
Highlights
- The 10- and 20-week moving averages (MA) have made a bearish cross.
- BTC has found support above its 100-week MA.
- The price is trading inside a descending wedge.
- BTC has made a triple bottom
- There is bullish divergence developing along with the triple bottom.
Bitcoin Price: Weekly Analysis
The Bitcoin Price is retracing since reaching a high of $37,769 on June 26. It has found temporary support at the 0.5 Fib line of the entire upward move.
After the rapid decrease of September 24, the price has shown indecision. The Oct 7-Oct 14 weekly candle was bearish since buyers attempted to push the price higher but failed, creating a long upper wick. It has shown indecision since.
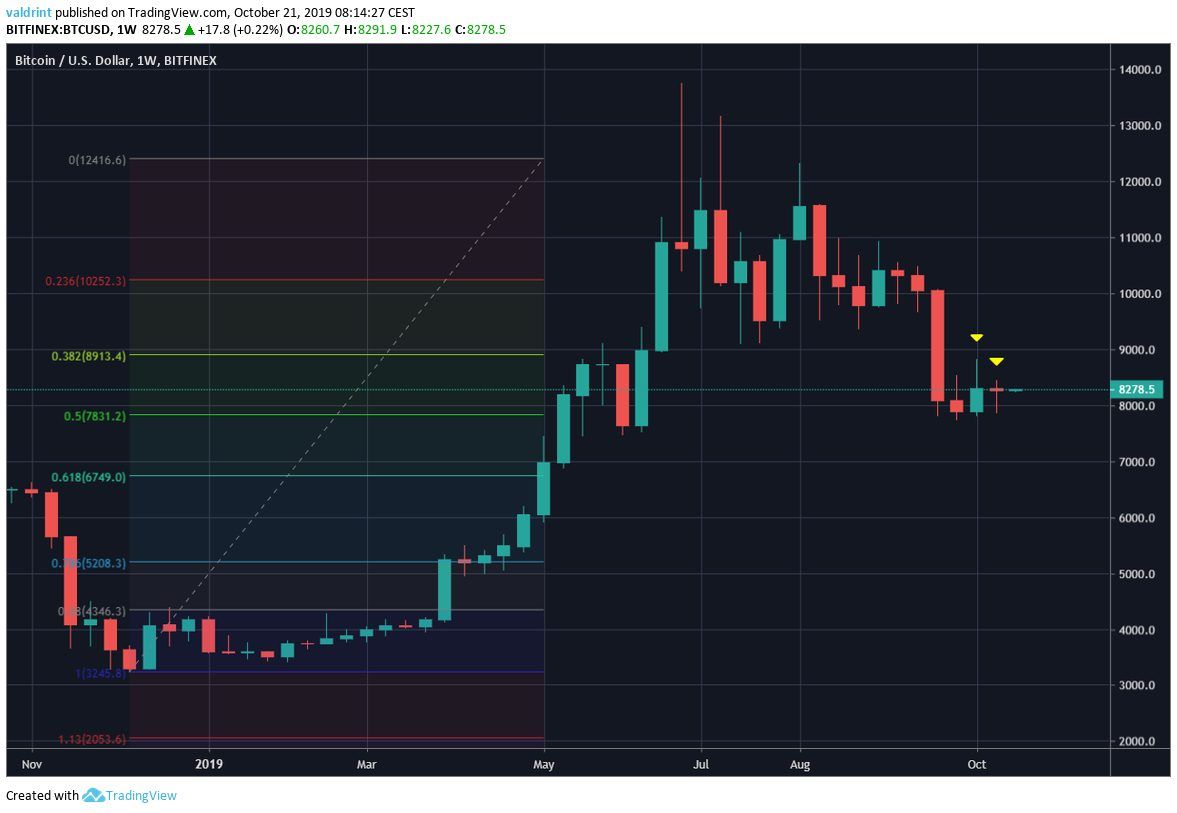
Moving averages (MA) show that a short-term (10- & 20-week) bearish cross has already occurred.
Also, the price has found support above the 100-week MA (white).
We could see a movement similar to that of December — when the price found support above the 200-week MA (blue). It is worth noting that the price has never traded below its 200-week MA.

Daily Outlook
Looking at the daily chart, we can see that BTC has been trading inside a descending wedge since reaching the aforementioned high on June 26.
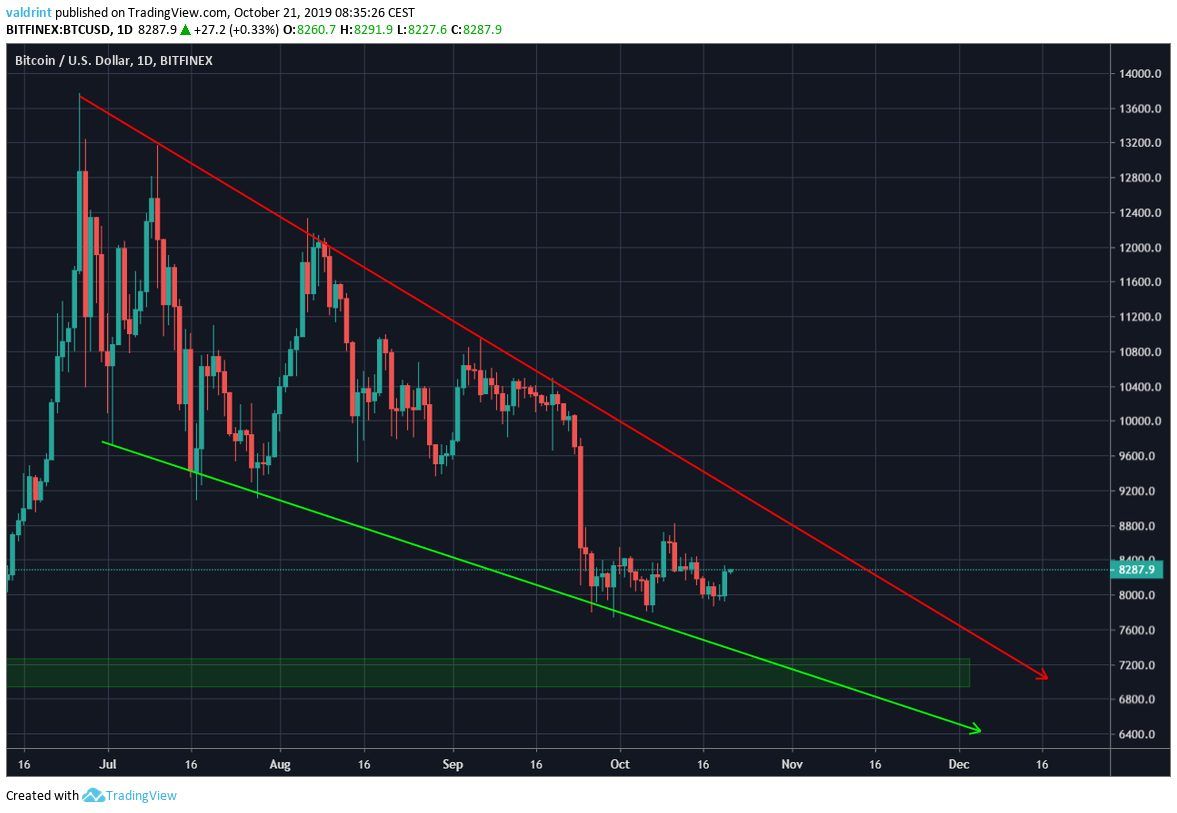
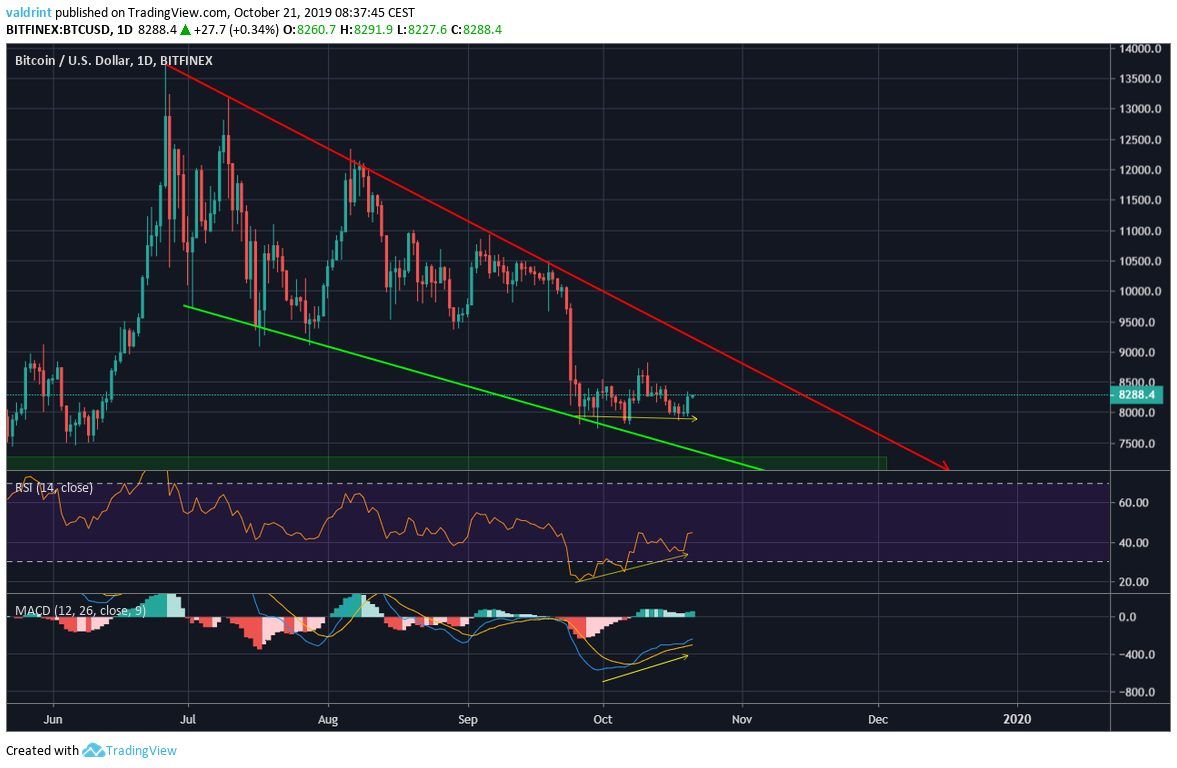
Looking closer, BTC has made a triple bottom at $7800 beginning on September 27.
This has been accompanied by bullish divergence in both the RSI & MACD.
It is possible that the price will move upward from here until it reaches the resistance line of the wedge.
To conclude, we are bullish in the short-term, bearish in the medium-term, and extremely bullish in the long-term. The above analysis is the reason for the bullishness in the short-term.
The chart below represents the price of BTC in a logarithmic chart since 2011.
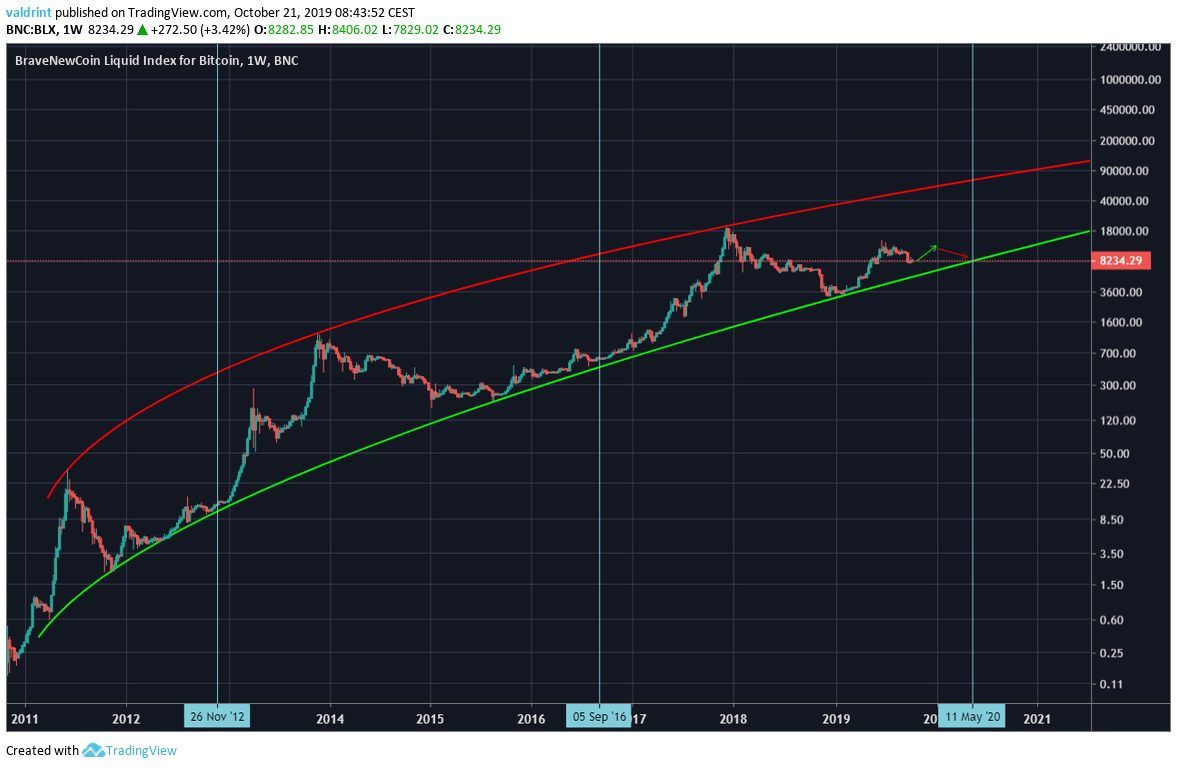
The vertical lines represent the two halving dates until now, while the third one the projected date for the third halving.
Similar to the previous two times, we are expecting the price to consolidate until halving and be at the support line at the date of the event. This is the reason for being bearish in the medium-term.
On the other hand, since we are close to the support line, we are expecting the relative bottom to be very close — hence the reason for being extremely bullish in the long-term.
Good luck and happy trading!
Disclaimer: This article is not trading advice and should not be construed as such. Always consult a trained financial professional before investing in cryptocurrencies, as the market is particularly volatile.


