


Following two consecutive daily green candles, Binance Coin’s (BNB) price is now close to a level that could determine its next major move. On September 1, the native token of the BNB Chain was close to falling below $500.
The conditions highlighted in this analysis will determine whether the coin will continue to rally or face further declines.
Binance Coin Nears $550 Supply Zone
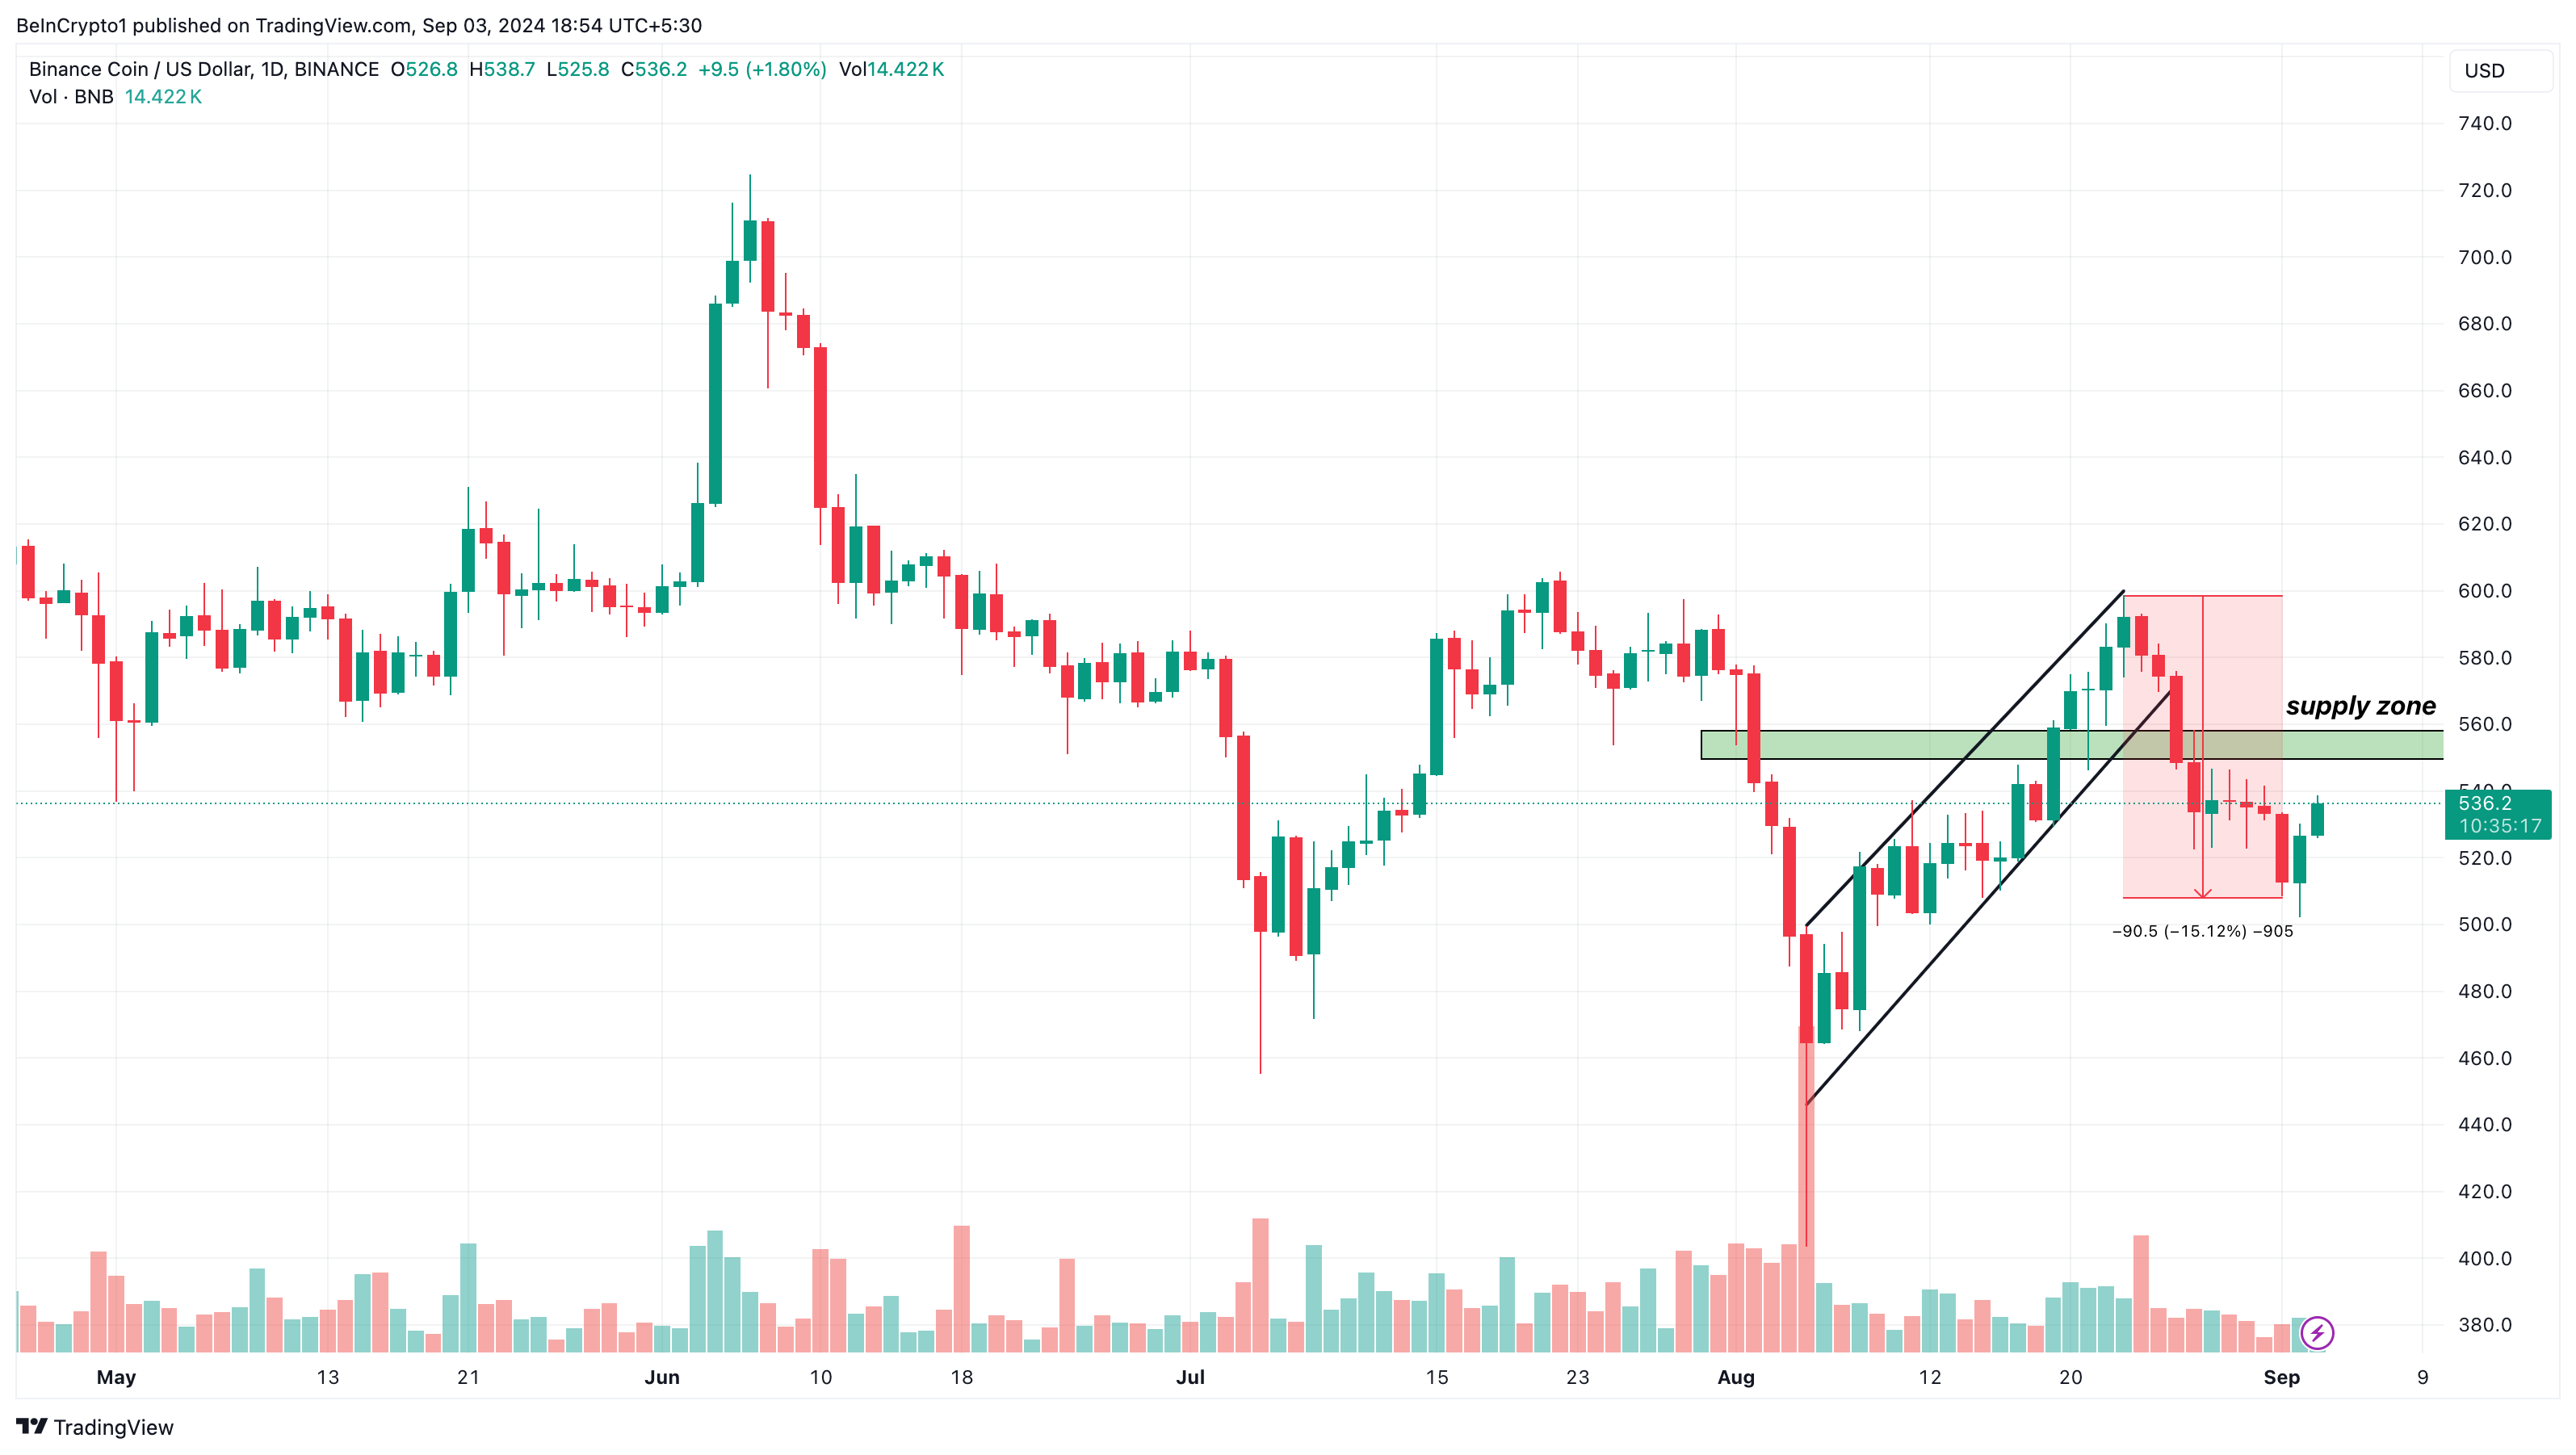
In August, BNB price formed an ascending channel on the daily chart. As a result, the cryptocurrency was able to move from $464 to $600. However, the 15% decrease after that threatened its price action with an indicator suggesting another price crash like what happened on August 5.
Bulls managed to prevent further decline, helping BNB rebound to $536.40. As the price approaches the $550-$560 supply zone, where sellers outnumber buyers, breaking through this region could be challenging.
Most of the time, hitting this zone leads to a price fall as long as demand remains muted. For BNB, breaking past the region remains a herculean task, as the current buying pressure might not be substantial enough to drive the price much higher.
Read more: Best BNB Wallets to Consider in 2024
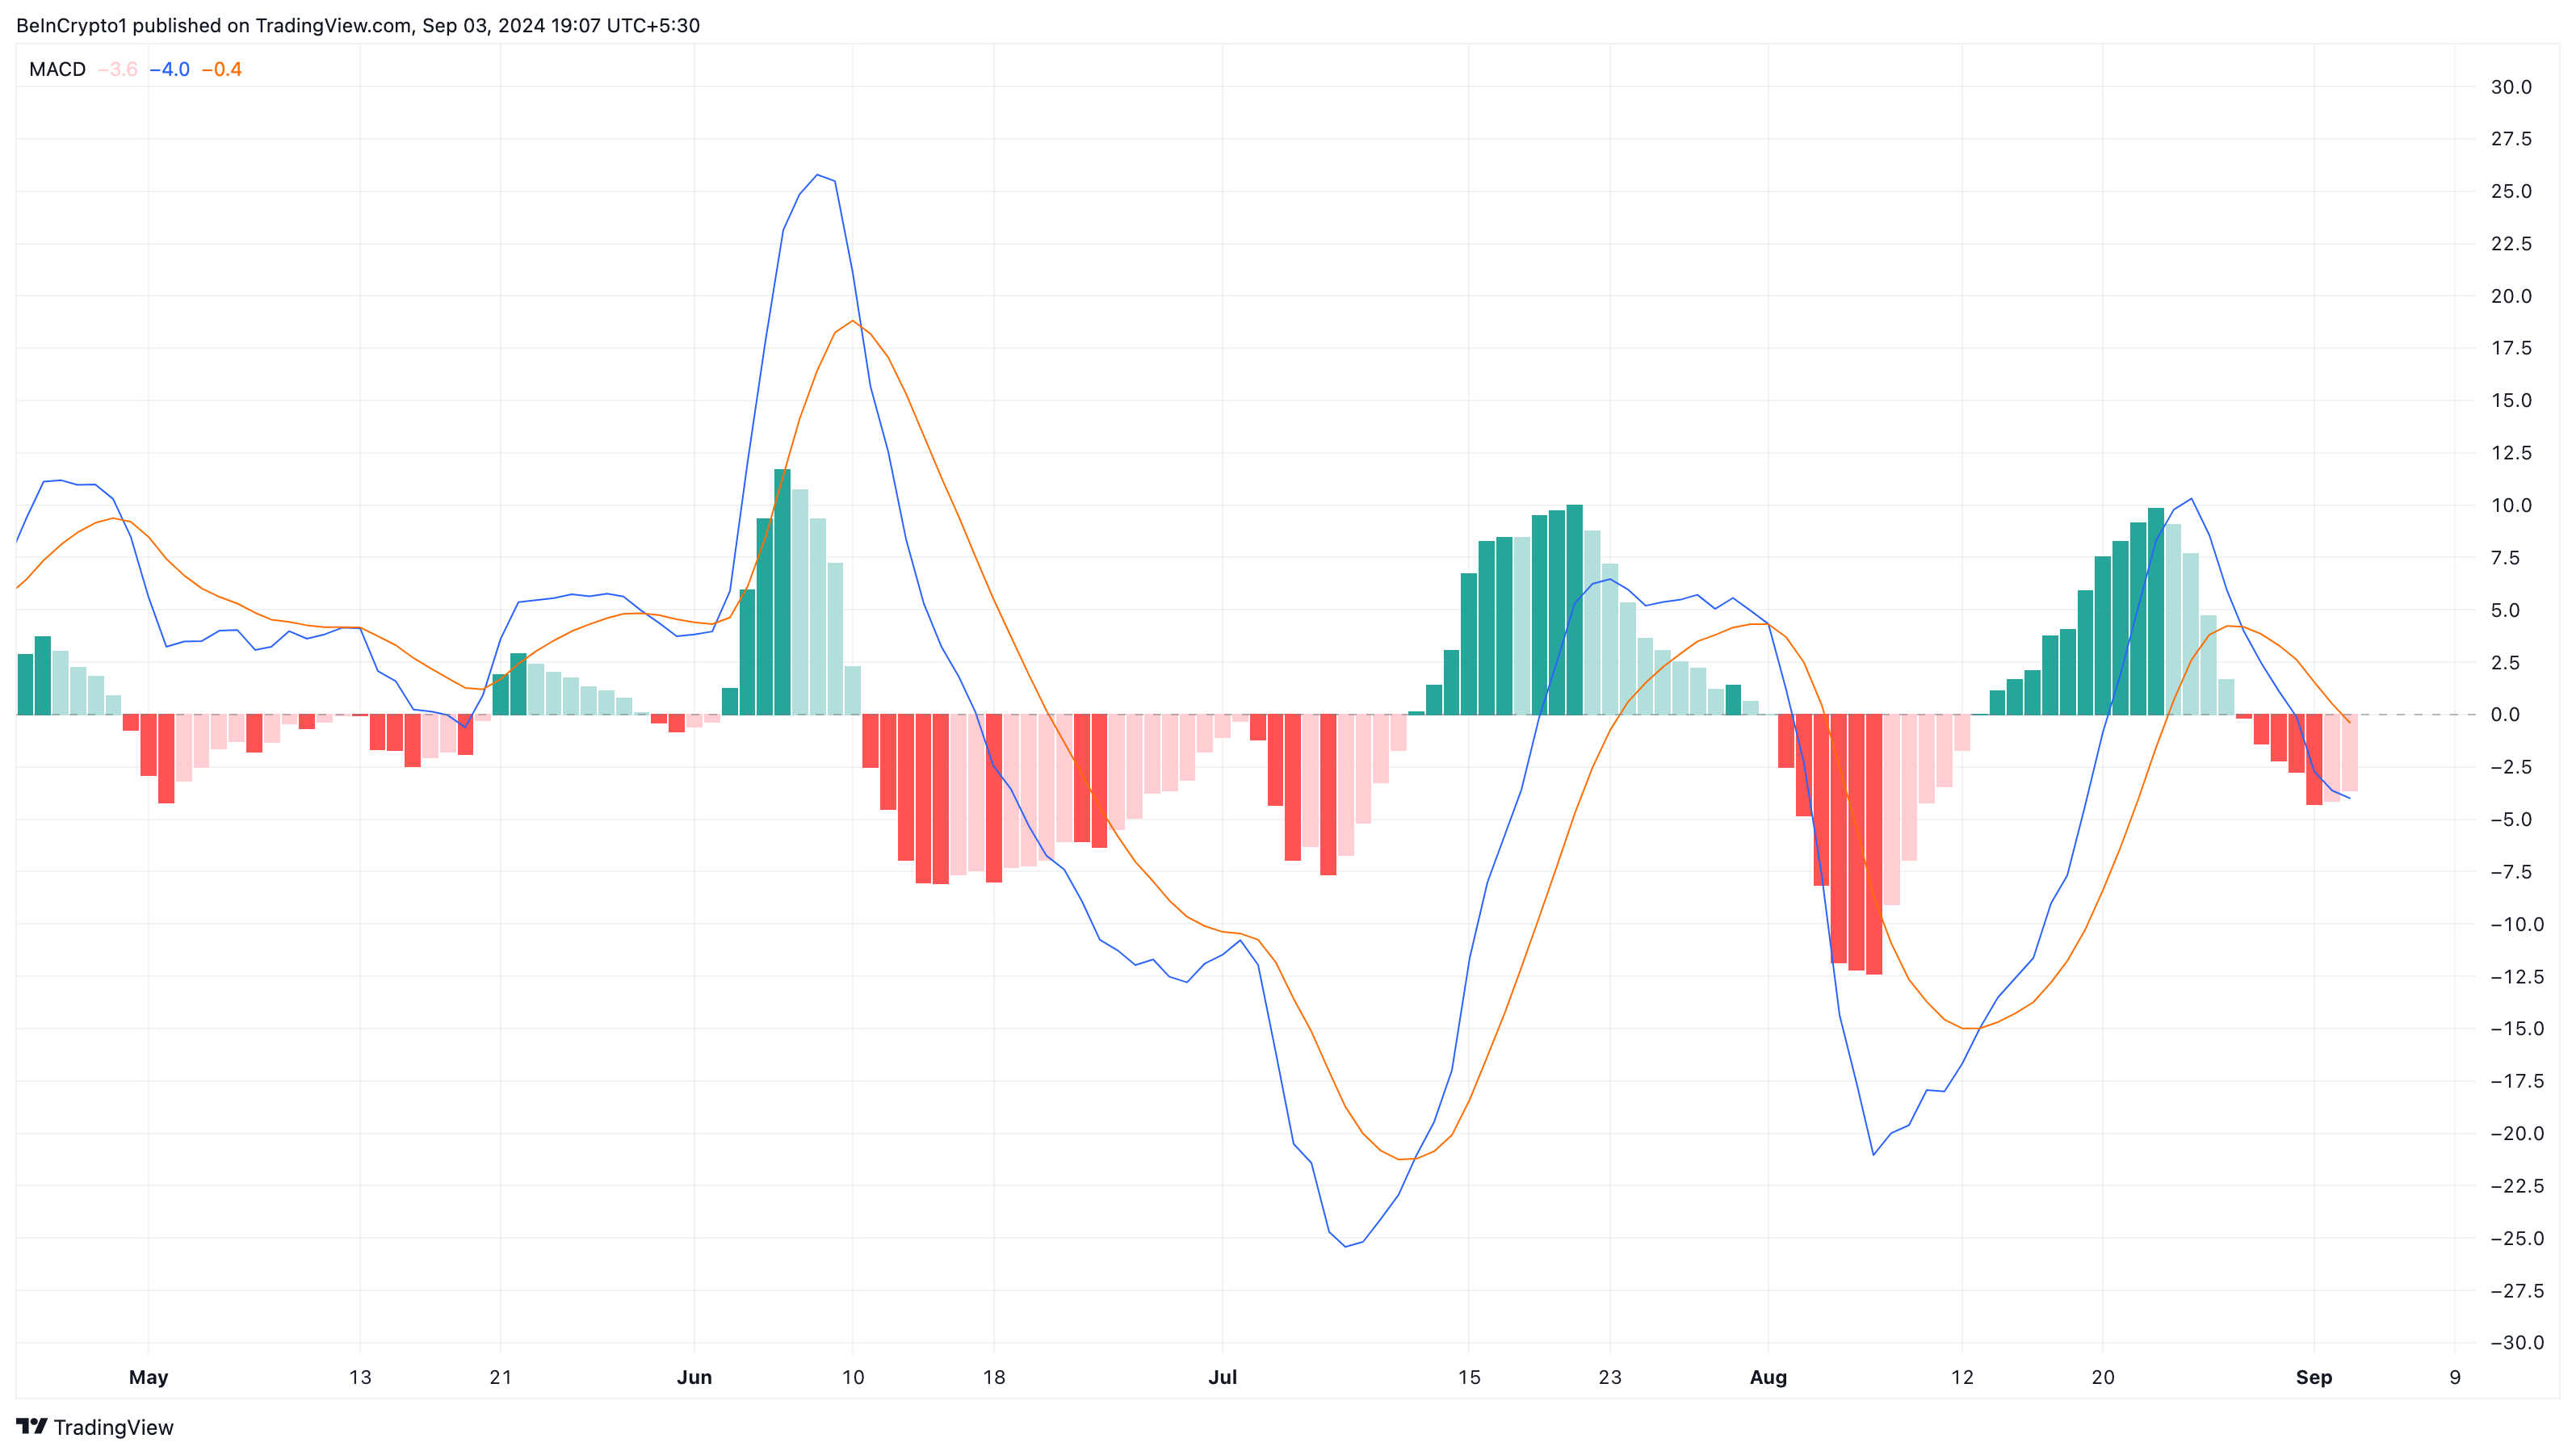
The Moving Average Convergence Divergence (MACD) on the daily chart seems to support the bias. In non-technical terms, the MACD is a technical oscillator that measures a cryptocurrency’s momentum.
When the reading is positive, momentum is bullish, and it could be an early signal. A negative reading, on the other hand, suggests that the momentum is bearish. As shown below, the MACD on the BNB/USD daily chart is negative.
This reading indicates that the BNB’s rising price might not last a long time. Therefore, breaking above $550 might be a challenge that might come with no success.
BNB Price Prediction: Not Yet Time to Hit a New High
From a historical perspective, almost every time BNB fails to break above $560, the price eventually drops below $520 — in some cases, $500.
Therefore, if past performances influence future trends, climbing toward $600 might not become a reality in the short term The chart below also shows that the $546.30 region is a notable point of interest.
As such, bears might also attempt to resist a further upside as the coin approaches the region. If this happens, BNB’s price might decrease to $500 for the first time in almost a month.
Read more: Binance Coin (BNB) Price Prediction 2024/2025/2030
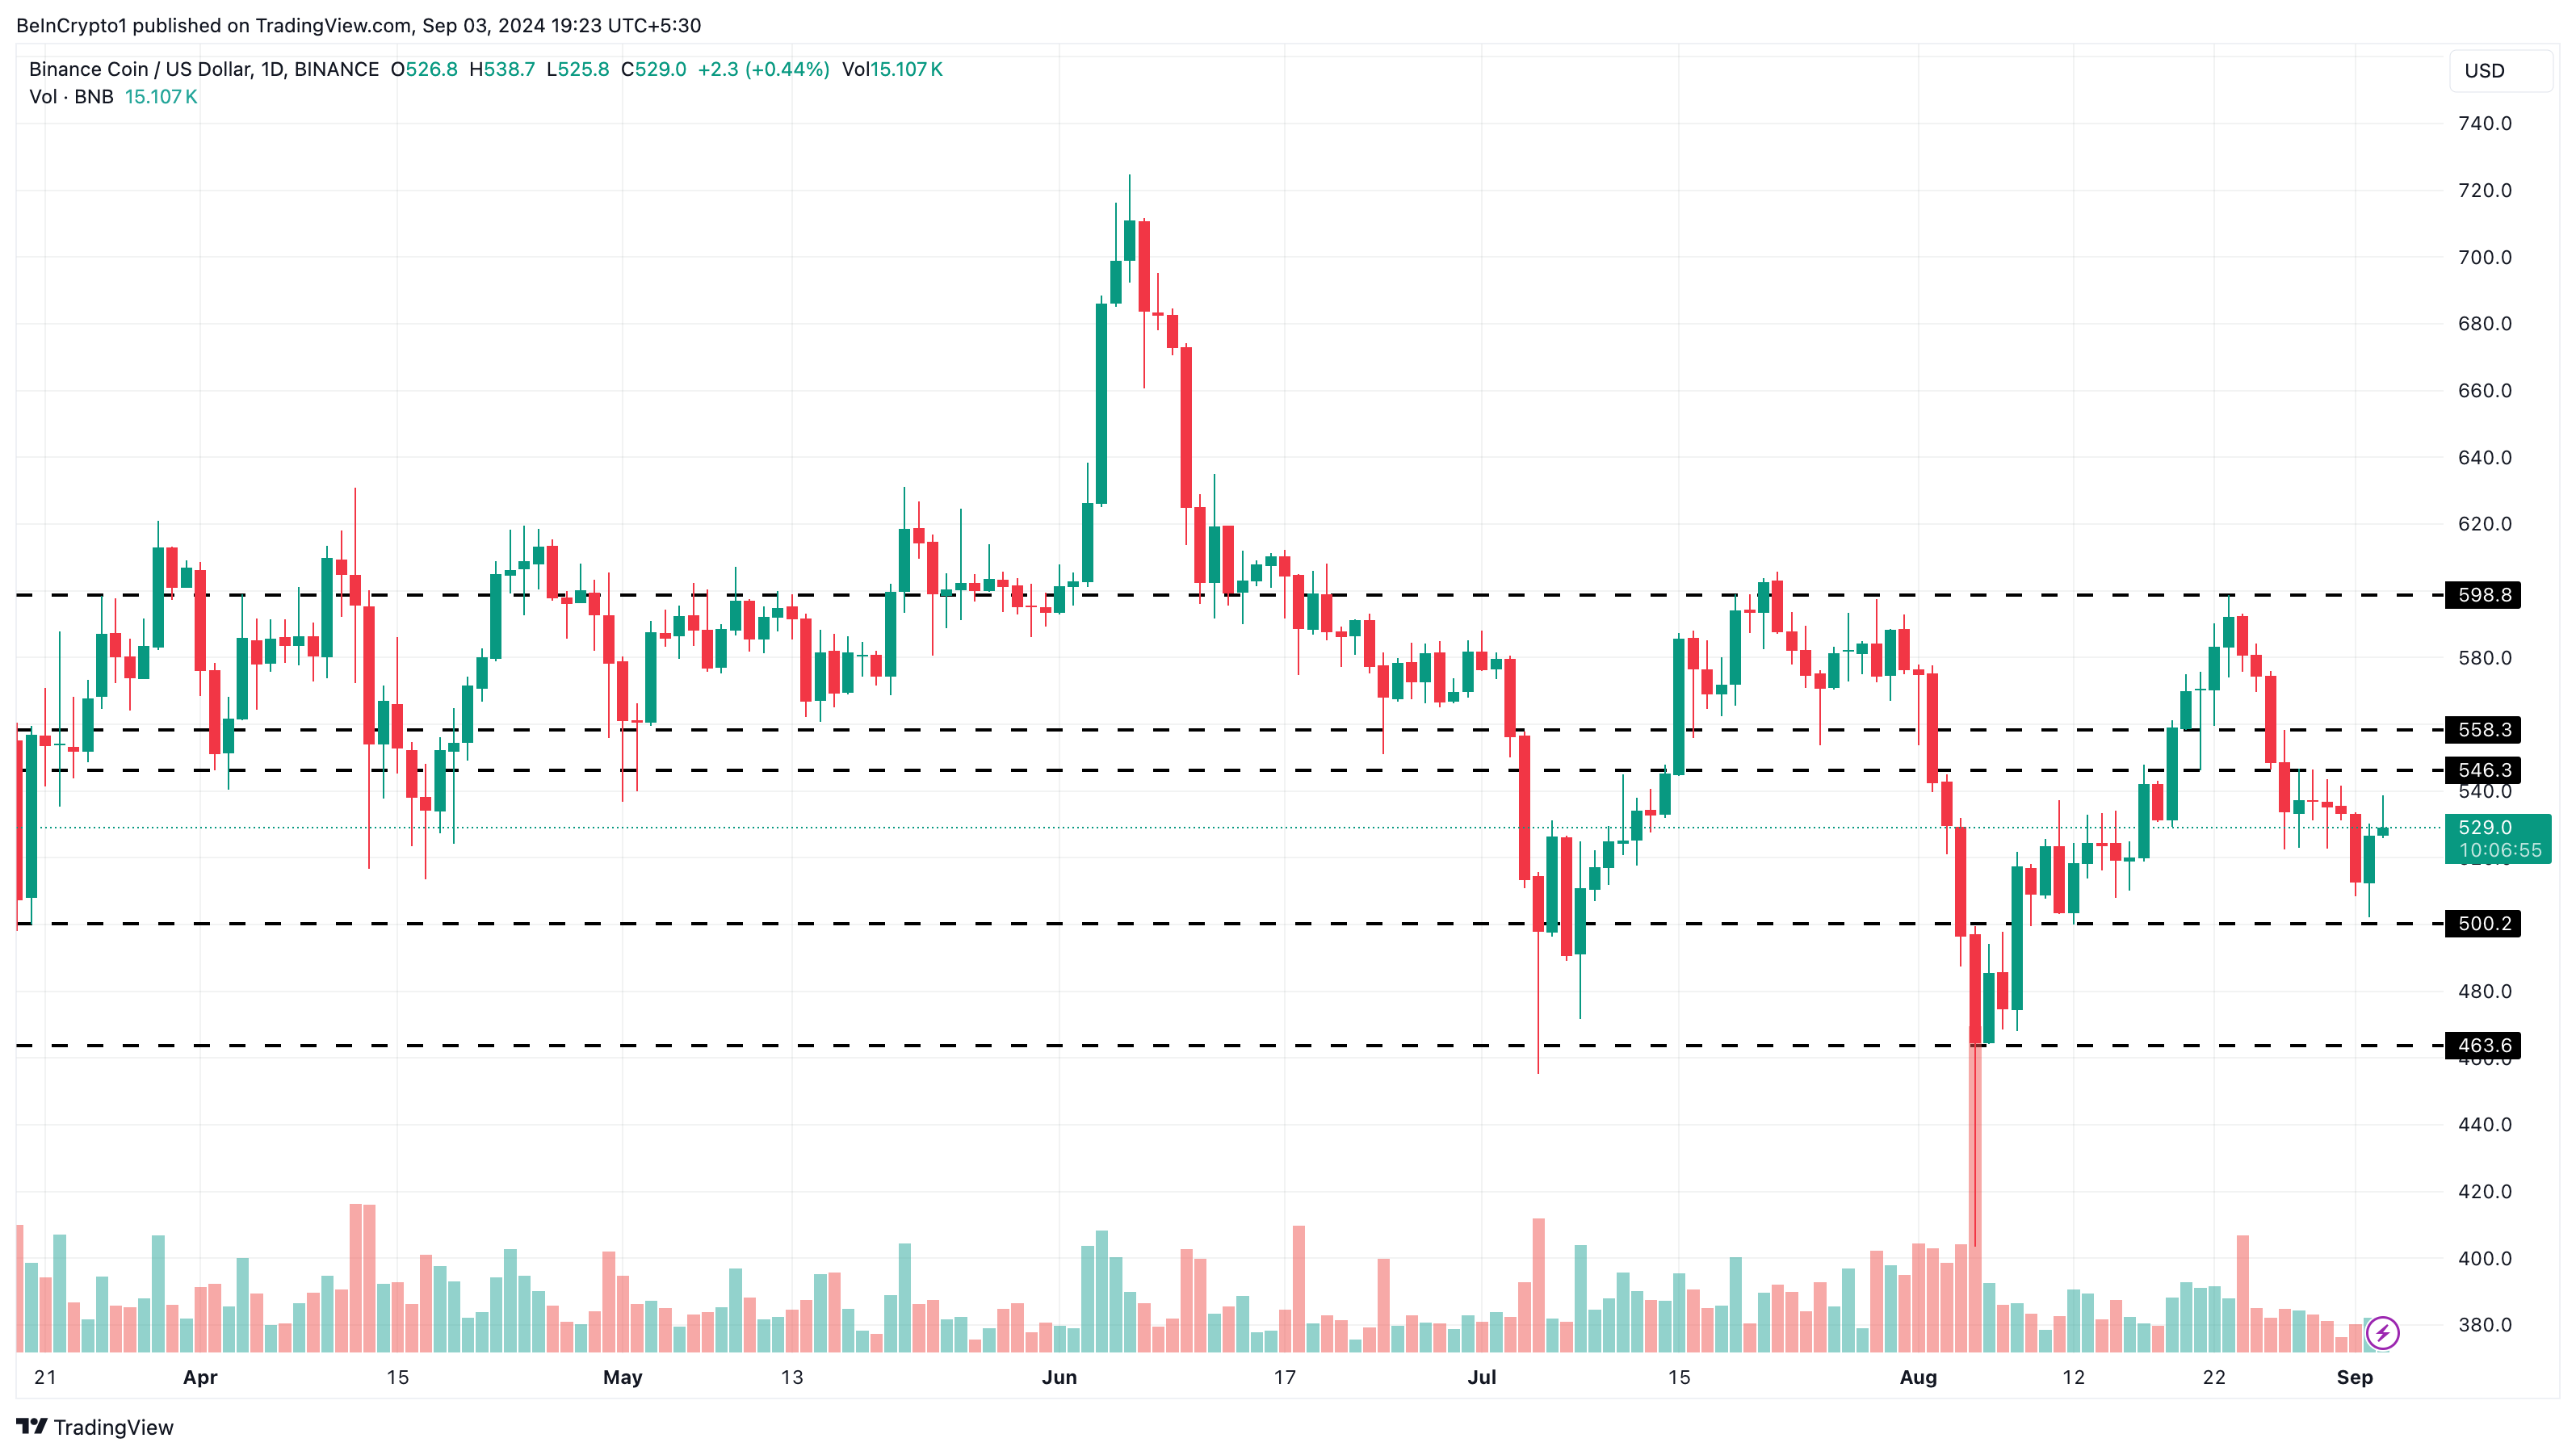
On the upside, the cryptocurrency’s price could surpass the overhead resistance, potentially hitting $589.80 if the broader market condition sustains a recent recovery.



