


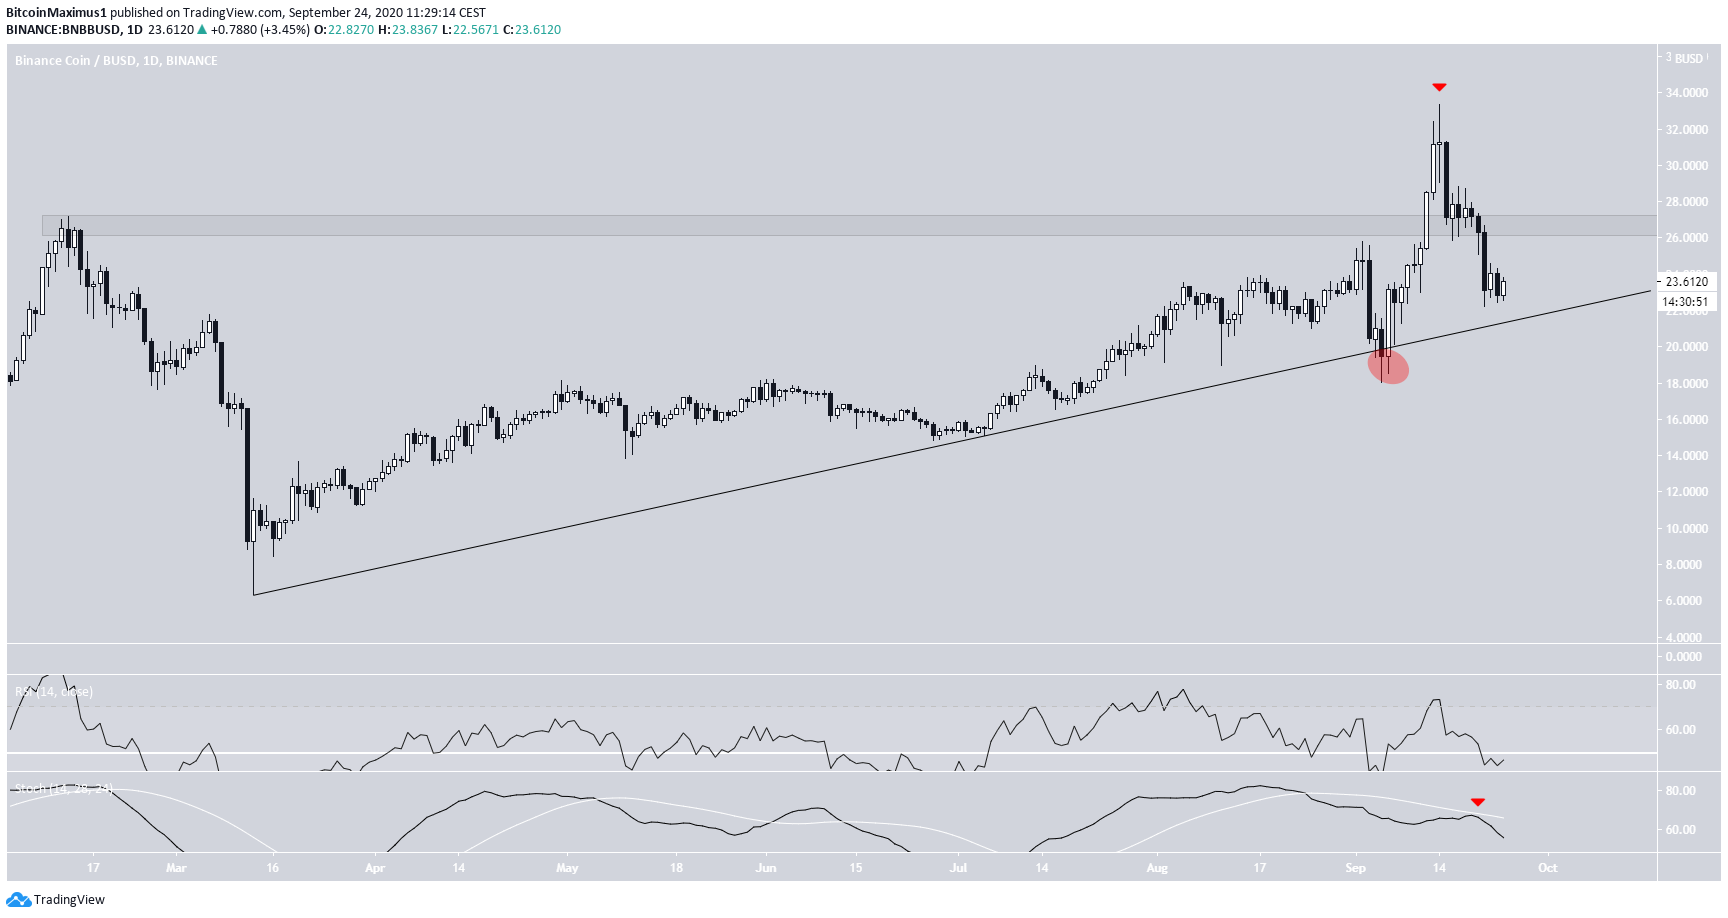
The Binance Coin (BNB) price has been decreasing rapidly since reaching a high on Sept. 14. A breakdown from the current ascending support line would confirm that the price has begun a downward trend.
Breakout That Was Not Sustained
On Sept. 5, the BNB price reached a low of $18.01, decreasing slightly below the ascending support line that has been in place since March 13. However, the price reclaimed the support line shortly afterwards and began an upward movement shortly afterward.
The main resistance area was found at $27, and the price broke out above it on Sept. 12, reaching a high of $33.35, two days later.
However, the higher prices could not be sustained as BNB has been decreasing since.
Technical indicators are bearish. The RSI has fallen below 50 and the Stochastic Oscillator has rejected a bullish cross and began to decrease.
A breakdown from the ascending support line would confirm that the trend is bearish.
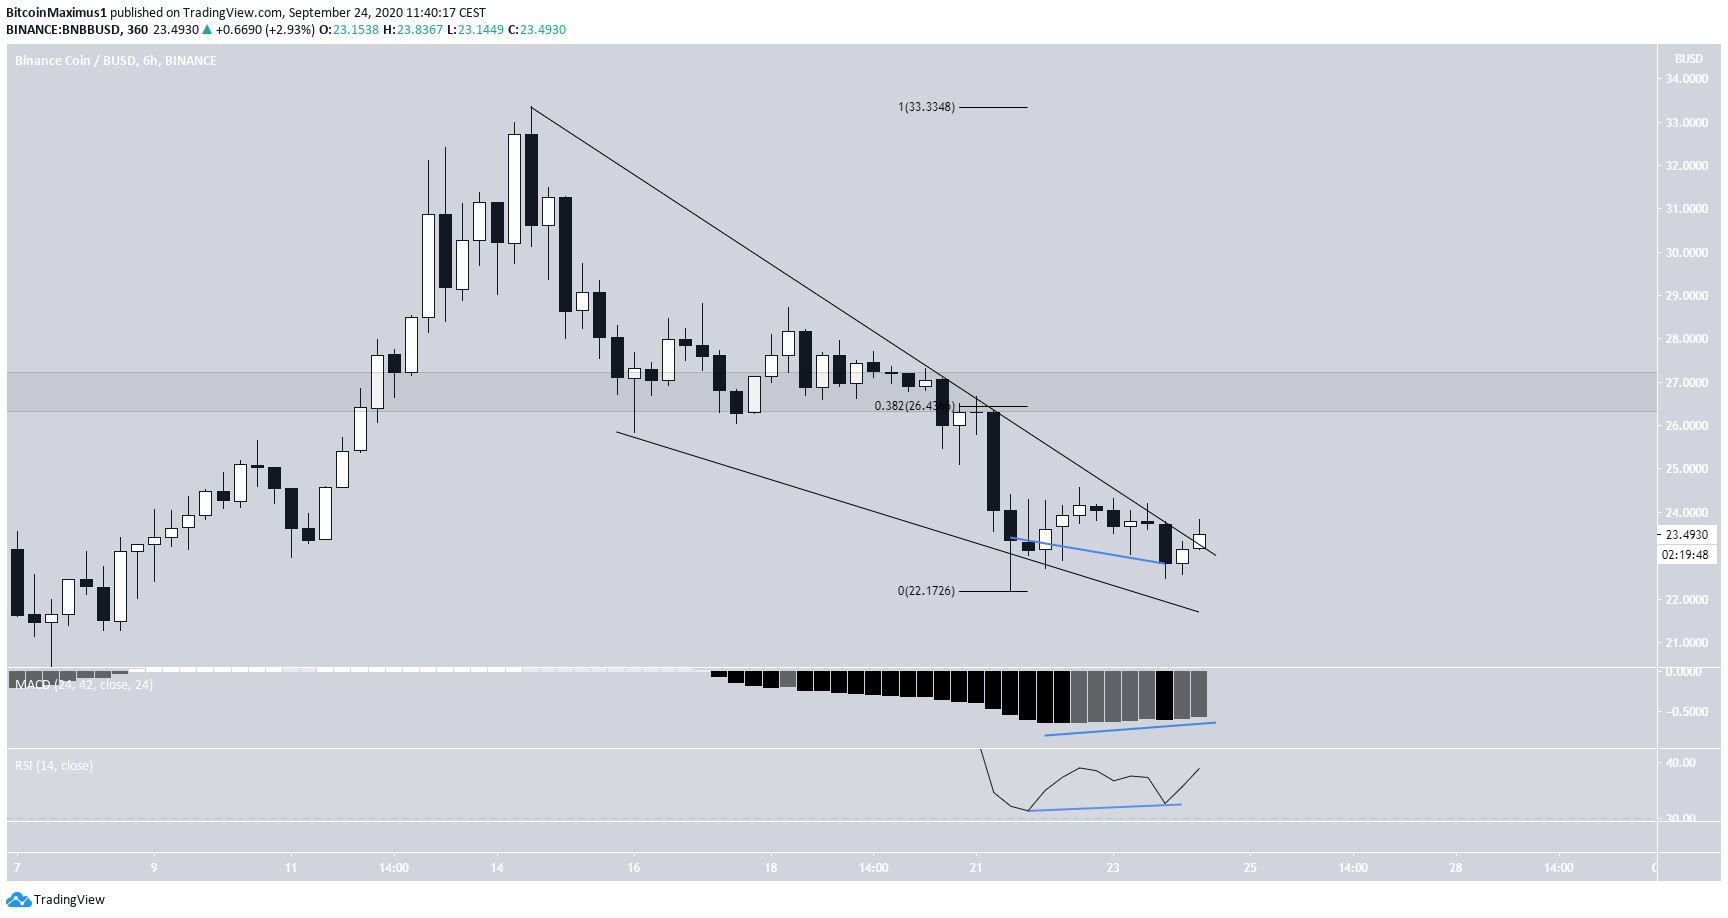
Possible Rally
The shorter-term six-hour chart suggest that a relief rally is possible. The price is in the process of breaking out from a descending wedge, which is considered a bullish reversal pattern.
Furthermore, there is bullish divergence in both the RSI and the MACD. If the price breaks out, the $27 area is likely to act as resistance once more, since it is also the 0.382 Fib level of the entire decrease.
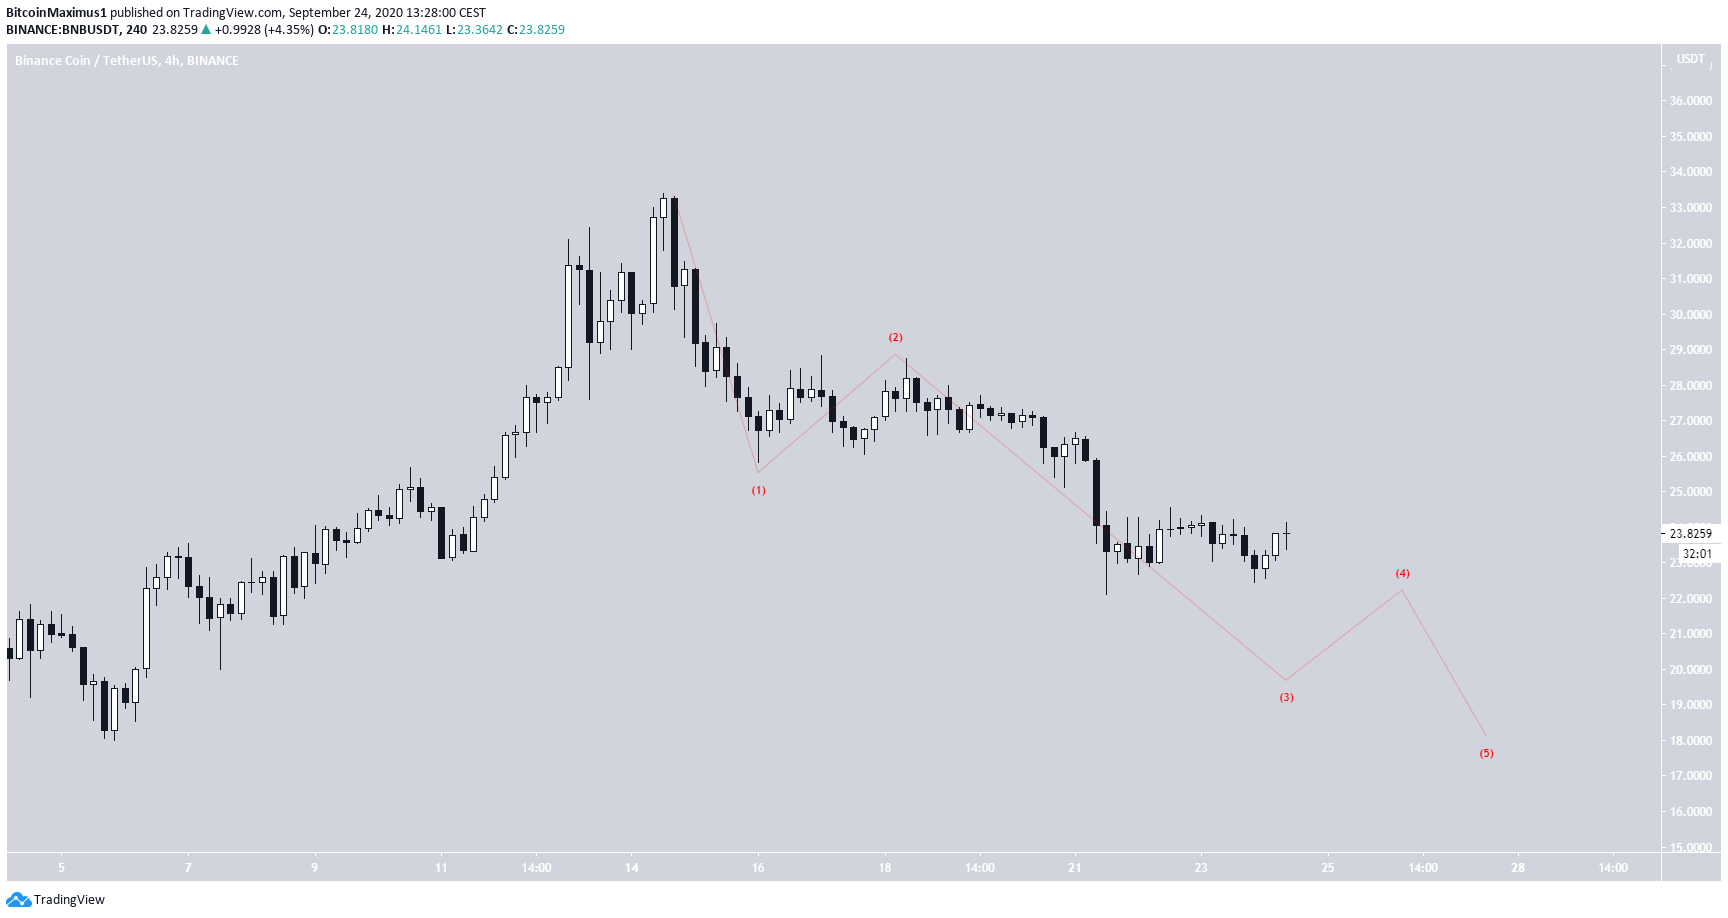
Wave Count
Cryptocurrency trader @Anbessa100 outlined a BNB chart which shows the price resting at an ascending support line and retesting a descending resistance line it has previously broken out from.
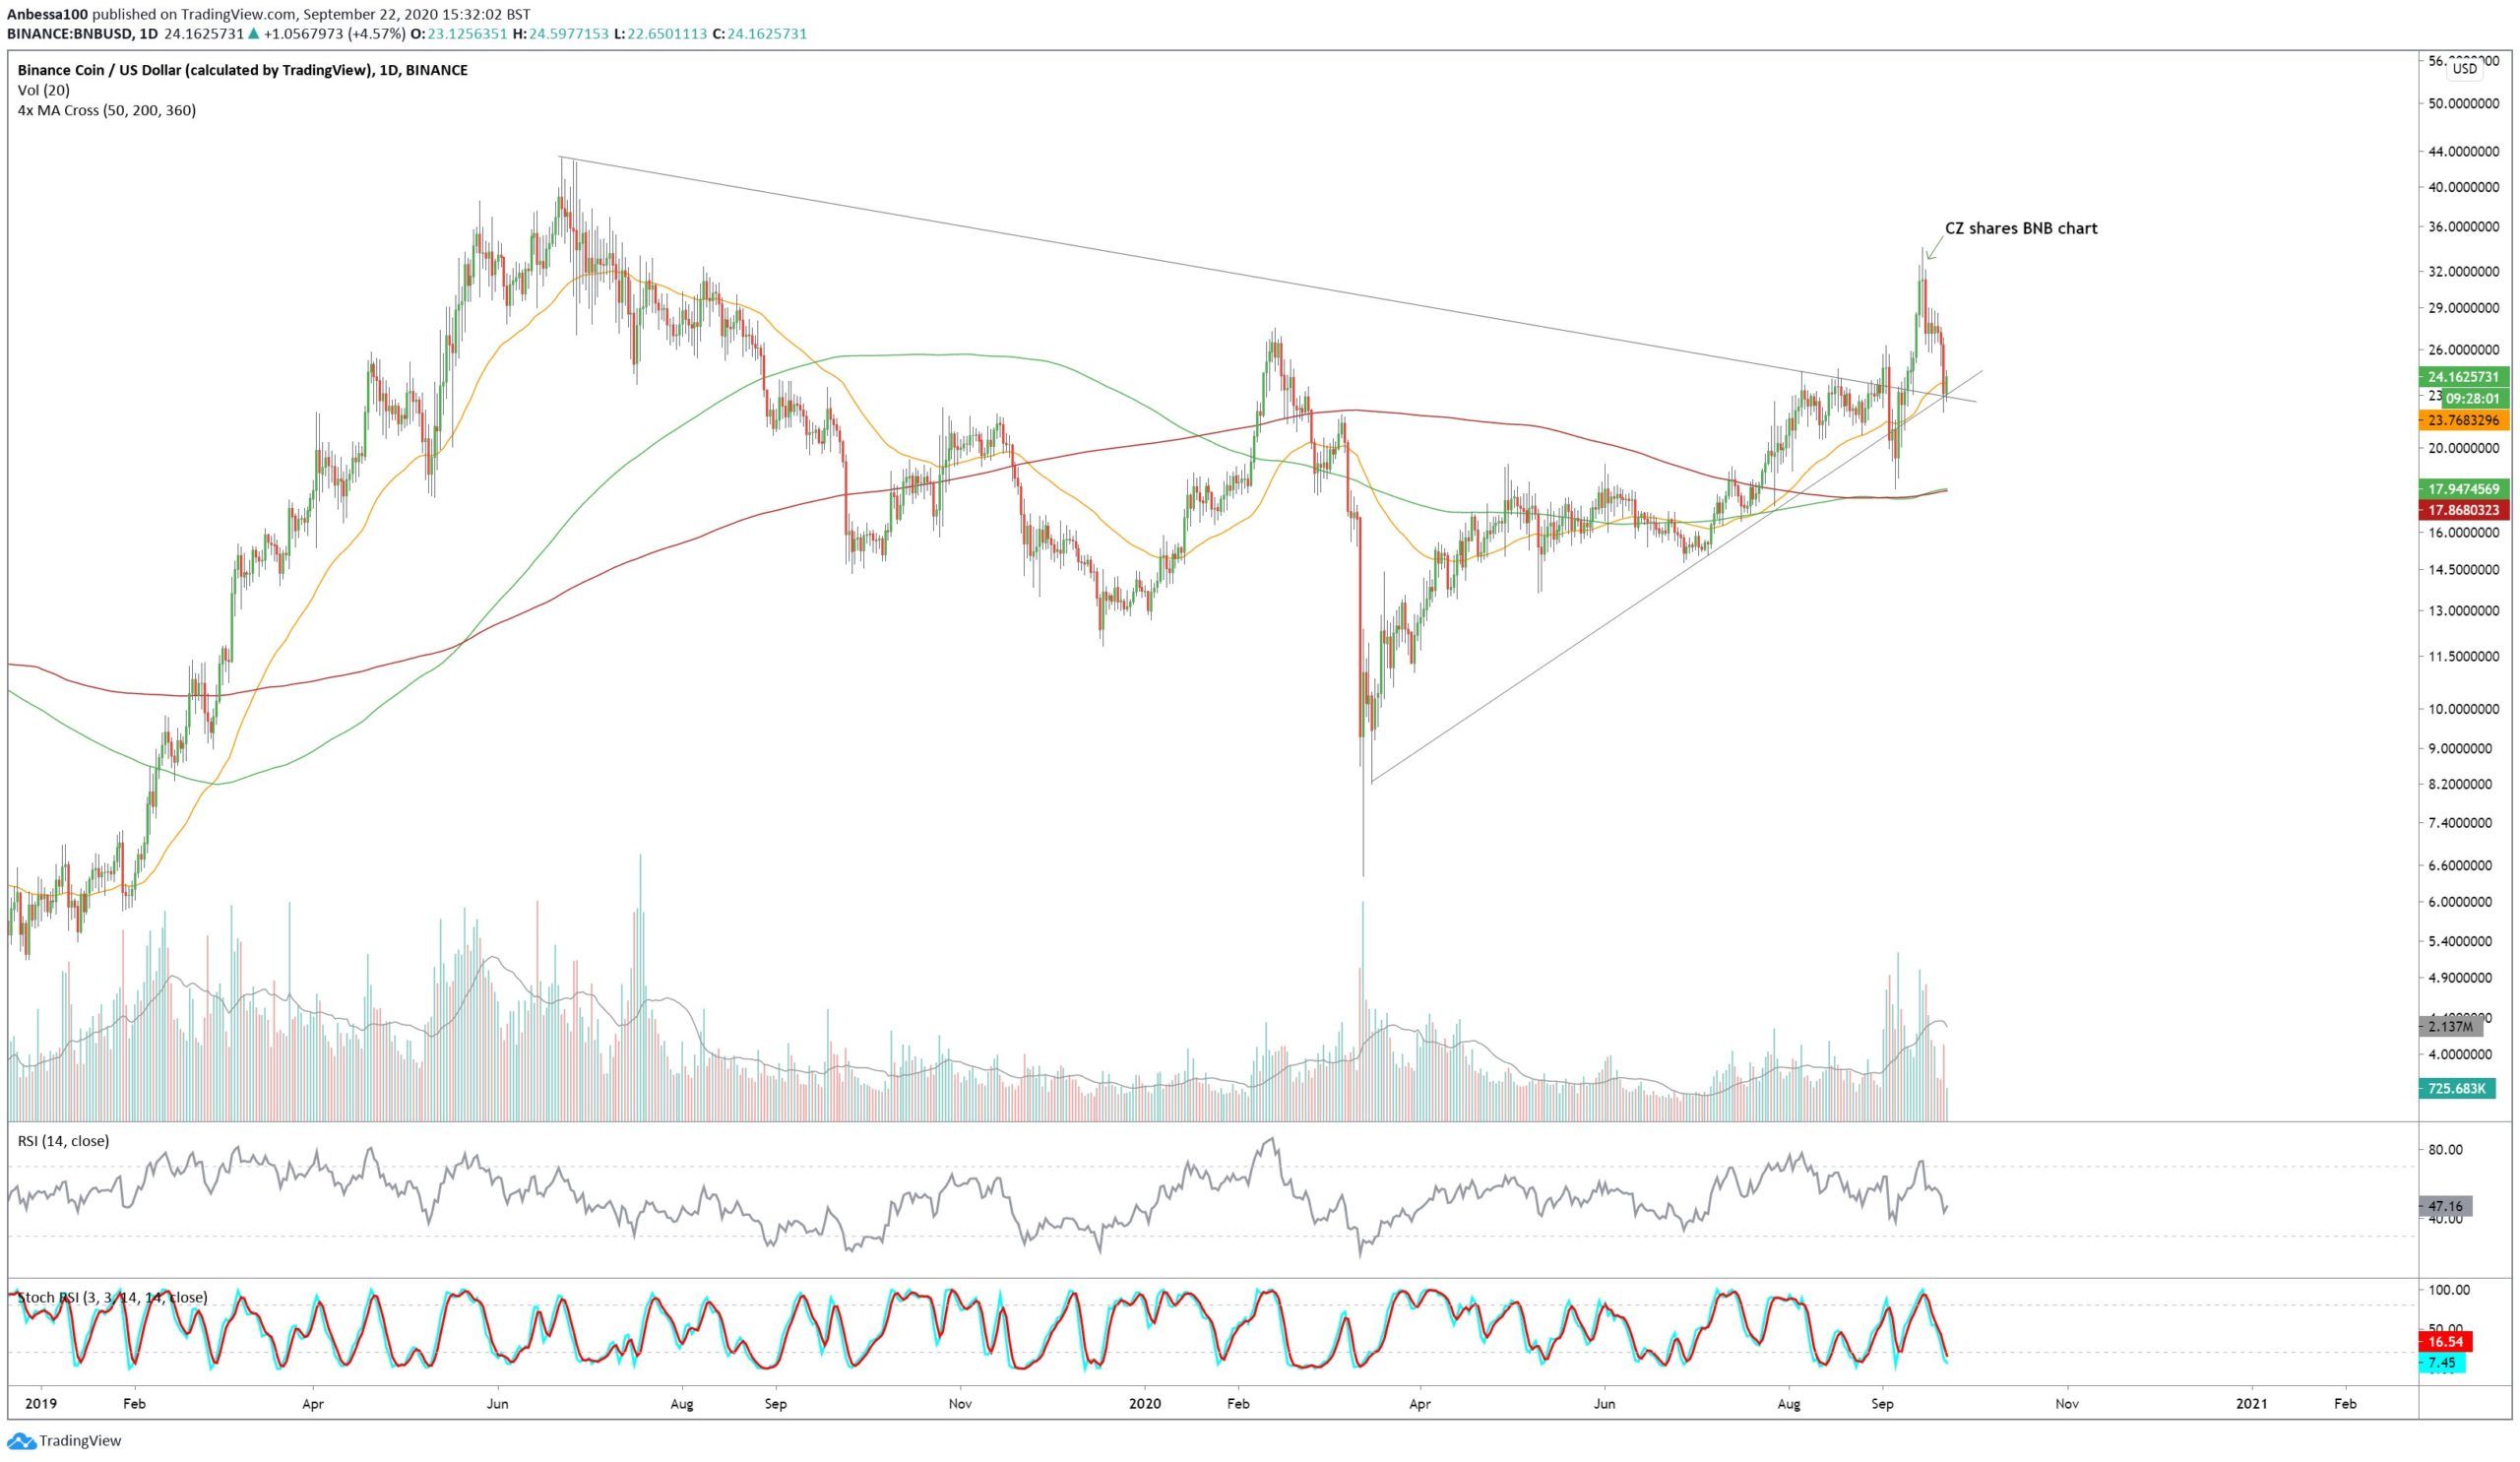
While the price is indeed resting at this support area, the wave count suggests that a breakdown is expected. Since March 13, the BNB price has likely completed an A-B-C correction in the upward direction (shown in white below). The fact that the A:C waves had a 1:1.61 ratio makes it likely that the Sept. 14 high was the top of the movement.
Furthermore, it is possible to outline five sub-waves (red) in the C wave.
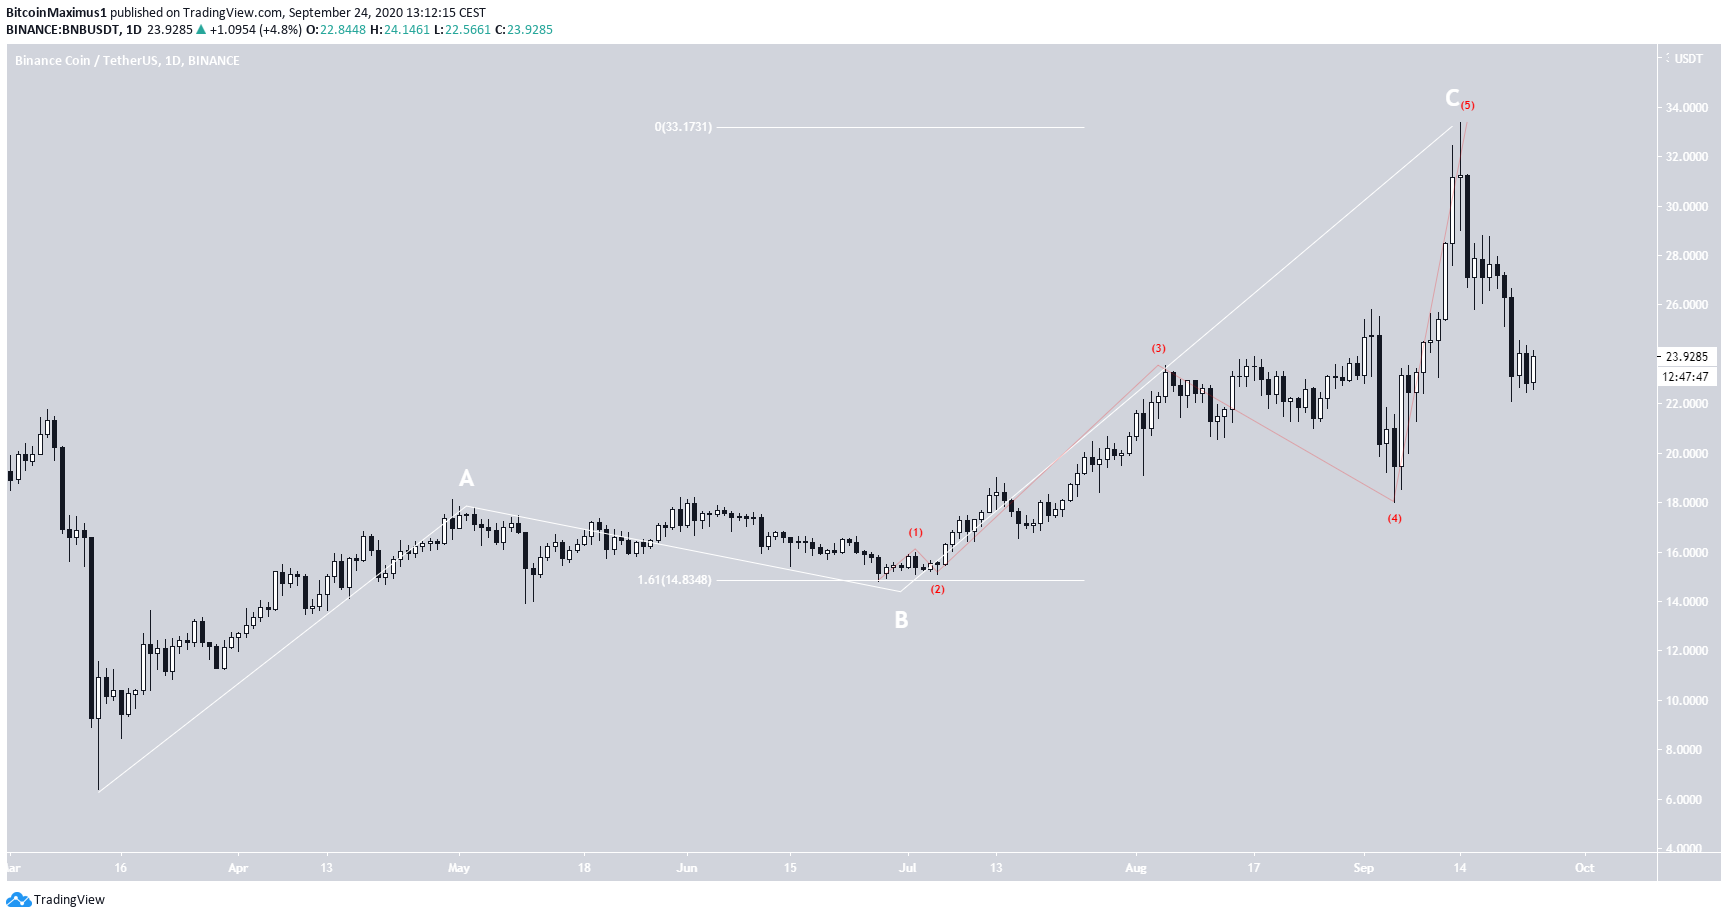
Furthermore, the decrease since the highs looks impulsive rather than corrective. Therefore, it is entirely possible that the price has begun a downward move and will decrease towards $18 and beyond.
A breakdown from the aforementioned ascending support line would confirm this possibility.
To conclude, it is likely that the BNB price has reached a local top and will continue decreasing. A breakdown from the current ascending support line would indicate that the downward trend has begun.


