


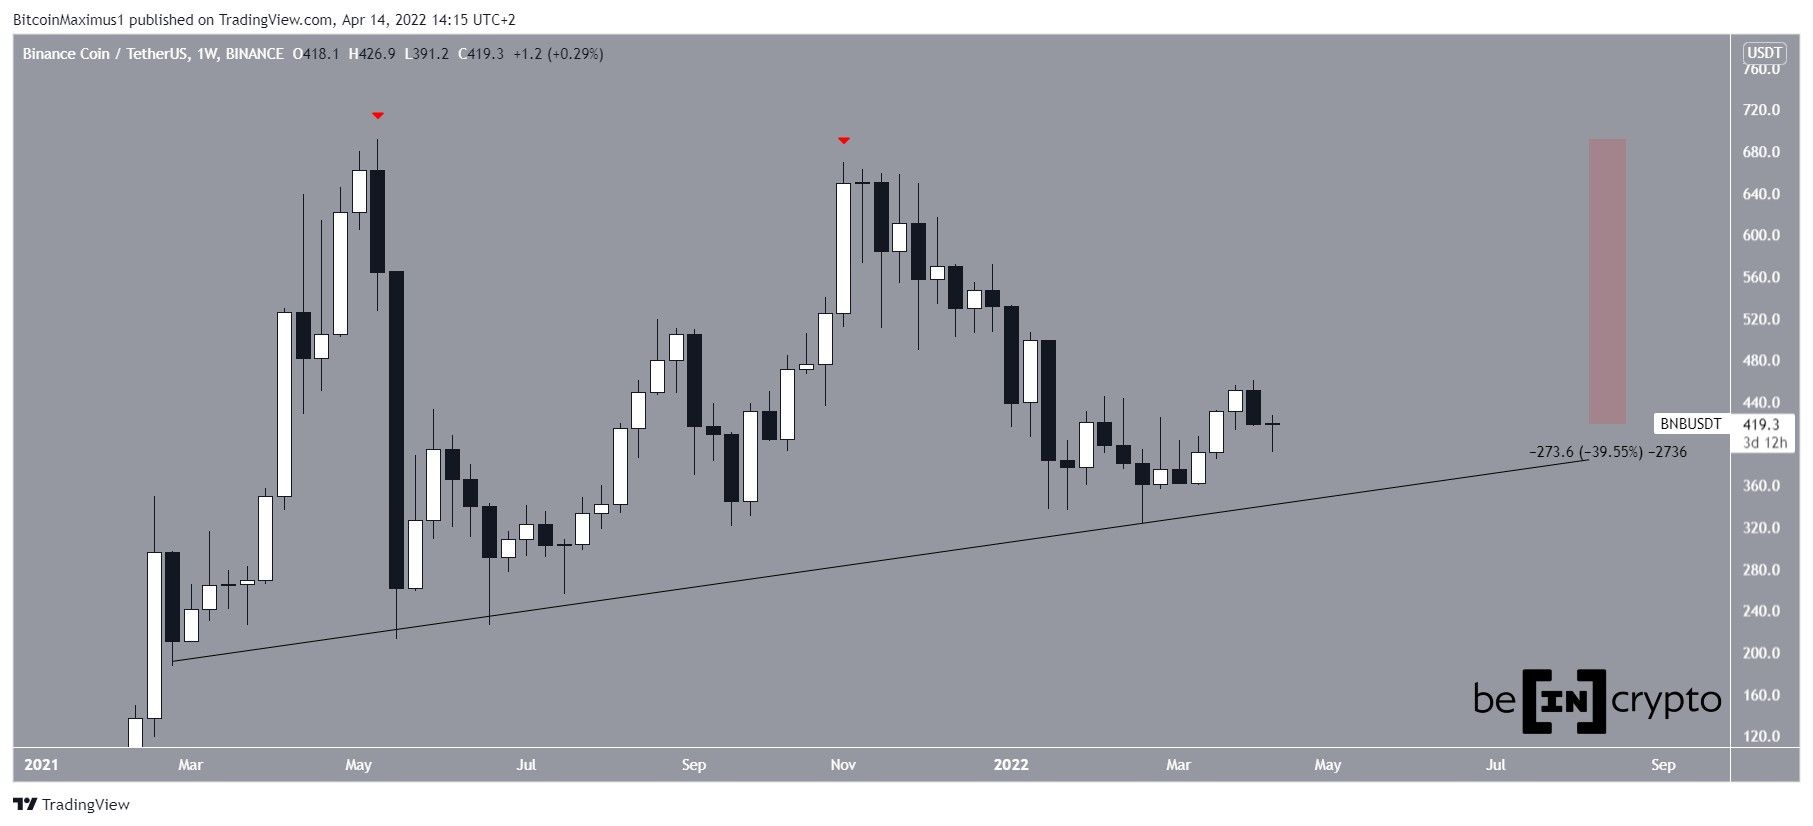
Binance Coin (BNB) is consolidating between resistance and support, with no clear sign as to the direction of the future trend.
Since reaching its all-time high (ATH) price of $691.80 on May 10 of last year, BNB has continued its declining pattern. After a sharp fall, the price bounced but ended up creating a lower high (red icon) on Nov. 7.
It has been falling more gradually since.
Fast forward to 2022, BNB reached a low of $323.50 on Feb. 24. The low served to validate a long-term ascending support line that has been in place since Feb. 2021. Each time BNB has bounced at it, it has created a very long lower wick.
The line is currently at $350. Measuring the from its ATH, BNB has so far decreased by 39.50%.
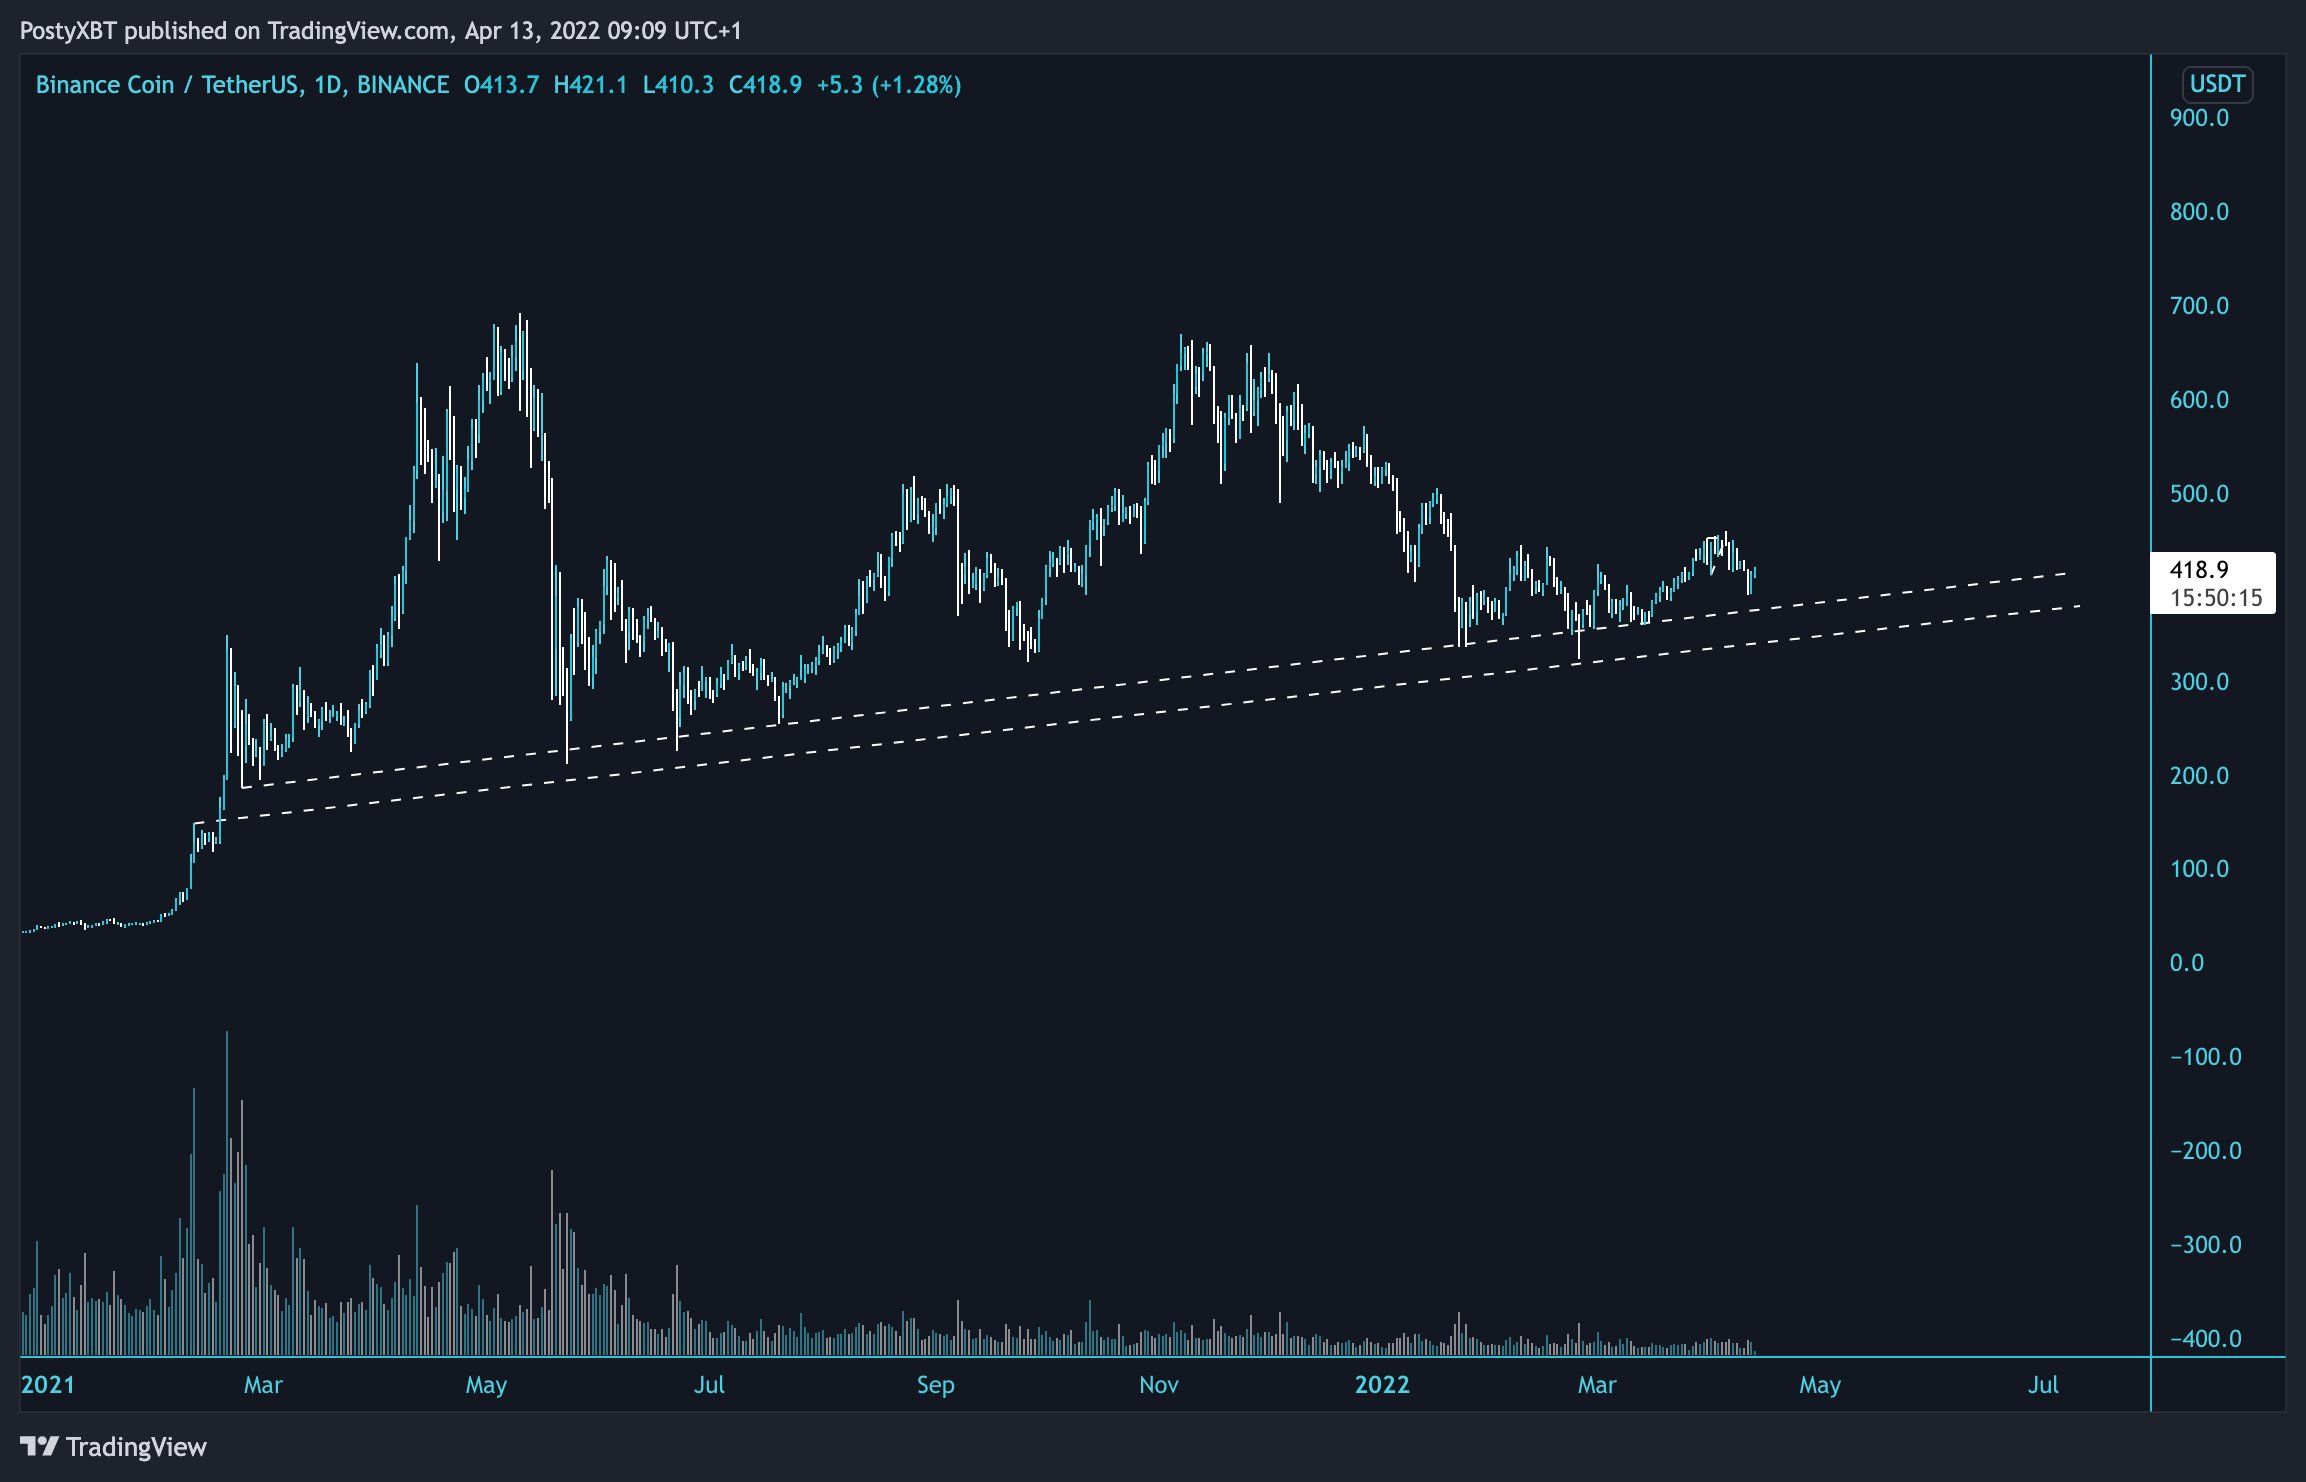
Cryptocurrency trader and investor @PostyXBT tweeted a chart of BNB, which shows the price bouncing at a long-term ascending support line, which coincides with the one outlined above.
Current consolidation
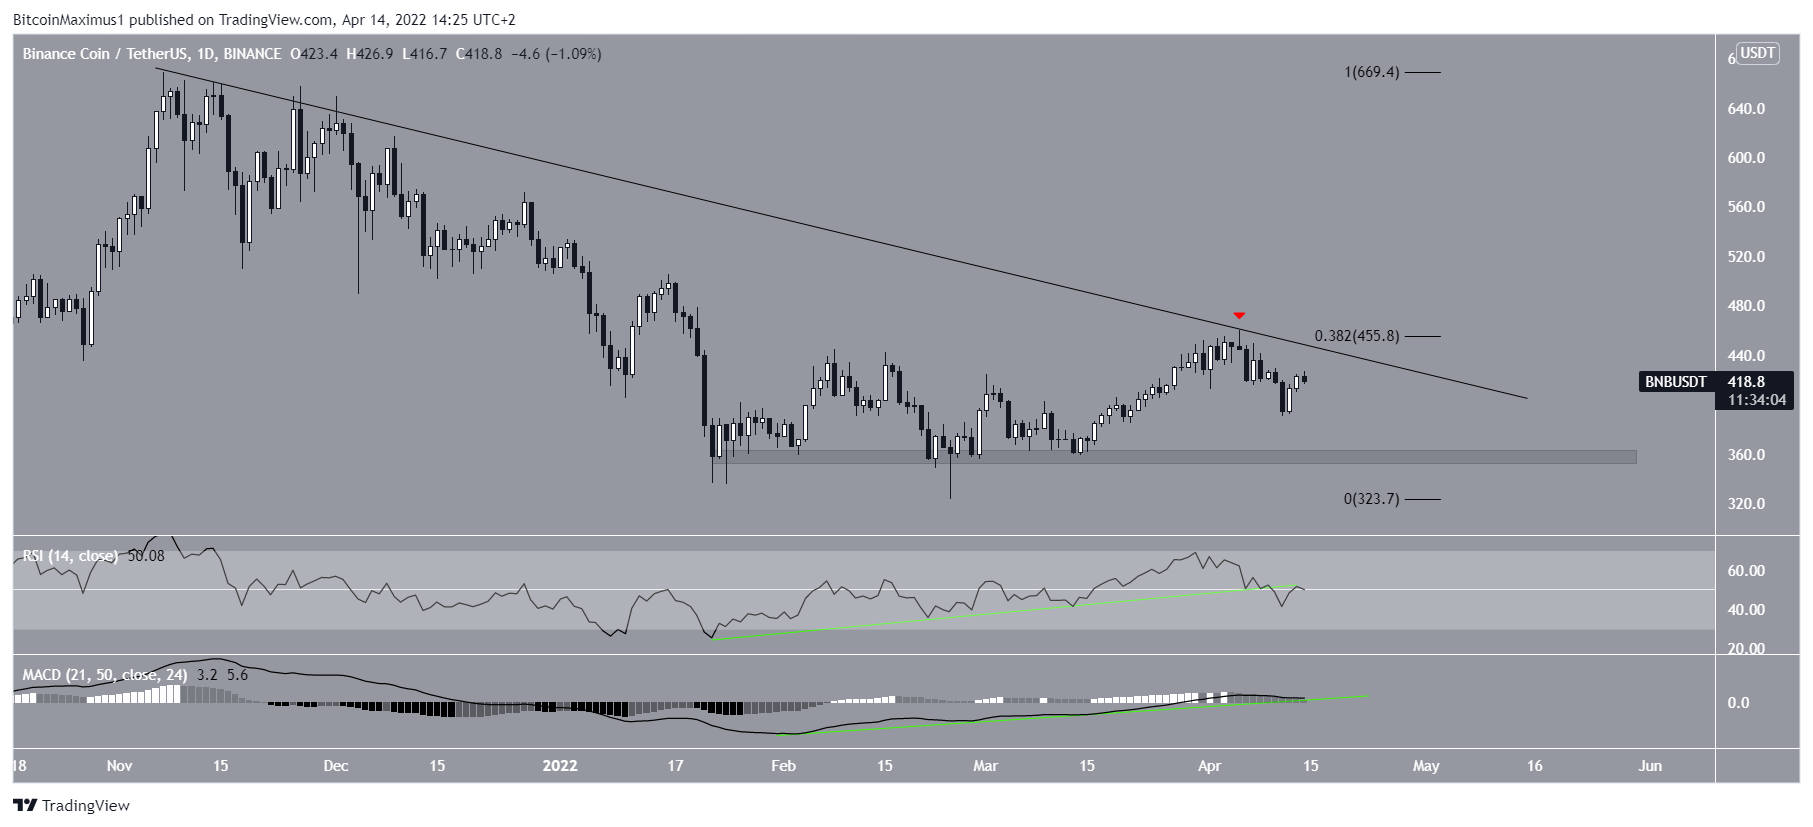
The daily chart shows that BNB has been decreasing underneath a descending resistance line since Nov. 7. So far, it has been rejected by the line five times, most recently on April 5.
Technical indicators provide mixed readings.
The upward movement was preceded by bullish divergences in both the MACD and RSI (green lines). However, while the trendline is still intact in the MACD, the RSI has already broken down below it.
The RSI is currently at 50 while the MACD is close to 0. Both of these are considered signs of a neutral trend.
Therefore, technical indicators in the daily time frame provide mixed readings.
The closest support area is at $360, while the closest resistance area at $455.
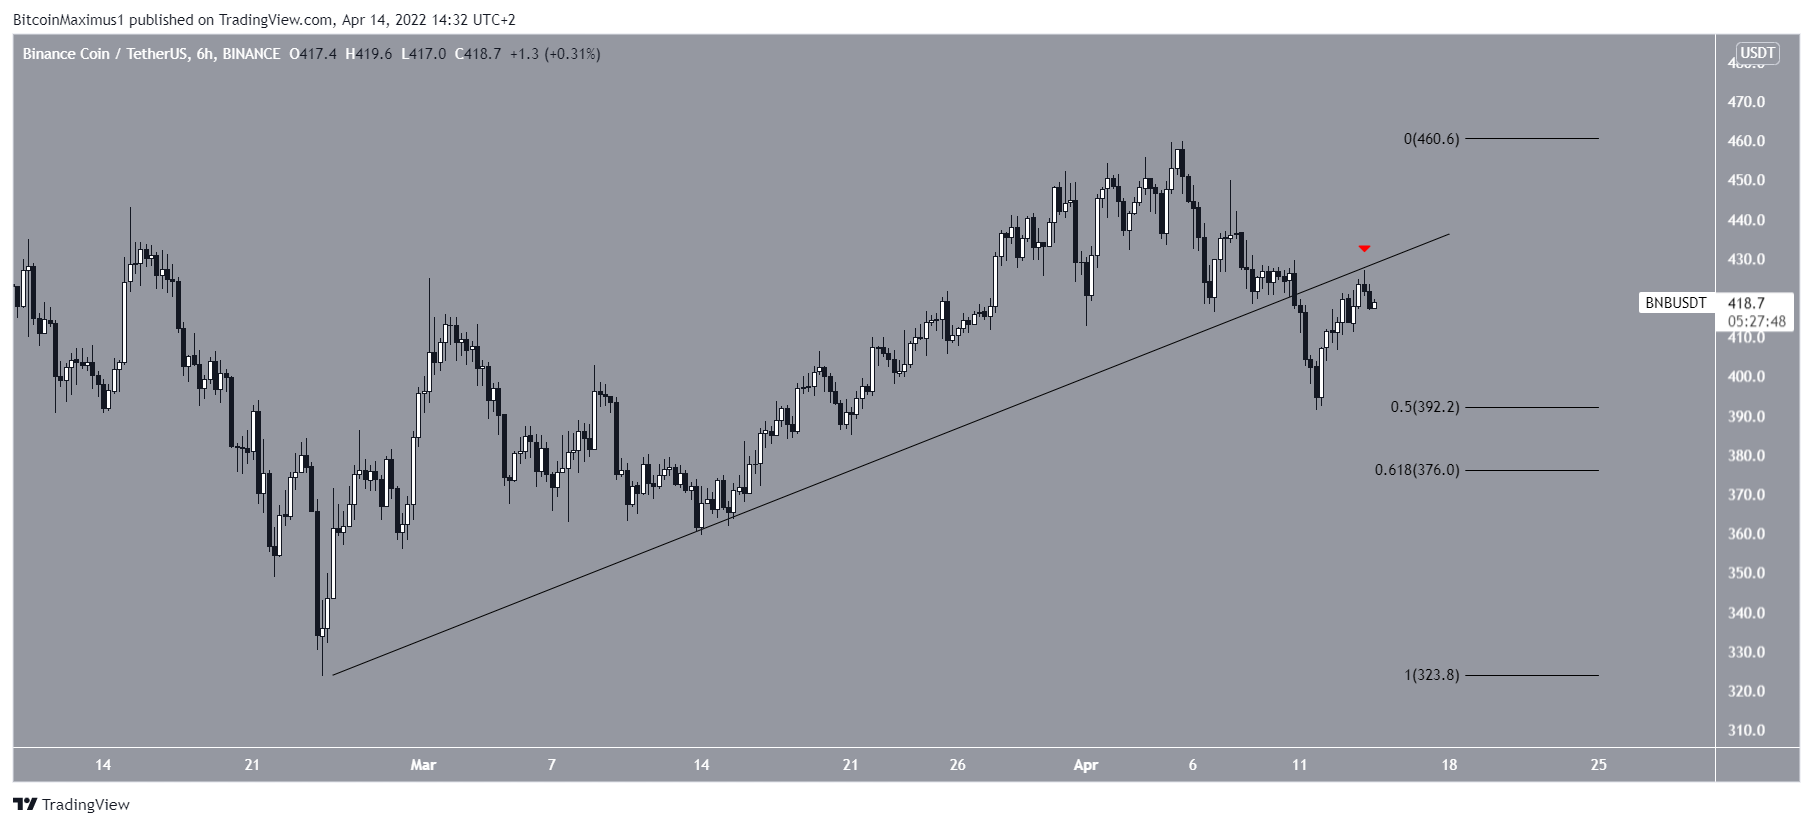
However, the six-hour time frame is more bearish, since it shows that BNB has broken down from an ascending support line and validated it as resistance afterwards.
While BNB bounced at the 0.5 Fib retracement support level, it has failed to reclaim the previous ascending support line. If it is not successful in doing so, another drop towards $376 could transpire.
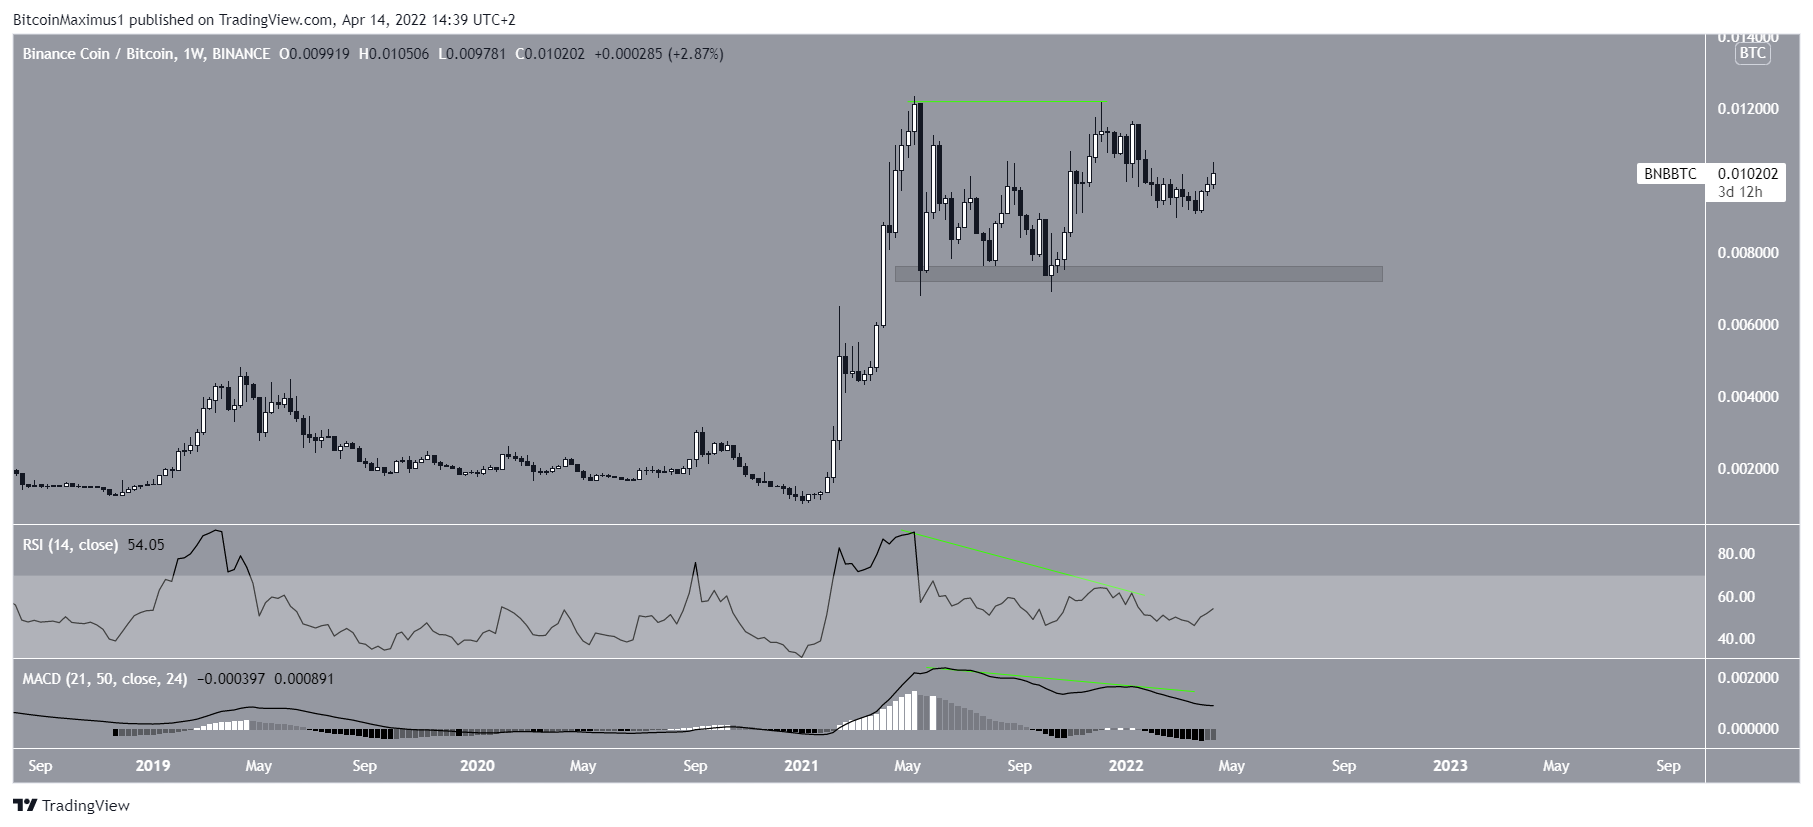
BNB/BTC
The BNB/BTC chart is more decisively bearish. It shows that the price has created a double top in the period between May – Dec 2021. The double top is considered a bearish pattern, meaning that it leads to downward movements the majority of the time.
In addition to this, the pattern has been combined with bearish divergences in both the RSI and MACD (green lines).
If the downward movement continues, the closest support area would be at ₿0.0074.
For Be[In]Crypto’s latest Bitcoin (BTC) analysis, click here.
What do you think about this subject? Write to us and tell us!


