

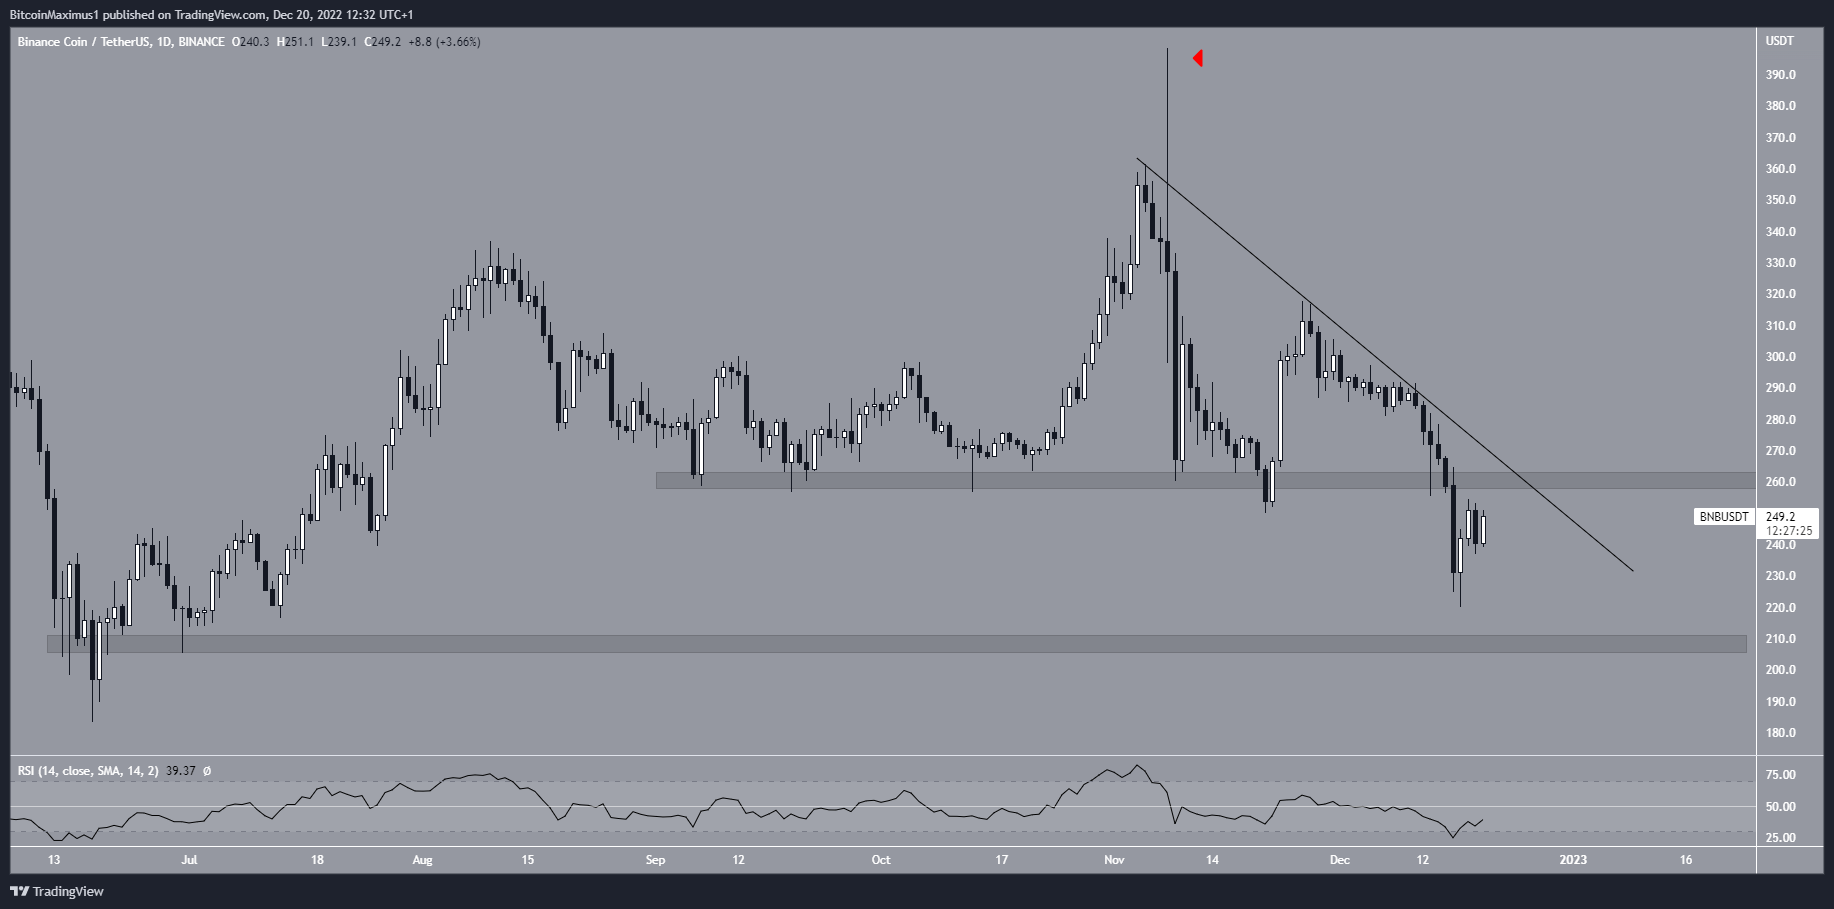
The Binance Coin (BNB) price broke down from the $260 horizontal support area. It is gearing up for an attempt at reclaiming it.
BNB Bounces After Voyager Acquisition
BNB is the native token of the Binance exchange and the Binance Smart Chain. The BNB price has decreased underneath a descending resistance line since reaching a high of $398.30 on Nov. 3. The same day, it created a massively long upper wick (red icon). The downward movement led to a low of $220 on Dec. 17 and caused a breakdown from the $260 horizontal support area.
The BNB price has increased since. The recent acquisition of Indonesian exchange Tokocrypto and the assets of bankrupt crypto lender Voyager Digital could have aided the increase. Voyager announced that it selected Binance.US as the highest bidder for its assets, in a bid amounting to $1.022 billion.
In order for the trend to be considered bullish, the Binance Coin price has to reclaim the $260 resistance area and break out from the descending resistance line. If it fails to do so, it could fall toward the next support area at $207.
While the daily RSI is below 50, it just moved outside of its oversold territory. As a result, the readings from the daily time frame are insufficient to determine the future trend’s direction.
Interestingly, opinions of various crypto experts on whether Binance will suffer the same fate as FTX are also divided.
Wave Count Supports More Downside
While the daily time frame does not offer a decisive direction for the trend, the wave count suggests that the BNB price faces more downside.
Since the aforementioned Nov. high, the Binance Coin price has been mired in an A-B-C corrective structure (black). Currently, waves A:C have a 1:0.618 ratio, which is relatively common in such structures. However, the sub-wave count (white) indicates that another drop is expected.
If the count is correct, the BNB price will complete sub-wave four at the resistance line before falling toward $207. Breaking out from the resistance line would invalidate this bearish BNB price projection.
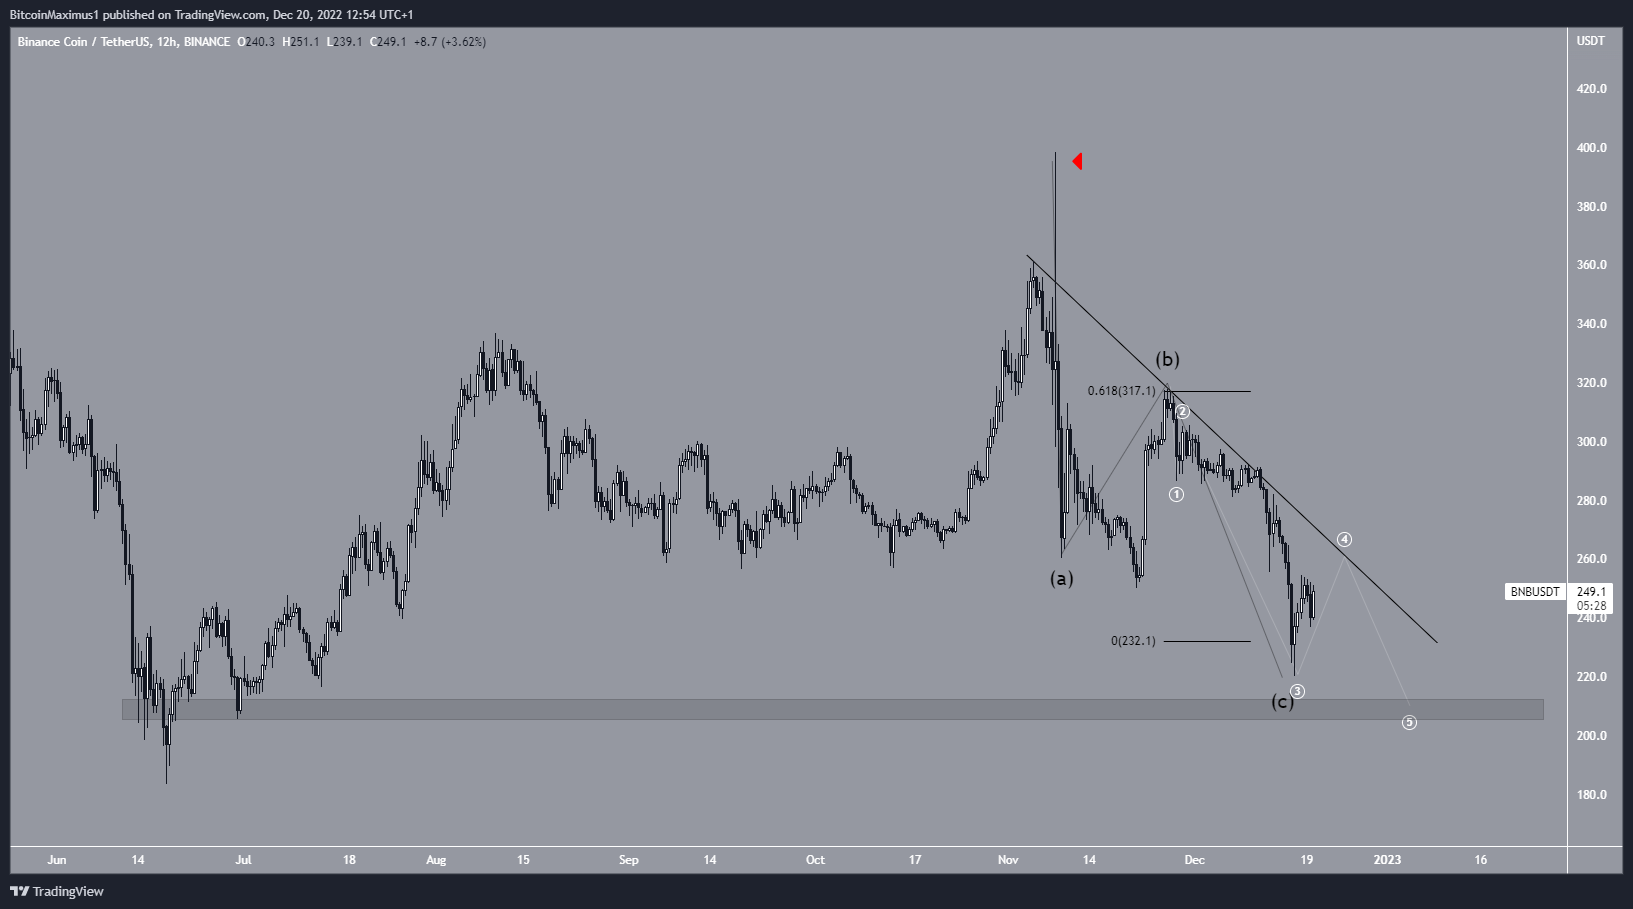
To conclude, the most likely price forecast for BNB is a re-test of the resistance line and a drop toward $207. Breaking out from the resistance line would indicate that a bullish reversal has begun.
For BeInCrypto’s latest crypto market analysis, click here.
Disclaimer
In line with the Trust Project guidelines, this price analysis article is for informational purposes only and should not be considered financial or investment advice. BeInCrypto is committed to accurate, unbiased reporting, but market conditions are subject to change without notice. Always conduct your own research and consult with a professional before making any financial decisions. Please note that our Terms and Conditions, Privacy Policy, and Disclaimers have been updated.
