


The BNB price has successfully completed a double-bottom pattern. Since Feb 6, the rate of increase has accelerated and the price has increased by 25%.
BNB Highlights
- The BNB price has successfully completed a double-bottom formation.
- The price is possibly following an ascending support line.
- There is support at ₿0.00205 & ₿0.0022.
- There is resistance at ₿0.0026, ₿0.0029, and ₿0.0036.
Trader and market analyst @BTC_JackSparrow outlined a BNB price chart and stated that he is exiting a percentage of his position at the current price level. His final target is given at ₿0.0029.
$BNB +25%
Scaling out of left over position here pic.twitter.com/d0B4jvQa94
— //Bitcoin 𝕵ack 🐐 (@BTC_JackSparrow) February 10, 2020
BNB Double-Bottom
On Dec 19 and Jan 9, the Binance Coin price made a double-bottom near ₿0.0018. Since then, the price has increased by almost 40%.
After the double-bottom, the price validated the breakout level at ₿0.0019 and moved upward, greatly accelerating its rate of increase.
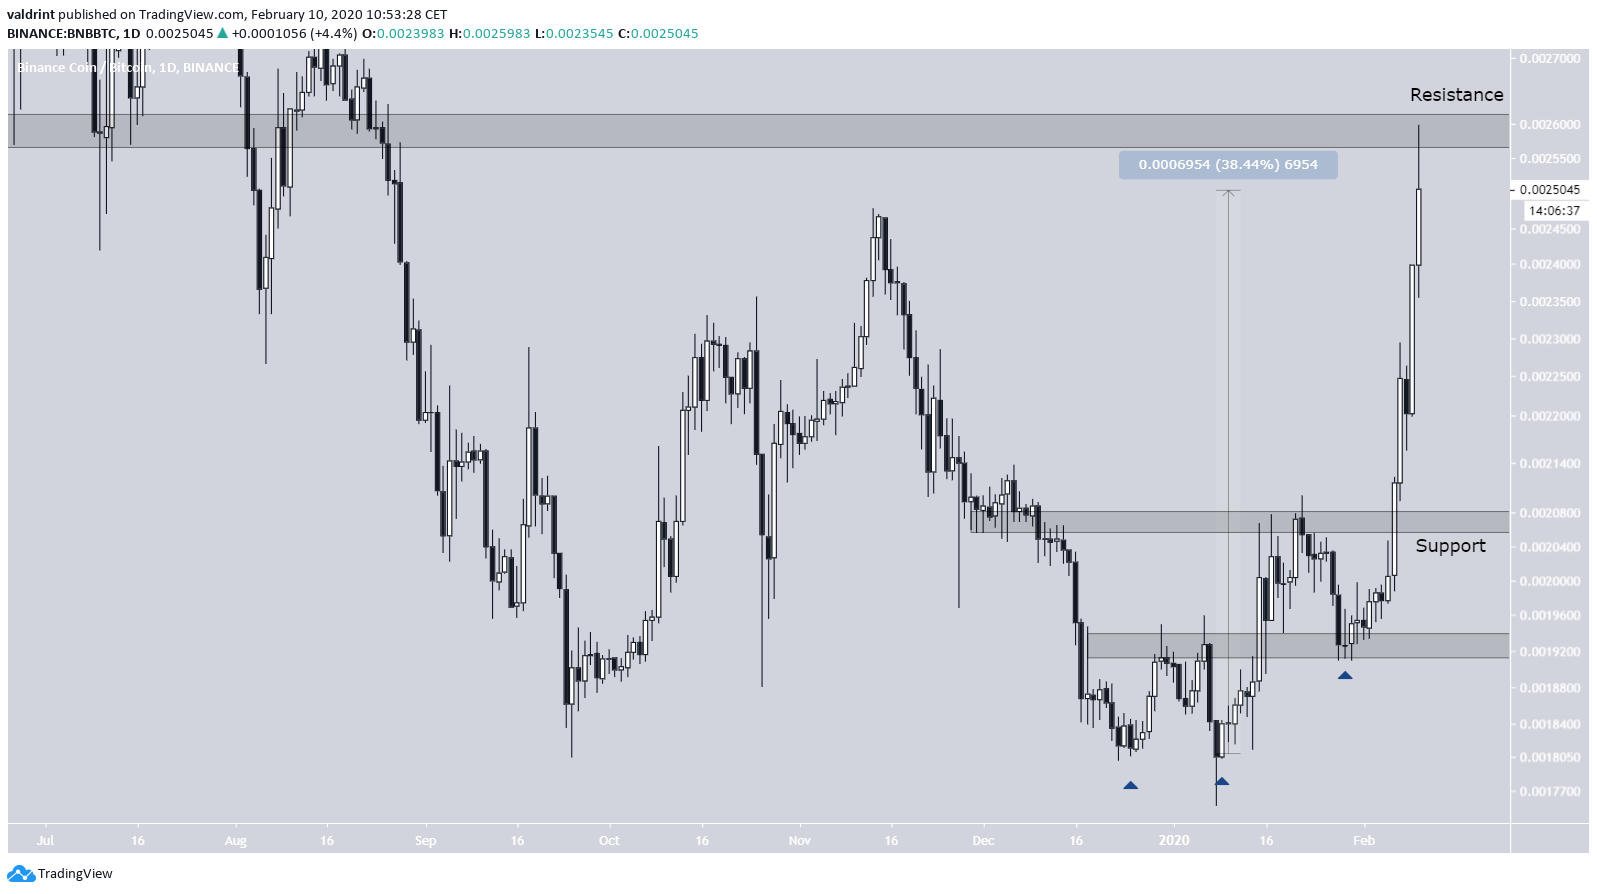
However, the price has found resistance at ₿0.0026. If BNB decreases, the breakout level at ₿0.00205 is likely to provide support in the future.
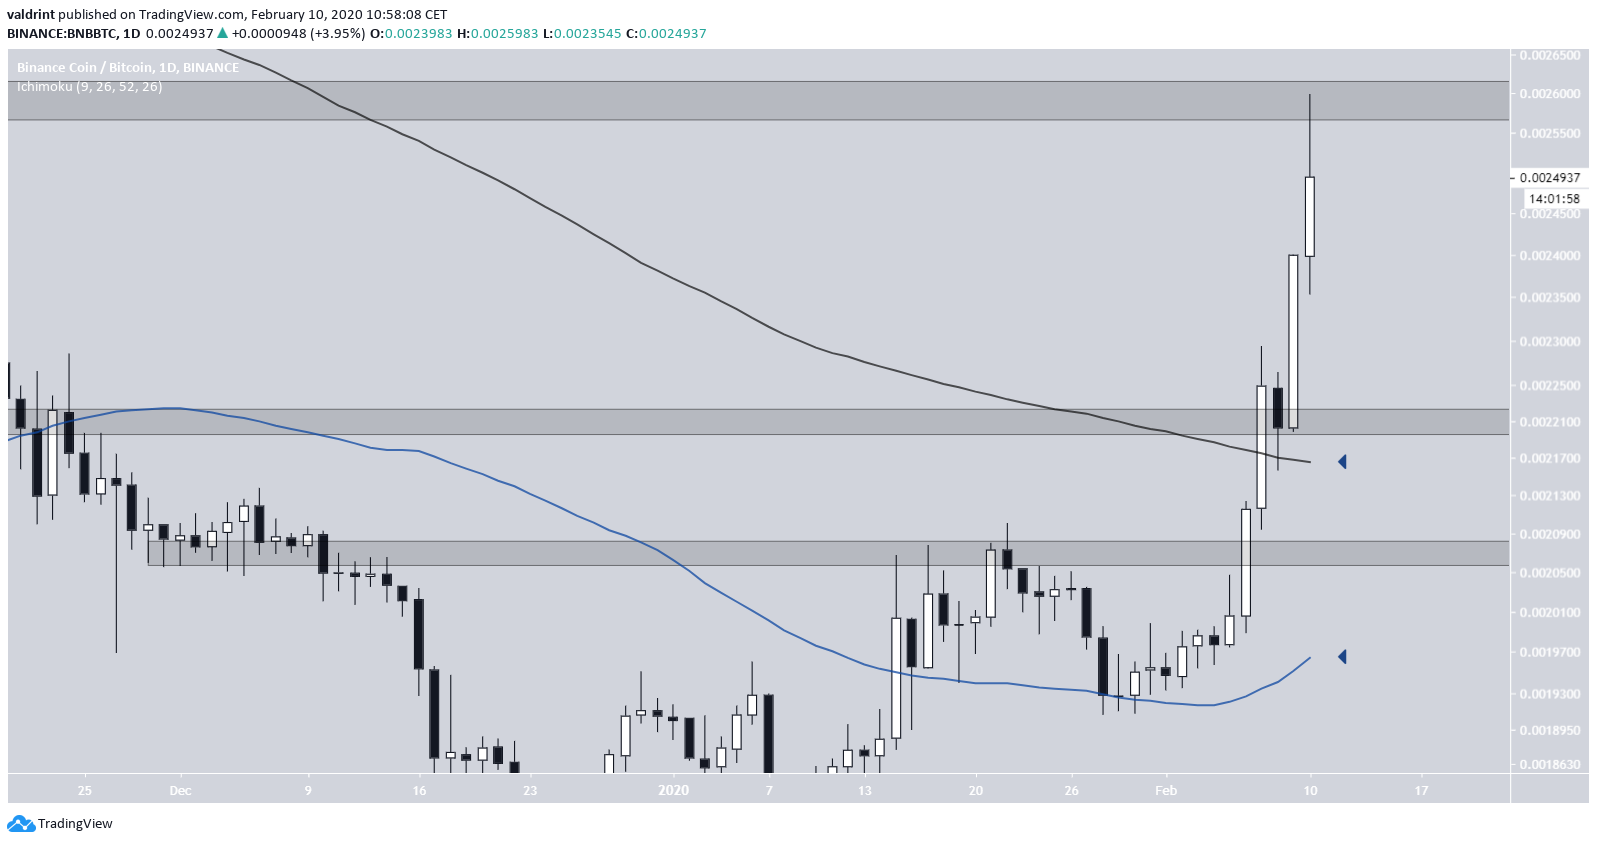
The price has moved above the 50 and 200-day moving averages (MA), the former of which has begun to turn upwards, possibly signaling that it will make a bullish cross in the future.
The 200-day MA reveals another possible support area at ₿0.0022.
Future Movement
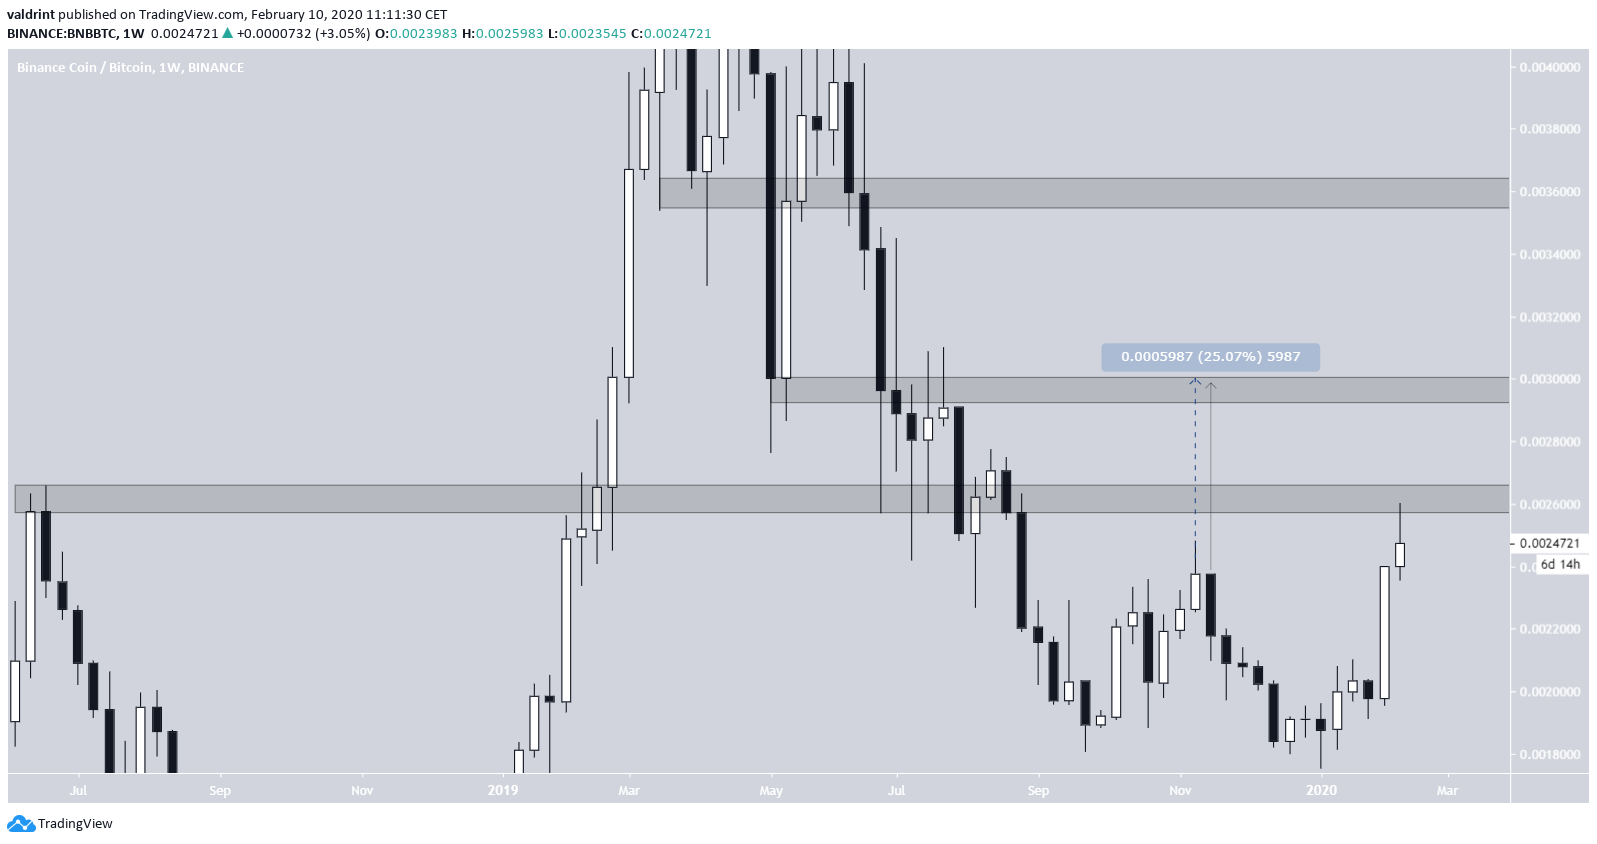
In the long-term, the price has also created a double-bottom in September and December of 2019. A movement that travels the entire height of the pattern would take the price to ₿0.0029, fitting very well with the target given in the tweet. This would make for an increase of 26%.
Unlike the shorter-term double-bottom, the price has yet to validate the breakout level. The next target is given at ₿0.0036 — very close to the all-time high price.
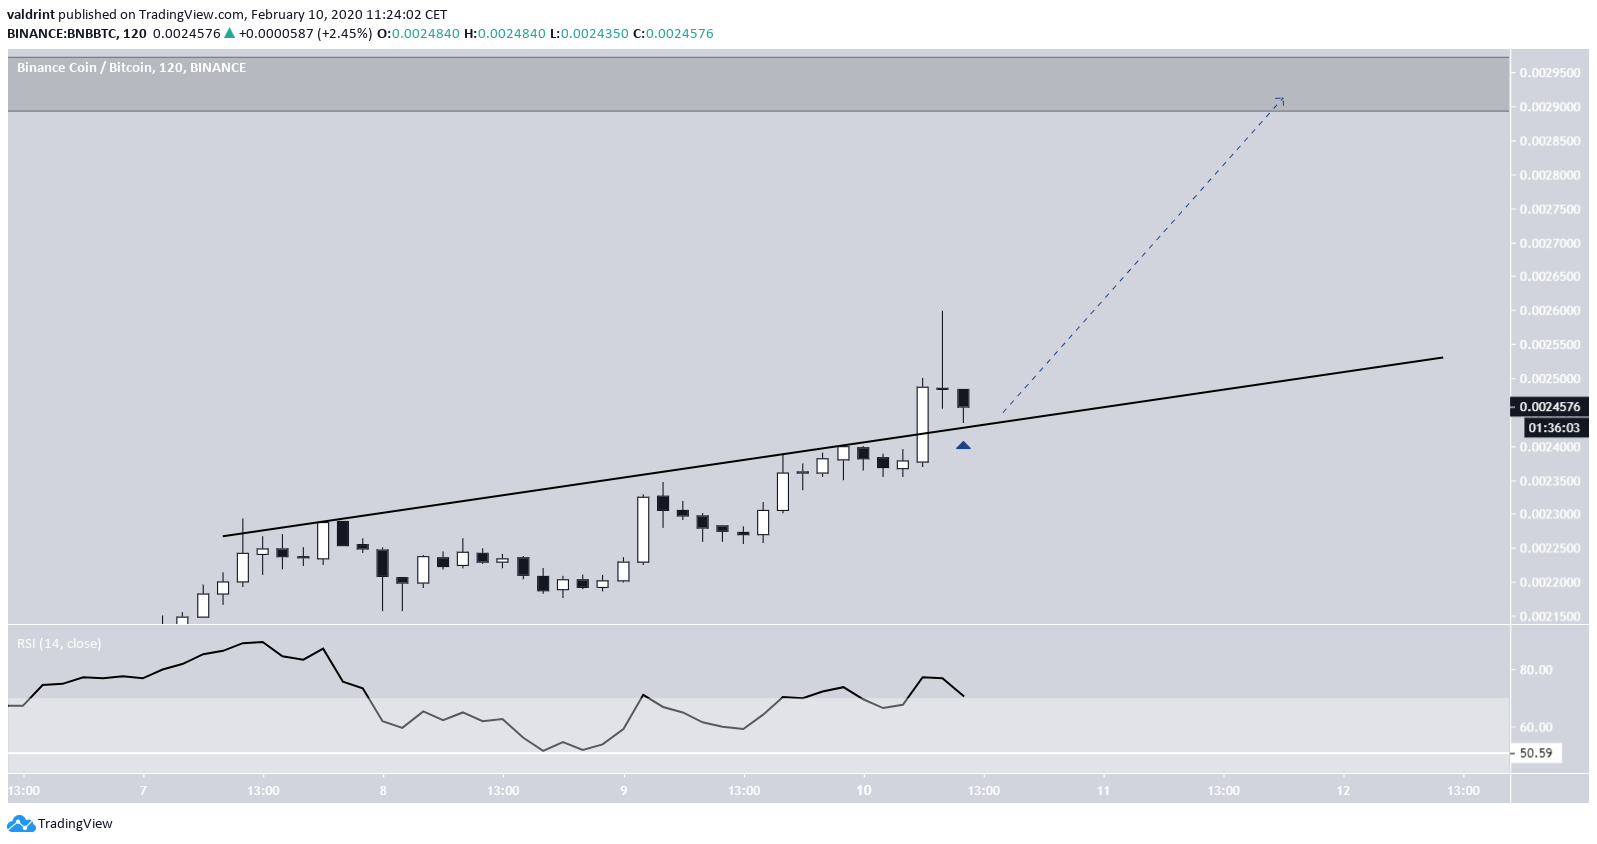
In the short-term, there is a possible resistance (now turned support) ascending line that the price is following. It is currently in the process of validating it as support, and a bounce on this line could be the initiator of the move towards ₿0.0029.
In addition, even though the short-term RSI is overbought, it has yet to generate any trace of bearish divergence, so the move is likely to continue.
To conclude, the BNB price has created double-bottoms in both the short and long-term and has broken out above local resistance. It is expected that the upward move will continue at least until the price reaches the ₿0.0029 resistance area.


